
Are you finding it tough to tell if a market trend is truly powerful or just a short-lived spike? In 2025’s fast-moving trading landscape, having a reliable tool to measure trend strength is essential. That’s where the average directional index comes in—a proven indicator trusted by traders worldwide.
This guide will help you master the average directional index, from understanding its basics to applying it in real trades. We’ll break down how it works, how to calculate it, and how to use it for smarter trading decisions. Ready to level up your strategy? Let’s get started.
What Is the Average Directional Index (ADX)?
Understanding the average directional index is crucial for any trader aiming to navigate today’s fast-moving markets. Whether you’re a seasoned pro or just starting out, grasping this indicator’s foundations can make the difference between catching genuine trends and falling for market noise.
The Origins and Purpose of ADX
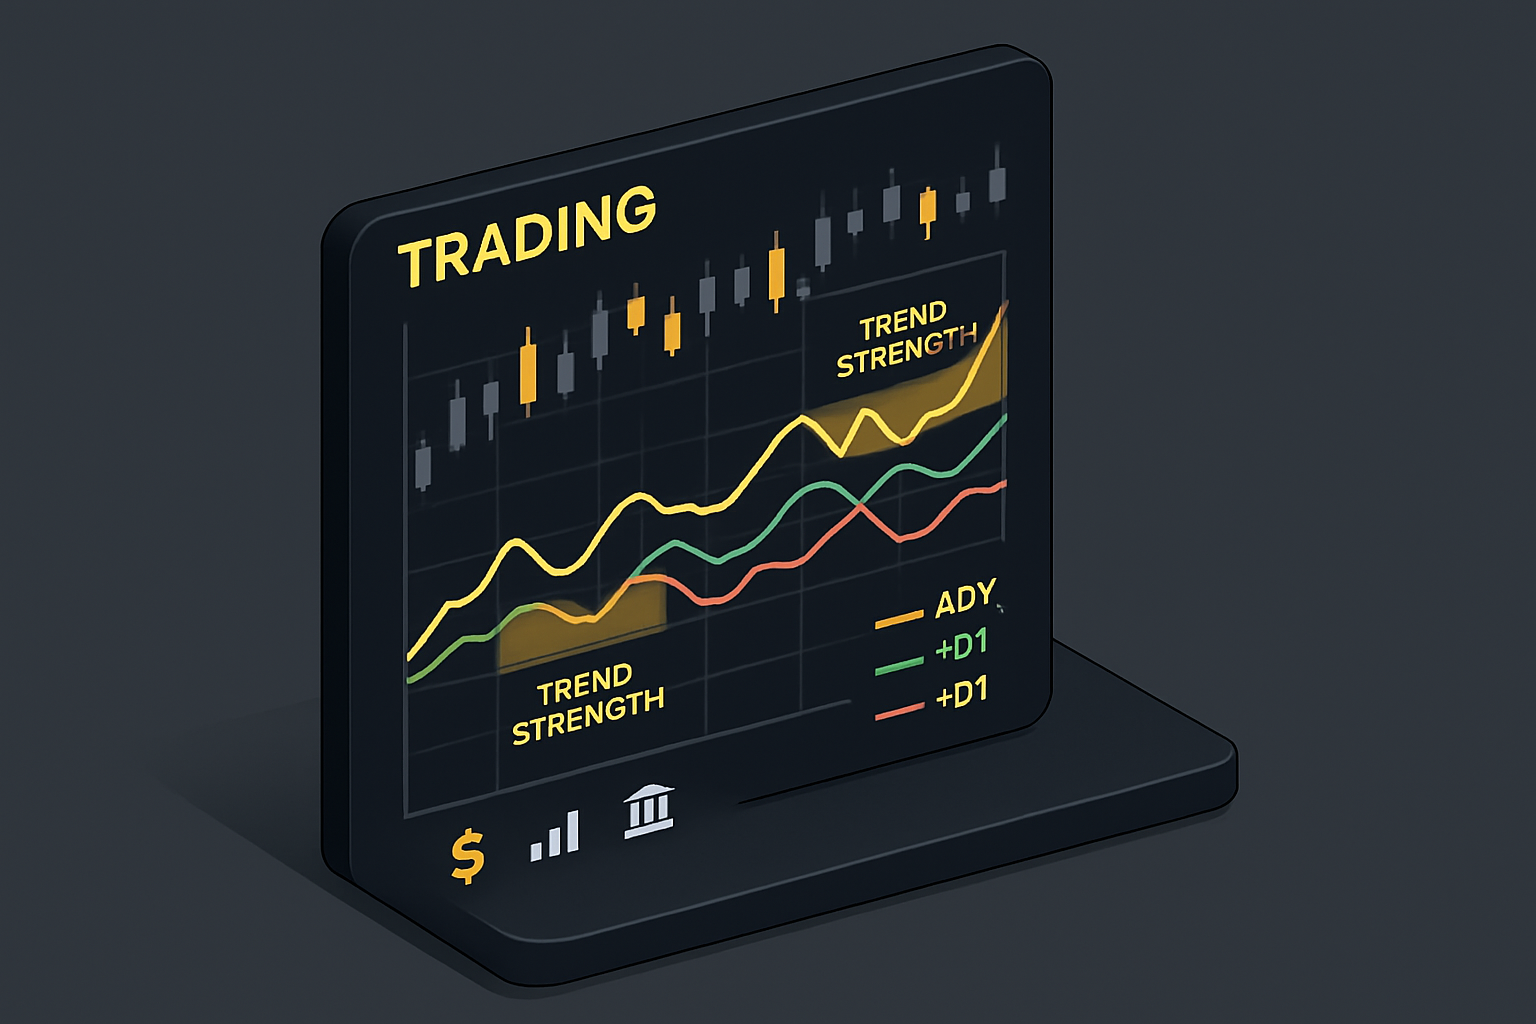
The average directional index (ADX) was introduced by J. Welles Wilder in 1978, revolutionizing technical analysis by offering a way to measure trend strength objectively. Unlike many indicators, the ADX focuses solely on the intensity of a trend—ignoring its direction. This makes it valuable in a wide range of markets, from stocks to commodities and forex. Today, you’ll find the ADX built into nearly every trading platform, and it’s cited in countless technical analysis resources. For a deeper historical perspective, see this Average Directional Movement Index overview.
How ADX Measures Trend Strength
The average directional index assigns a value between 0 and 100, quantifying how strong a market trend is at any given time. Readings below 20 signal weak or sideways movement, while values above 40 point to robust, established trends. It’s important to note that the ADX is a lagging indicator, confirming a trend only after it’s underway. The indicator doesn’t reveal whether the trend is bullish or bearish—just its strength. For example, a rising ADX during both rallies and selloffs shows its focus on intensity, not direction.
ADX vs. Other Trend Indicators
What sets the average directional index apart from other tools? Unlike moving averages, MACD, or RSI—which measure price direction, momentum, or overbought/oversold conditions—the ADX zeroes in on trend strength. It’s often used alongside these indicators for a fuller picture. The ADX’s smoothing formula also helps filter out false signals, which can be a lifesaver in volatile or choppy markets. Here’s a quick comparison:
| Indicator | Focus | Strengths |
|---|---|---|
| ADX | Trend strength | Reduces noise, trend filter |
| MA | Price direction | Simple, visual trends |
| MACD | Momentum, direction | Divergence signals |
| RSI | Overbought/sold | Reversal alerts |
Key Use Cases for Traders
Traders use the average directional index for several core reasons. First, it helps identify strong trends, which are essential for trend-following strategies. It also helps avoid whipsaws during range-bound periods, as low ADX readings warn you to stay out. The ADX is invaluable for confirming breakouts and chart patterns, making sure you’re not jumping in on false moves. In forex and crypto, many use the ADX to validate entries, only trading when the indicator supports the trend’s strength.
ADX in 2025: Continued Relevance
Despite rapid advances in AI and algorithmic trading, the average directional index remains a staple for both manual and automated traders in 2025. It’s now often integrated into multi-indicator strategies, combining classic technical analysis with modern risk controls. As market volatility continues to evolve, the ADX proves its worth by offering reliable, time-tested insights into trend strength—helping traders make smarter decisions in any market environment.
How the ADX Is Calculated: Step-by-Step
Unlocking the power of the average directional index begins with understanding its calculation process. While most trading platforms automate these steps, knowing the mechanics helps you trust the numbers and use them more effectively in your strategy.
Understanding the Components: +DI and -DI
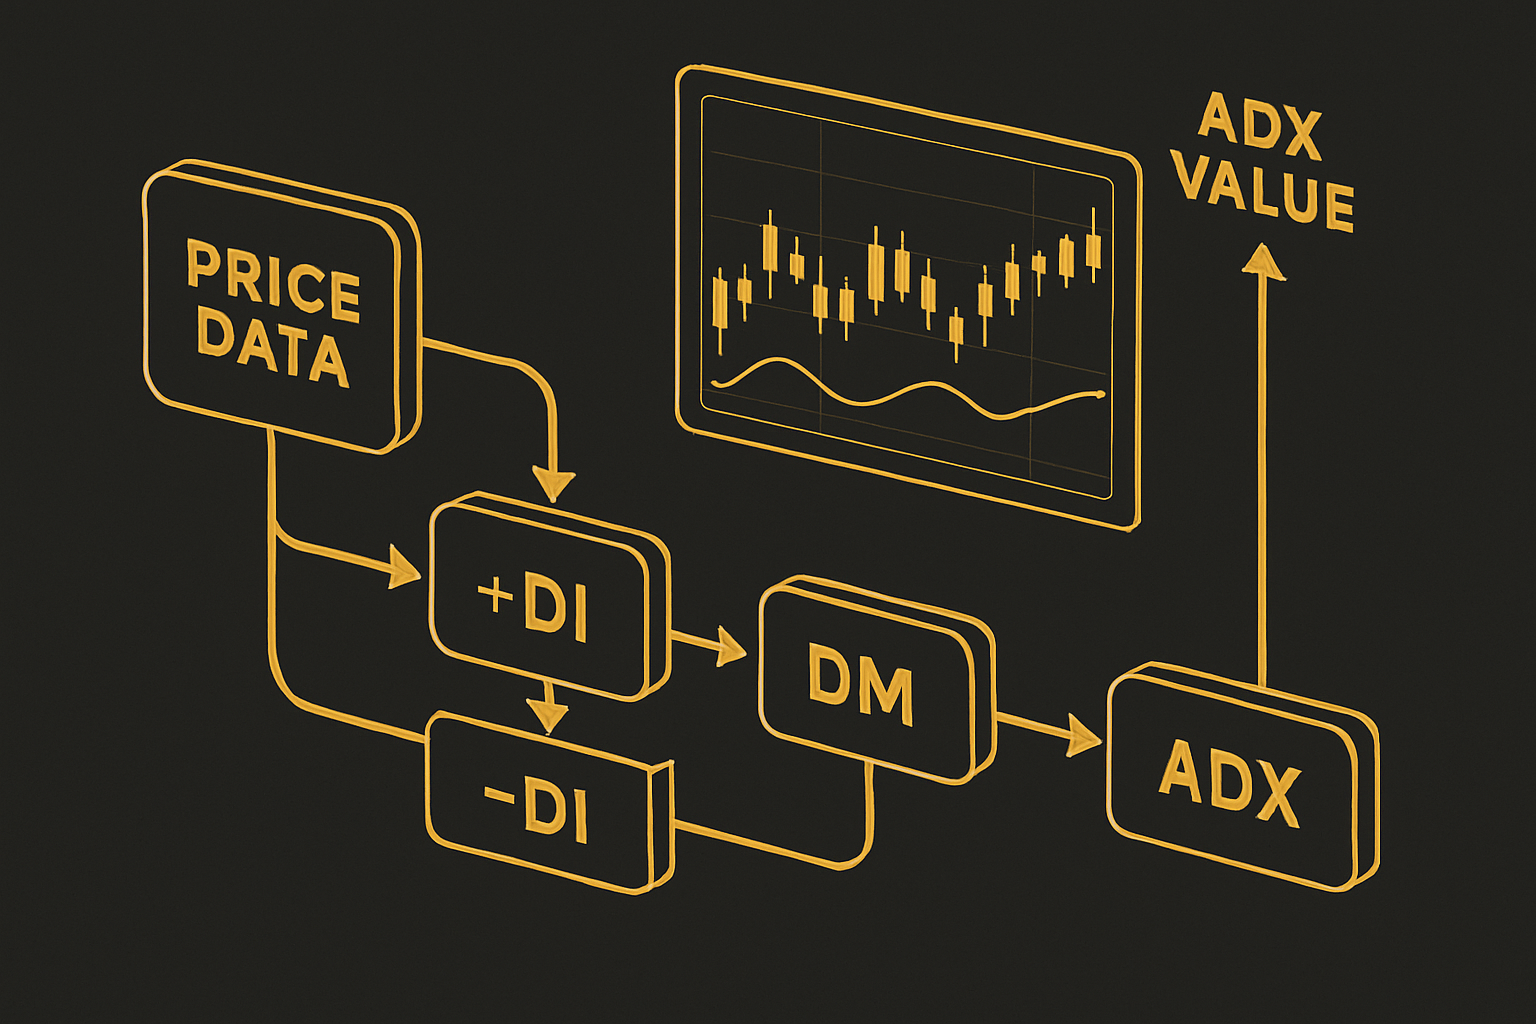
The average directional index relies on two crucial components: the Positive Directional Indicator (+DI) and the Negative Directional Indicator (-DI). These indicators are derived from recent price highs and lows, capturing the intensity of upward and downward movements.
+DI measures the strength of upward moves, while -DI reflects downward momentum. By comparing these, traders can assess whether buyers or sellers are dominating the market. Calculating +DI and -DI is the foundation for the average directional index, as they provide the context needed to quantify trend strength.
For a deeper dive into how these components interact and their role in trend analysis, Understanding the Average Directional Index (ADX) offers a comprehensive breakdown with practical examples.
Step 1: Calculating Directional Movement (DM)
The first step in calculating the average directional index is identifying the directional movement (DM) for each period. Here’s how it’s done:
- UpMove = today’s high − yesterday’s high
- DownMove = yesterday’s low − today’s low
If UpMove is greater than DownMove and also positive, that’s your +DM for the period. If DownMove is greater and positive, that’s your -DM. Only one value is assigned per period; if neither is positive, both are zero.
For example, if a stock’s high rises from $100 to $105 (UpMove = 5) and its low falls from $98 to $97 (DownMove = 1), +DM is 5 and -DM is 0. This step ensures the average directional index accurately captures the dominant movement.
Step 2: Calculating the Average True Range (ATR)
Next, volatility is factored in using the Average True Range (ATR). The ATR normalizes the DM values, making the average directional index comparable across different assets and timeframes.
Calculate the True Range (TR) for each period by finding the largest of:
- Current high − current low
- Current high − previous close
- Previous close − current low
ATR is the smoothed average of TR, usually over 14 periods. For example, in a volatile forex market, a high ATR indicates larger price swings, which directly impacts the resulting average directional index value.
Step 3: Deriving +DI and -DI Values
With DM and ATR in hand, you’re ready to calculate the +DI and -DI:
- +DI = 100 × (Smoothed +DM ÷ ATR)
- -DI = 100 × (Smoothed -DM ÷ ATR)
This step expresses each directional movement as a percentage of volatility, allowing the average directional index to provide consistent trend strength readings. For a 14-day period, you might find +DI at 25 and -DI at 15, signaling stronger upward moves.
Here’s a quick reference table:
| Indicator | Formula |
|---|---|
| +DI | 100 × (Smoothed +DM ÷ ATR) |
| -DI | 100 × (Smoothed -DM ÷ ATR) |
Step 4: Calculating the ADX Value
Finally, the average directional index itself is calculated. First, find the absolute difference between +DI and -DI, then divide by their sum:
ADX = 100 × (Smoothed Moving Average of |+DI − -DI| ÷ (+DI + -DI))
This value is then smoothed—typically over 14 periods—to filter out noise and highlight sustained trends. The ADX line is plotted alongside +DI and -DI, providing a visual cue for trend strength.
For instance, if +DI is 30, -DI is 20, and the smoothed moving average of the difference is 8, the resulting average directional index might be 26. This final number is what traders use to judge whether a trend is weak, moderate, or strong.
How to Interpret ADX Readings
Interpreting the average directional index is a key skill for any trader aiming to filter out market noise and focus on genuine trends. The ADX provides a straightforward way to gauge trend strength, but knowing how to read its signals in real-time can mean the difference between timely trades and costly mistakes.
Understanding ADX Value Ranges
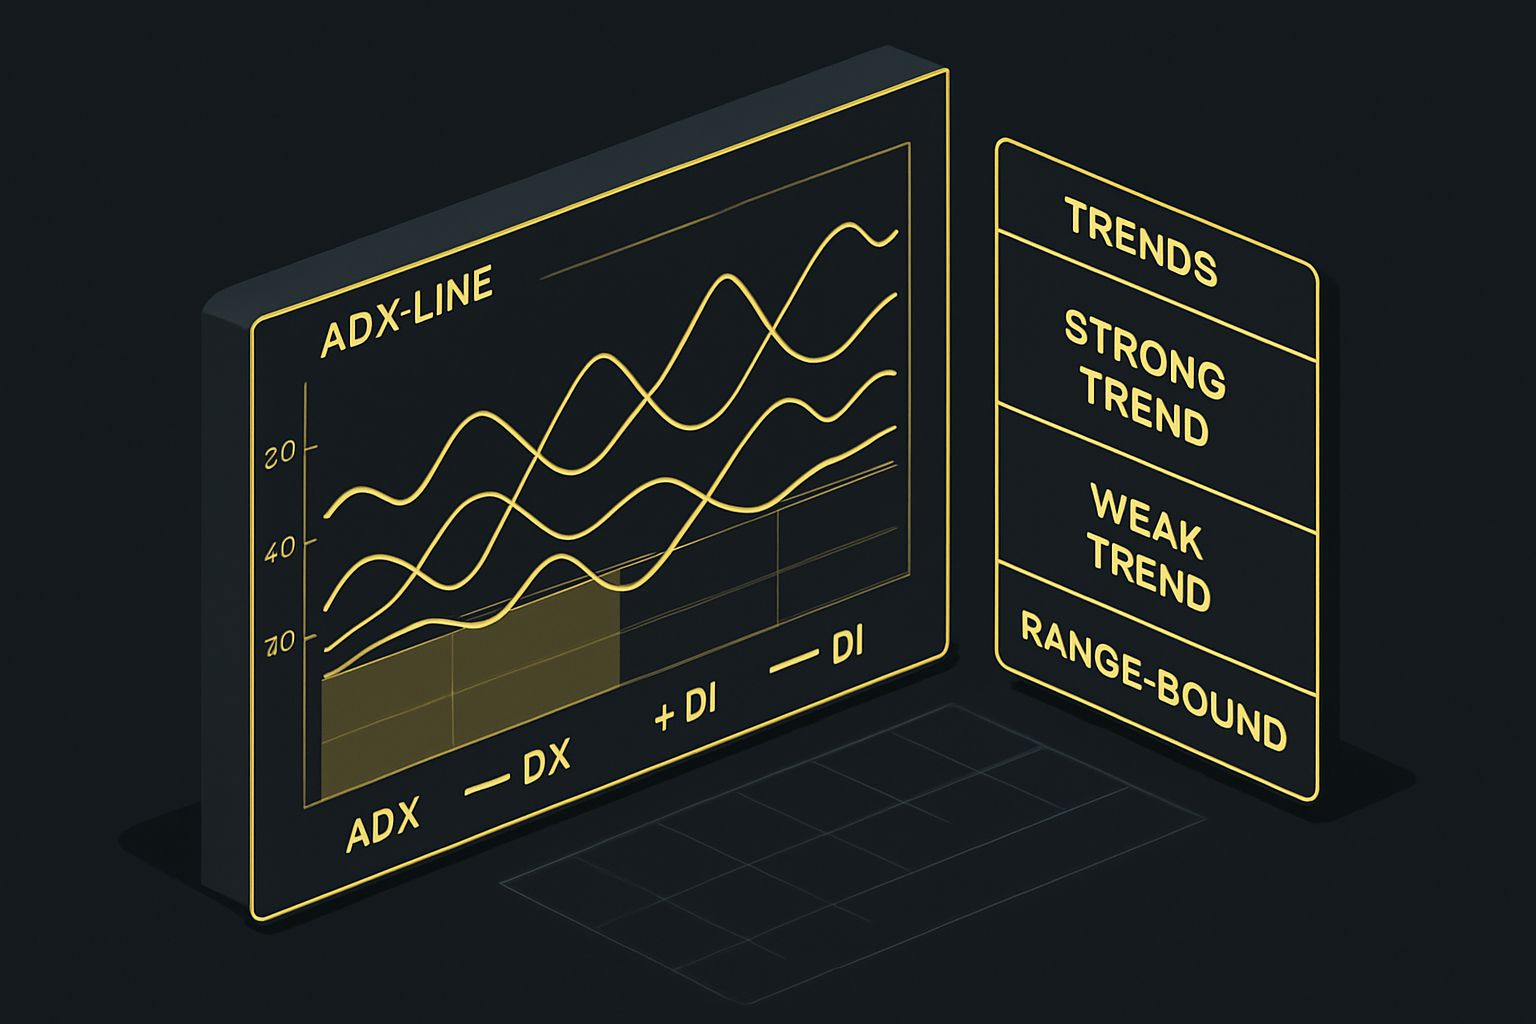
The average directional index moves on a scale from 0 to 100, and each range has its own market implication. Here’s a quick reference table:
| ADX Value | Trend Strength |
|---|---|
| 0–20 | Weak/No Trend |
| 20–40 | Developing/Moderate |
| 40–60 | Strong |
| 60–100 | Extremely Strong (rare) |
For example, when the average directional index sits below 20, markets are typically sideways—making trend-following strategies less effective. In contrast, readings above 40 signal a robust trend, a sweet spot for trend traders. Historical data often shows that the strongest market moves align with ADX values in the upper ranges, confirming the indicator’s reliability.
ADX and Trend Direction: The Role of +DI and -DI
While the average directional index excels at measuring trend strength, it doesn’t reveal direction on its own. That’s where the +DI (Positive Directional Indicator) and -DI (Negative Directional Indicator) come into play. When +DI crosses above -DI, it suggests an uptrend; the reverse signals a downtrend.
Traders often watch for these crossovers on the chart, using the average directional index as confirmation. For instance, a rising ADX with +DI above -DI may signal a strong, sustainable rally. Always remember that the ADX confirms intensity, while +DI and -DI clarify the trend’s path.
Spotting Trend Strength and Reversals
One of the most powerful uses of the average directional index is identifying when a trend is gaining or losing steam. A rising ADX line—regardless of whether prices are moving up or down—means the trend is strengthening. When ADX starts to fall, it often signals consolidation or a potential trend reversal.
Interestingly, ADX peaks can act as early warnings. When the indicator reaches a high point and then turns lower, it may foreshadow the end of a strong move. Savvy traders use these signals to lock in profits or prepare for a new market phase. For more in-depth insights, check out ADX: The Trend Strength Indicator.
Common Misinterpretations and Pitfalls
It’s easy to misread the average directional index, especially for beginners. A frequent mistake is treating ADX as a directional indicator, rather than a strength gauge. Another is reacting to short-lived spikes without considering the broader price context.
Relying solely on the ADX—without watching price action or other indicators—can lead to false signals, especially in quiet markets. Remember, ADX is a lagging indicator, so it confirms trends after they’ve started. To avoid these pitfalls, always combine the ADX with a holistic market view and avoid overtrading based on a single reading.
ADX in Different Market Conditions
The average directional index adapts well across various markets. In bull runs, a rising ADX confirms the rally’s staying power. During bear markets, the indicator validates ongoing sell-offs—helping traders stay with the trend.
In sideways or choppy conditions, the ADX typically stays low, signaling caution for trend-followers. For example, in the crypto space, ADX can help filter out noise and prevent whipsaw trades when volatility spikes. By tailoring your approach to the current ADX reading, you can optimize your strategies for any environment.
Practical Applications: Using ADX in Real Trading Strategies
Navigating today’s fast-moving markets demands more than just intuition. Traders need tools that cut through the noise and confirm when a trend is truly worth trading. The average directional index empowers you to do just that. Here’s how to put ADX to work in your real-world strategies.
Identifying High-Probability Trade Setups
The average directional index excels at highlighting when a market is primed for a strong move. Many traders only enter trades when ADX rises above 20 or 25, signaling a trend is gaining momentum.
Pairing ADX with classic price patterns, such as breakouts or pullbacks, can further boost your edge. For example, in a trending forex pair, waiting for ADX to confirm strength before entering on a breakout reduces false starts.
- Look for ADX crossing above 20 as a green light.
- Combine with bullish or bearish chart patterns.
- Confirm with recent volume surges for added conviction.
This disciplined approach helps you focus on quality, not quantity.
Filtering Out False Breakouts and Whipsaws
Sideways markets are notorious for luring traders into costly whipsaws. The average directional index offers a simple filter: if ADX is below 20, trends are weak, and breakouts are more likely to fail.
When volatility spikes, but ADX remains low, it’s often best to stay on the sidelines. Only act when ADX climbs, confirming a real trend is underway.
- Avoid trading breakouts during low ADX periods.
- Use rising ADX as confirmation of genuine momentum.
- Watch for sudden ADX drops as a warning to tighten stops.
This filter can save you from chasing false signals in volatile stocks.
Managing Risk and Position Sizing with ADX
Strong trends can yield outsized returns—but they also come with increased risks. The average directional index helps you adjust your approach. When ADX is high, consider increasing your position size (within your risk limits), as the probability of trend continuation is greater.
Conversely, if ADX starts to fall, it’s a cue to tighten stops or reduce exposure.
- Scale up in strong trends (ADX rising).
- Tighten stop-losses as ADX declines.
- Reduce trade size in choppy or range-bound markets.
Consistent application of these rules can help protect your capital and lock in gains.
Integrating ADX with Other Indicators
While the average directional index is powerful on its own, it really shines when combined with other technical tools. Pairing ADX with moving averages, RSI, or MACD provides deeper confirmation of trend strength and momentum.
For swing trading, you might use a moving average crossover as an entry, but only take trades when ADX confirms the trend. Likewise, use RSI to check for overbought or oversold conditions before acting.
- Use ADX as a trend filter for other signals.
- Combine with momentum or volume indicators.
- Confirm entries with multiple, aligned tools for higher accuracy.
Layering indicators can reduce noise and boost confidence in your trades.
ADX in Algorithmic and Automated Trading
Algorithmic traders increasingly rely on the average directional index to automate trend-following strategies. By coding ADX filters into trading bots, you can ensure your system only acts in strong, sustained trends—reducing costly errors in sideways markets.
Backtesting ADX-based rules is essential to measure reliability and optimize parameters. Many platforms now offer plug-and-play ADX modules for quick integration.
- Program bots to enter trades only when ADX exceeds set thresholds.
- Use ADX to adjust position sizing dynamically.
- Backtest strategies across asset classes and market conditions.
This approach brings discipline and consistency to both manual and automated trading.
Case Studies: ADX in Forex, Crypto, and Stocks
Let’s look at how the average directional index delivers results in real markets. In forex, traders often use ADX to ride major trends, as detailed in ADX in Forex Trading: Unraveling the Trend Strength Mystery. Crypto traders rely on ADX to avoid choppy, range-bound phases, waiting for clear trend confirmation before entering.
In stocks, ADX helps filter high-volatility breakouts, leading to improved win rates and steadier returns.
| Market | Typical ADX Use Case | Win Rate Improvement |
|---|---|---|
| Forex | Trend confirmation, entries | Up to 15% |
| Crypto | Avoiding false breakouts | Up to 12% |
| Stocks | Filtering volatile signals | Up to 10% |
Each market shows how disciplined ADX application can boost consistency while minimizing risk.
Advanced Tips and Common Mistakes When Using ADX
For traders aiming to master the average directional index, understanding its advanced nuances and avoiding common pitfalls is essential. Let’s dive into pro-level strategies and mistakes to watch out for.
Optimizing ADX Settings for Different Markets
The average directional index works best when tailored to your market’s volatility. While the classic ADX period is 14, adjusting this setting can make a big difference. Shorter periods (like 10) make the ADX more responsive but can increase noise. Longer periods (20 or more) smooth the line, reducing false signals but adding lag.
| Market Type | Suggested ADX Period | Notes |
|---|---|---|
| Forex | 10–14 | More volatility |
| Stocks | 14–20 | Smoother trends |
| Crypto | 7–14 | Rapid swings |
Test several periods to see which best captures trend strength for your asset. Remember, the average directional index isn’t one-size-fits-all—customization is key.
Recognizing and Avoiding ADX “Lag”
One of the most common frustrations with the average directional index is its lagging nature. Since ADX confirms trends only after they’re established, you might miss early moves. To reduce lag, combine ADX with leading indicators or price action signals.
For example, if your price chart shows a breakout and ADX begins rising, you have stronger confirmation. Use code like if ADX > 25 and price > moving_average: signal = "trend" to blend signals. Always remember, the average directional index is a confirmation tool—not a prediction device.
ADX Divergence and Trend Exhaustion Signals
Divergence between price and the average directional index can be a powerful early warning. If price makes a new high or low, but ADX fails to do the same, it signals potential trend exhaustion. This often precedes reversals or major corrections.
Spotting ADX divergence requires careful observation of both price action and the ADX line. When you notice this pattern, tighten stops or consider partial profit-taking. The average directional index can’t predict exact turning points, but divergence is a vital clue for savvy traders.
Using ADX in Multi-Timeframe Analysis
Analyzing the average directional index across multiple timeframes helps filter out false signals and align your trades with the broader trend. Check ADX values on both higher (daily, weekly) and lower (hourly, 15-minute) charts before entering a trade.
If the ADX is strong on the daily and rising on the hourly, your setup is more robust. To deepen your understanding, explore multi-timeframe analysis strategies for practical tips on synchronizing ADX readings. This approach reduces the risk of getting caught in minor pullbacks or sideways noise.
Most Common Trading Mistakes with ADX
It’s easy to misuse the average directional index, especially when emotions run high. Common mistakes include overtrading in low ADX environments, ignoring +DI and -DI crossovers, and using ADX thresholds without proper backtesting.
- Trading every ADX rise without context
- Neglecting confirmation from other indicators
- Forgetting to adjust ADX settings for market type
For a broader perspective, review the essential trader indicators overview to see how ADX fits into a complete toolkit. Avoid these pitfalls and let the average directional index guide—never dictate—your trading decisions.
ADX in 2025: New Developments, Trends, and Best Practices
Trading strategies are evolving rapidly, and the average directional index remains a crucial tool for traders navigating 2025’s complex landscape. Whether you’re a discretionary trader or developing automated systems, understanding how the average directional index adapts to today’s environment can make all the difference in your results.
Evolving Role of ADX in Modern Trading
The average directional index has carved a lasting niche in the toolkit of both retail and institutional traders. In 2025, with the proliferation of AI-driven and algorithmic strategies, ADX is now often embedded within complex models.
Many quant funds and machine learning practitioners use the average directional index as a trend filter—screening assets for sustained movement before deploying advanced trading algorithms. For example, an AI-powered trading bot may only execute trades when ADX exceeds a certain threshold, ensuring it operates in trending conditions. This integration underscores the indicator’s versatility and its continued relevance in a data-driven world.
Enhanced Charting Platforms and ADX Visualization
Modern charting platforms in 2025 have made it easier than ever to visualize and interpret the average directional index. Real-time calculations, interactive dashboards, and customizable alerts allow traders to react swiftly to changes in trend strength.
Platforms now offer features like multi-timeframe ADX overlays, dynamic color coding, and even voice alerts when significant ADX levels are breached. These enhancements help traders spot opportunities and manage risk more efficiently, whether they’re on desktop, tablet, or mobile devices. As a result, the average directional index has become even more accessible for both novices and seasoned professionals.
ADX and Market Volatility in 2025
Market volatility has surged in recent years, making the average directional index more valuable for discerning real trends from noise. During periods of rapid market shifts—like those seen in 2024 and 2025—the ADX helps traders identify whether a move is likely to continue or quickly fade.
For example, when volatility spikes, ADX readings tend to react by either confirming a powerful trend or signaling caution if the move lacks true momentum. By monitoring the average directional index, traders can better adapt their strategies to changing volatility regimes and avoid getting whipsawed in erratic conditions.
Best Practices for ADX-Based Trading in 2025
To get the most out of the average directional index, it’s crucial to combine it with modern risk management and continuous backtesting. Many traders now use ADX alongside other technical tools, confirming signals before acting. For example, integrating trading signals explained with ADX readings helps ensure that entries and exits are based on robust evidence rather than guesswork.
Regularly updating your ADX-based strategies using recent market data is also key. By setting dynamic thresholds and customizing alerts, you can respond faster to market shifts and minimize risk. The most successful traders in 2025 prioritize adaptability and data-driven decision-making with the average directional index at the core.
Limitations of ADX and When to Use Alternatives
Despite its strengths, the average directional index isn’t foolproof. It may underperform in low-volatility environments or during sudden market reversals, where lag can cause delayed signals. In these cases, combining ADX with complementary indicators—such as a currency strength meter guide—can enhance your analysis and provide a fuller market picture.
Remember, no single indicator should dictate every trade. The best results come from a balanced approach, blending the average directional index with tools that measure momentum, volume, or market sentiment. This multi-layered strategy reduces the risk of false signals and improves overall trading performance.
Frequently Asked Questions About ADX
Q: What ADX level signals a strong trend in 2025’s markets?
A: Generally, an average directional index reading above 40 indicates a strong trend, but some traders adjust this threshold based on asset volatility.
Q: Should I use ADX alone for trading decisions?
A: It’s best used in conjunction with other indicators and price action analysis to confirm signals.
Q: Has the calculation method changed in 2025?
A: The core formula remains the same, though some platforms offer custom smoothing options.
Q: How do I avoid lag with ADX?
A: Use it with leading indicators and monitor price action for early signs of shifts.
Q: Can ADX be automated?
A: Absolutely—most trading bots and platforms support ADX-based filters and alerts.
The average directional index continues to be a vital part of trading strategies in 2025, offering clarity and confidence in an ever-evolving market landscape.
Now that you know how ADX can help you cut through market noise and spot real trends in 2025, imagine putting that knowledge into action with tools that make everything simpler and faster. With PipTrend, you don’t have to second-guess your signals or spend hours analyzing charts—its AI-powered insights and real-time alerts let you focus on what matters: making smart, confident trades. If you’re ready to trade with less stress and more clarity, it’s the perfect time to See Your Trading Improve With PipTrend.