
Mastering candlestick patterns is the secret weapon of successful traders—are you ready to unlock the power of the hammer candlestick in 2025?
In this ultimate guide, you'll discover why the hammer candlestick is a must-know tool for navigating the fast-changing markets ahead. We’ll break down what this pattern is, how to spot it on your charts, and why top traders rely on it for bullish reversals.
Ready to trade smarter? Dive in to learn step-by-step strategies and expert tips designed to help you leverage the hammer candlestick with confidence in any market condition.
Understanding the Hammer Candlestick Pattern
The hammer candlestick is a cornerstone of price action analysis and a favorite tool among traders seeking to spot reversals. Its unique structure and psychological implications have made it a go-to signal for both beginners and professionals. In this section, we'll break down everything you need to know about the hammer candlestick, from its anatomy and variations to its strengths, weaknesses, and optimal use in 2025.
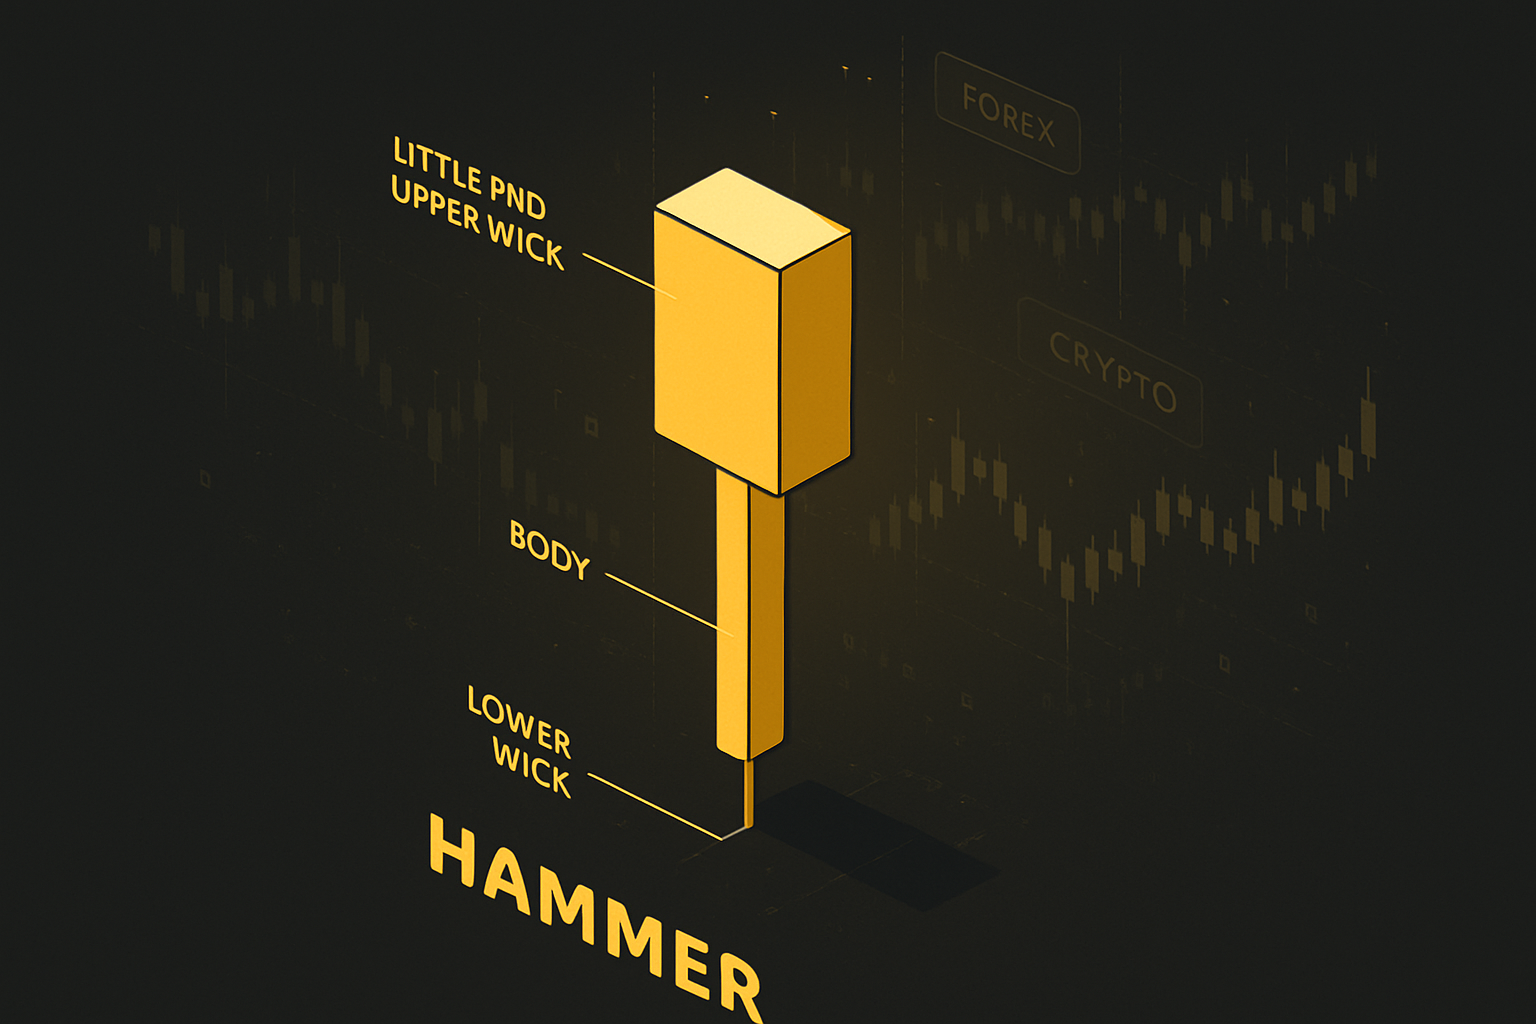
What is a Hammer Candlestick?
A hammer candlestick is a single-bar pattern that signals a potential bullish reversal after a downtrend. It features a small real body at the top of the range, a long lower wick (shadow) that's at least twice the body’s size, and little or no upper wick. Originating from Japanese candlestick analysis, this pattern represents a tug-of-war where sellers push prices lower, but buyers regain control and drive the close near the top.
The hammer candlestick stands out due to its symbolism: it often marks the transition from panic selling to confident buying. Unlike the hanging man, which appears after an uptrend and warns of a reversal, the hammer emerges after declines. For a visual breakdown and more detailed analysis, check out this Hammer Candlestick Pattern Guide.
A textbook example? Picture a daily chart where the price falls sharply, prints a hammer candlestick at support, and then rallies—classic reversal territory. In 2025, recognizing this pattern remains vital for traders adapting to fast-evolving markets.
Anatomy and Psychology Behind the Hammer
The anatomy of a hammer candlestick tells a story: the open, close, high, and low combine to reveal market sentiment. The long lower shadow illustrates heavy selling pressure that’s ultimately absorbed by buyers, who push the close near the session’s high.
This lower wick is crucial—it represents emotional capitulation, where retail traders panic sell, and "smart money" steps in to accumulate. The hammer candlestick often forms during sharp corrections, offering insight into institutional behavior as they seize bargains.
Recent studies have shown that hammer patterns appear frequently in major markets, especially during volatile periods. For example, during the 2022 tech selloff, several hammer candlesticks marked the bottom on high-volume days, foreshadowing strong rebounds. Understanding this psychology helps traders anticipate when a reversal is genuinely in play.
Bullish vs. Bearish Hammers: Variations Explained
Not all hammers are created equal. The classic bullish hammer candlestick appears after a downtrend, signaling a possible reversal. In contrast, the inverted hammer has a similar body but a long upper wick, suggesting buyers are testing the waters.
The hanging man, while visually similar, occurs after an uptrend and warns of a potential bearish reversal—it's not a bullish signal. Here’s a quick comparison:
| Pattern | Trend Context | Wick Direction | Signal Type |
|---|---|---|---|
| Hammer | Downtrend | Lower | Bullish |
| Inverted Hammer | Downtrend | Upper | Bullish (weak) |
| Hanging Man | Uptrend | Lower | Bearish |
Reliability peaks when the hammer candlestick forms after a decisive downtrend, especially on higher timeframes. A common misconception is mistaking hanging men for hammers—always check the trend and wick orientation. For instance, a bullish hammer on a forex chart like USD/JPY can be powerful, while a similar shape post-uptrend could mislead.
Common Markets and Timeframes for Hammer Patterns
You'll spot the hammer candlestick across forex, stocks, crypto, and indices. Its reliability, however, varies by market and timeframe. Daily and 4-hour charts offer some of the highest success rates, while 1-hour or lower timeframes may produce more false signals due to noise.
Intraday traders may use the hammer candlestick for quick reversals, but swing traders often find more robust setups on higher timeframes. In 2025, market volatility—especially in assets like Bitcoin—may increase both the frequency and the opportunity of hammer setups.
For example, a hammer candlestick on the Bitcoin daily chart after a sharp drop often precedes a strong bounce. Keep in mind that rapid market changes in 2025 could affect how often these patterns appear and their overall effectiveness.
Limitations and False Signals
Despite its power, the hammer candlestick isn’t foolproof. Not every hammer leads to a reversal—sideways or choppy markets can generate false positives. That’s why confirmation signals, like a strong bullish candle on the next bar or volume spikes, are essential.
Trading the hammer candlestick in isolation is risky. Consider a failed hammer pattern: after a dramatic wick, the price continues to fall, trapping early buyers. Studies suggest that only about 60% of hammer setups result in profitable reversals, emphasizing the need for risk management.
Key takeaways? Always pair the hammer candlestick with other signals, use stops, and review past trades to learn from losses. This balanced approach helps minimize risks and maximizes the pattern’s potential.
How to Identify a Hammer Candlestick on Your Chart
Spotting a hammer candlestick on your chart is a skill every trader should master. With a trained eye, you’ll quickly recognize this powerful reversal signal and boost your confidence in making timely entry decisions. Let’s break down the process into clear, actionable steps so you can identify hammer candlesticks with precision.
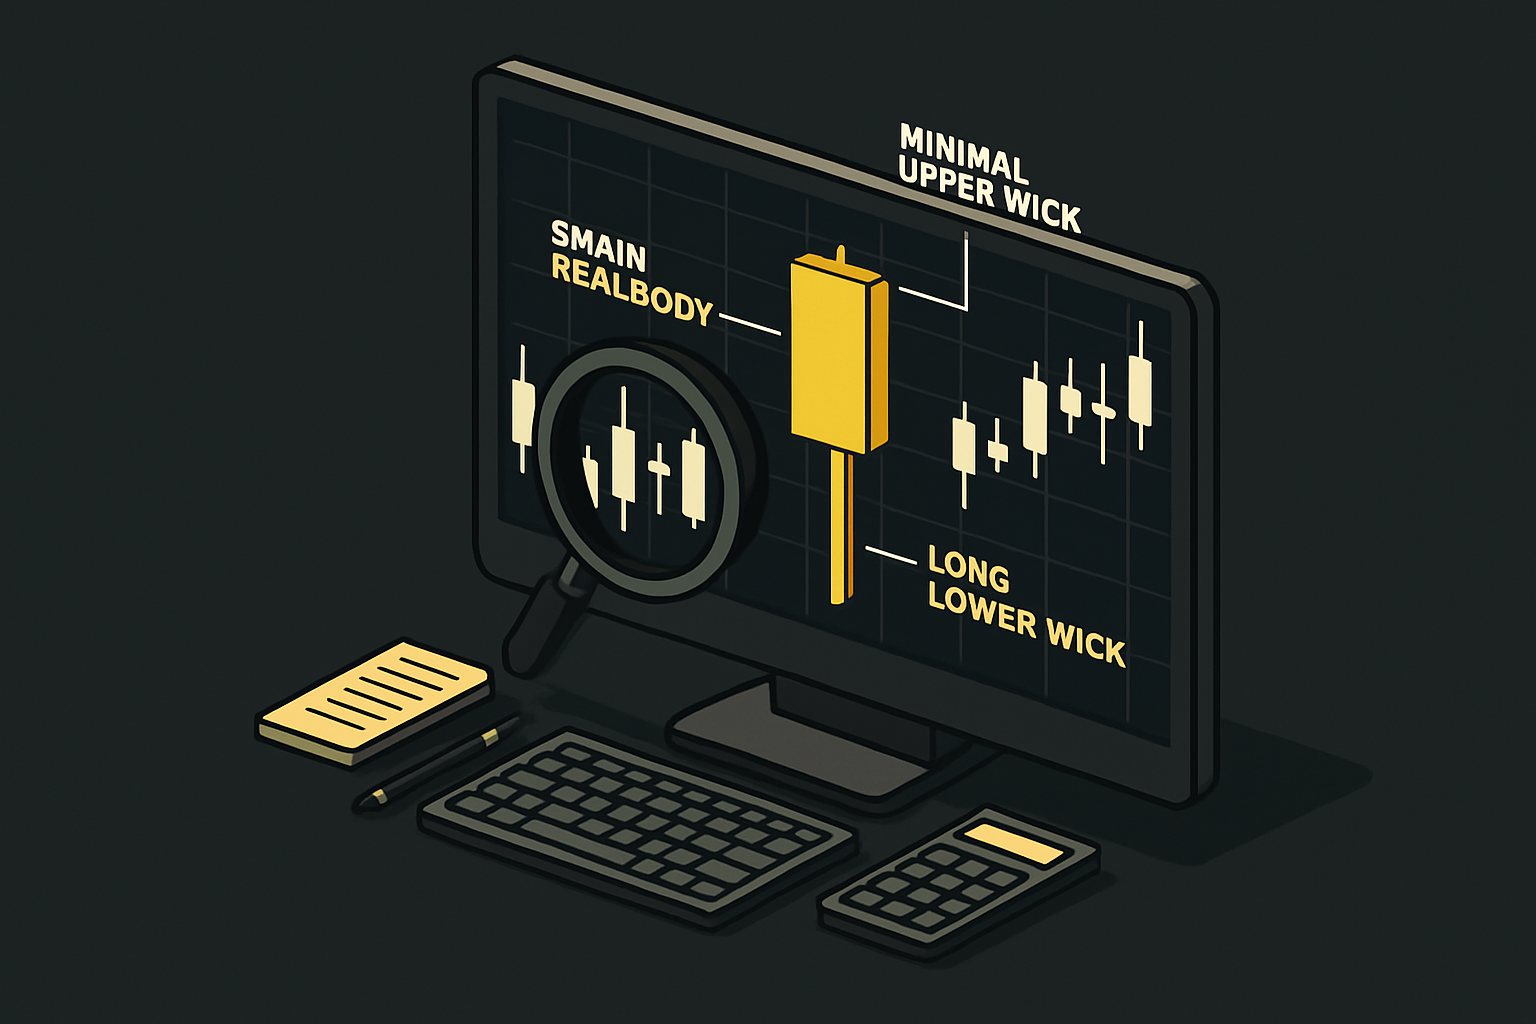
Step-by-Step Visual Identification Process
Begin by scanning your chart after a clear downtrend—this context is essential for the hammer candlestick’s validity. Look for a single candle with a small real body positioned near the top of its range. The lower shadow should be at least twice the size of the body, while the upper wick is very short or nonexistent.
To double-check, compare the hammer candlestick against recent price action. Is it forming at a potential support level or after heavy selling? These details increase reliability. For a detailed beginner-friendly walkthrough with chart examples, check out the Hammer Candlestick for Beginners guide.
Common pitfalls include mistaking similar shapes in sideways markets or ignoring the necessary trend context. Always ensure each step is met before labeling a candle as a true hammer candlestick.
Tools and Indicators to Spot Hammers
Modern trading platforms make identifying the hammer candlestick much easier. Most charting tools, like TradingView or MetaTrader, offer built-in candlestick pattern scanners. These automatically highlight hammer candlesticks on your charts, saving you time.
For more advanced traders, custom indicators or AI-driven pattern recognition tools can provide real-time alerts about hammer candlestick formations across multiple assets. Manual identification is helpful for learning, but automated tools reduce human error.
Beginners should practice visual scanning to train their eye, but don’t hesitate to use technology for support. Multi-timeframe analysis is crucial—spotting a hammer candlestick on both daily and 4H charts can provide added confidence in your setup.
Confirmation Techniques for Higher Accuracy
Never rely solely on a hammer candlestick for your trade decisions. Instead, use confirmation techniques to filter out false signals and improve your win rate. The most common method is waiting for the next candle to close above the hammer candlestick’s high, signaling strong bullish momentum.
Volume is another key factor—a true hammer candlestick is often accompanied by a volume spike, showing significant buying interest. Placing the hammer candlestick near major support or resistance zones further increases reliability.
Combining indicators like RSI or MACD with the hammer candlestick can help validate the reversal. Use a simple checklist: clear downtrend, valid hammer candlestick, confirmation candle, and supporting volume for the highest probability trades.
Common Mistakes and How to Avoid Them
Many traders misidentify hammer candlesticks, especially by confusing them with inverted hammers or hanging man patterns. Always check for the correct context—a hammer candlestick must appear after a downtrend.
Another mistake is ignoring confirmation signals and overtrading ambiguous setups. Trading every hammer candlestick you see, especially in choppy markets, often leads to losses.
Protect yourself by waiting for confirmation and sticking to your trading plan. Keep a record of each hammer candlestick trade to analyze results and refine your strategy. Accurate identification and disciplined execution are the keys to mastering the hammer candlestick in any market.
Step-by-Step Guide: How to Trade the Hammer Candlestick in 2025
Trading the hammer candlestick in 2025 requires a disciplined, step-by-step approach. By following proven strategies, you can boost your confidence and consistency—no matter the asset or market conditions. Let's break down each step to help you trade smarter, not harder.
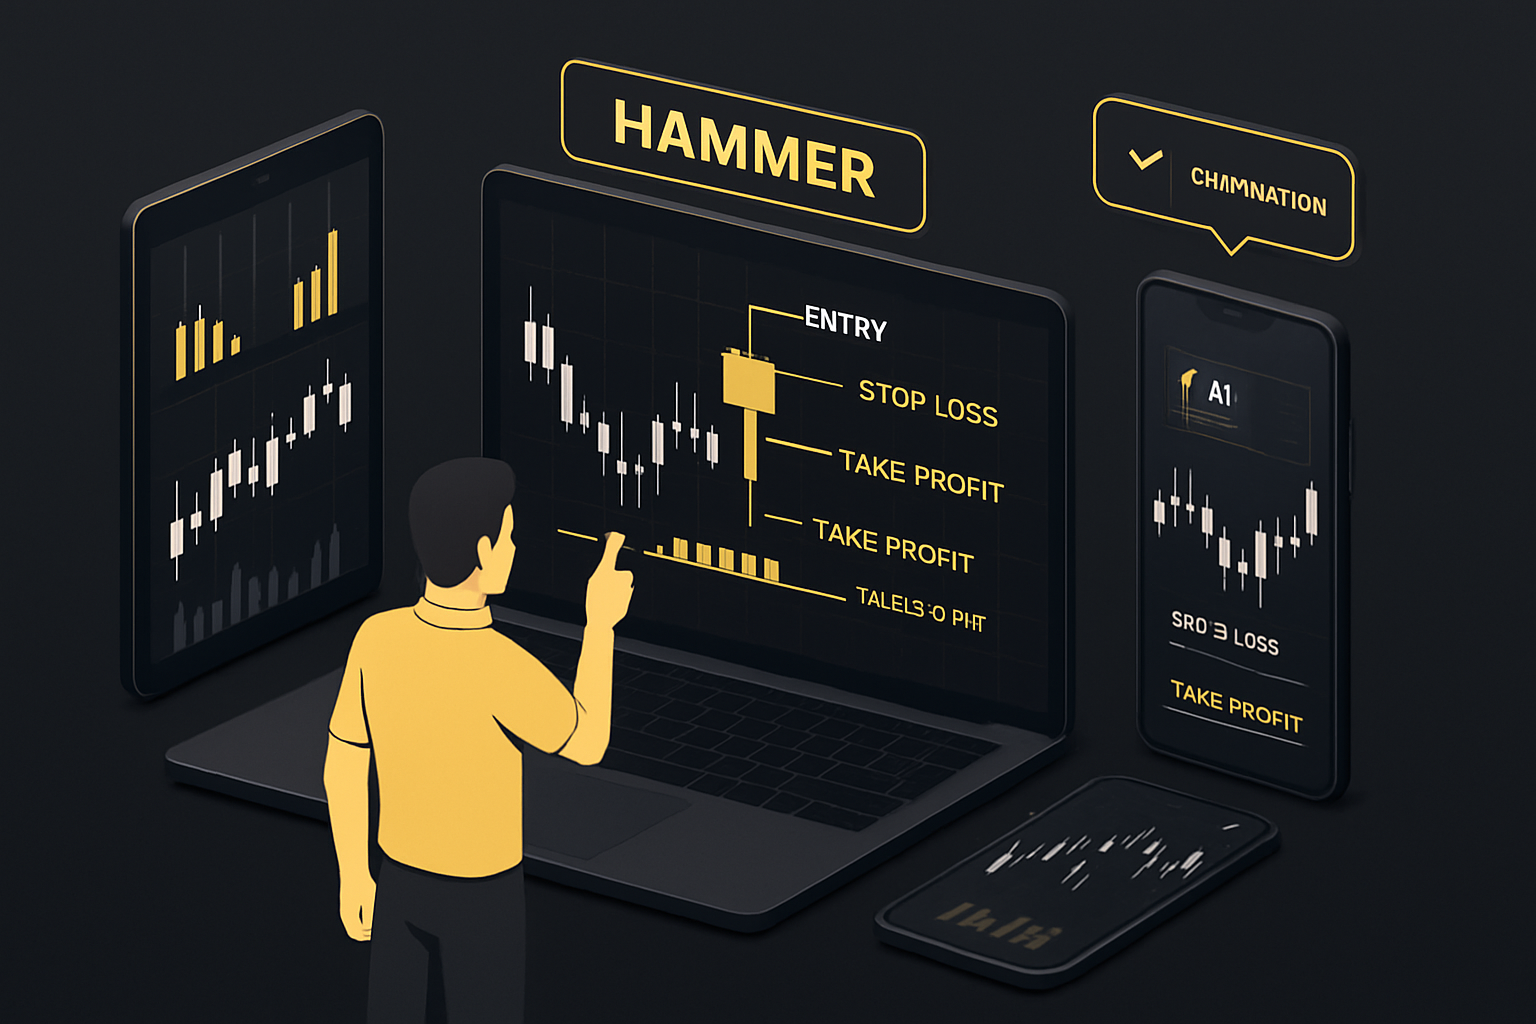
Step 1: Analyze the Trend and Market Context
Before trading a hammer candlestick, always confirm a clear downtrend. Use moving averages—like the 20 or 50 EMA—to validate the trend direction. Mark major support zones, as hammers near these levels are more reliable.
Consider overall market sentiment and watch for relevant news events that could impact price action. For example, a hammer candlestick at the end of a multi-day selloff often signals potential reversal, especially when panic selling exhausts itself.
Avoid trading hammers in sideways or choppy markets. Studies show hammer candlestick setups after strong trends have significantly higher success rates than those in range-bound conditions.
Step 2: Spot the Hammer and Wait for Confirmation
Identifying a valid hammer candlestick is only the start. Wait for a bullish confirmation candle—a strong close above the hammer's high—before entering a trade. Volume spikes on the hammer day add extra weight to the signal.
Patience is key. Entering too early, without confirmation, increases the risk of false signals. For example, a confirmation candle that closes firmly above the hammer's high provides a green light for action.
Success rates for hammer candlestick trades improve dramatically when waiting for confirmation, so make this a non-negotiable part of your process.
Step 3: Plan Entry, Stop Loss, and Take Profit
With a confirmed hammer candlestick, plan your trade with precision. Enter at the close of the confirmation candle or on a break above the hammer's high. Set your stop loss just below the hammer's low to protect against sudden reversals.
For take profit, target recent resistance zones or use a 2:1 risk/reward ratio. Here's a simple table for reference:
| Entry Point | Stop Loss | Take Profit |
|---|---|---|
| Confirmation close | Below hammer's low | Resistance or 2:1 RR |
Disciplined execution is essential for consistent hammer candlestick trading success.
Step 4: Manage the Trade and Adjust as Needed
After entering a hammer candlestick trade, monitor price action closely. If the trade moves in your favor, consider adjusting your stop loss to breakeven to lock in gains. Scale out profits at key resistance levels or use a trailing stop to capture extended moves.
Stay alert for signs of reversal or pattern failure. In volatile sessions, quick decision-making can preserve profits and limit losses. Studies show that effective trade management significantly boosts hammer candlestick win rates over time.
Step 5: Review and Learn from Each Trade
Keep a trading journal dedicated to your hammer candlestick trades. Document entries, exits, screenshots, and your reasoning behind each decision. Analyze both winning and losing trades to spot patterns in your performance.
Use this data to refine your entry and exit criteria. For example, review a series of hammer candlestick trades to identify what worked and what didn't. Continuous self-review is a cornerstone of long-term trading success in 2025.
Advanced Hammer Trading Strategies for 2025
Take your hammer candlestick trading to the next level by combining it with institutional order flow concepts or smart money analysis. Look for multi-timeframe confluence—when hammer patterns align across different charts, the signal is stronger.
Leverage AI-powered tools for real-time pattern recognition and alerts. Algorithmic trading with hammer candlestick filters can help automate your strategy and adapt to evolving market conditions.
To explore more advanced strategies and real-world examples, check out these hammer candlestick trading strategies for practical tips and deeper insights.
Risk Management and Position Sizing
Proper risk management is vital when trading the hammer candlestick. Calculate position size based on your account risk tolerance—never risk more than 1-2% per trade. Use the ATR (Average True Range) indicator to set dynamic stop losses that adapt to market volatility.
Diversify your trades across different assets to avoid overexposure. For example, position sizing on a volatile asset like crypto should be smaller than on a stable blue-chip stock. Smart risk management is key to lasting success with the hammer candlestick in fast-moving 2025 markets.
The Role of AI-Powered Indicators in Hammer Pattern Trading
AI-powered indicators can revolutionize hammer candlestick trading by providing instant, objective buy and sell signals. Tools like PipTrend scan multiple timeframes and markets—forex, crypto, stocks, and indices—for real-time hammer candlestick setups and trend confirmation.
These platforms eliminate analysis paralysis and help traders of all levels stay ahead. Multi-timeframe dashboards ensure that hammer candlestick signals align with broader trends, increasing reliability. Instant alerts and mobile notifications mean you never miss a key opportunity, even in the most volatile 2025 markets.
Hammer Candlestick in Different Markets: Forex, Stocks, Crypto, and Indices
The hammer candlestick is a universal price action tool, but its performance and interpretation can change dramatically across different markets. Understanding where, when, and how to use this pattern is crucial for traders looking to thrive in 2025. Let’s break down how the hammer candlestick performs in forex, stocks, cryptocurrencies, and indices—plus how to adapt your approach as markets evolve.
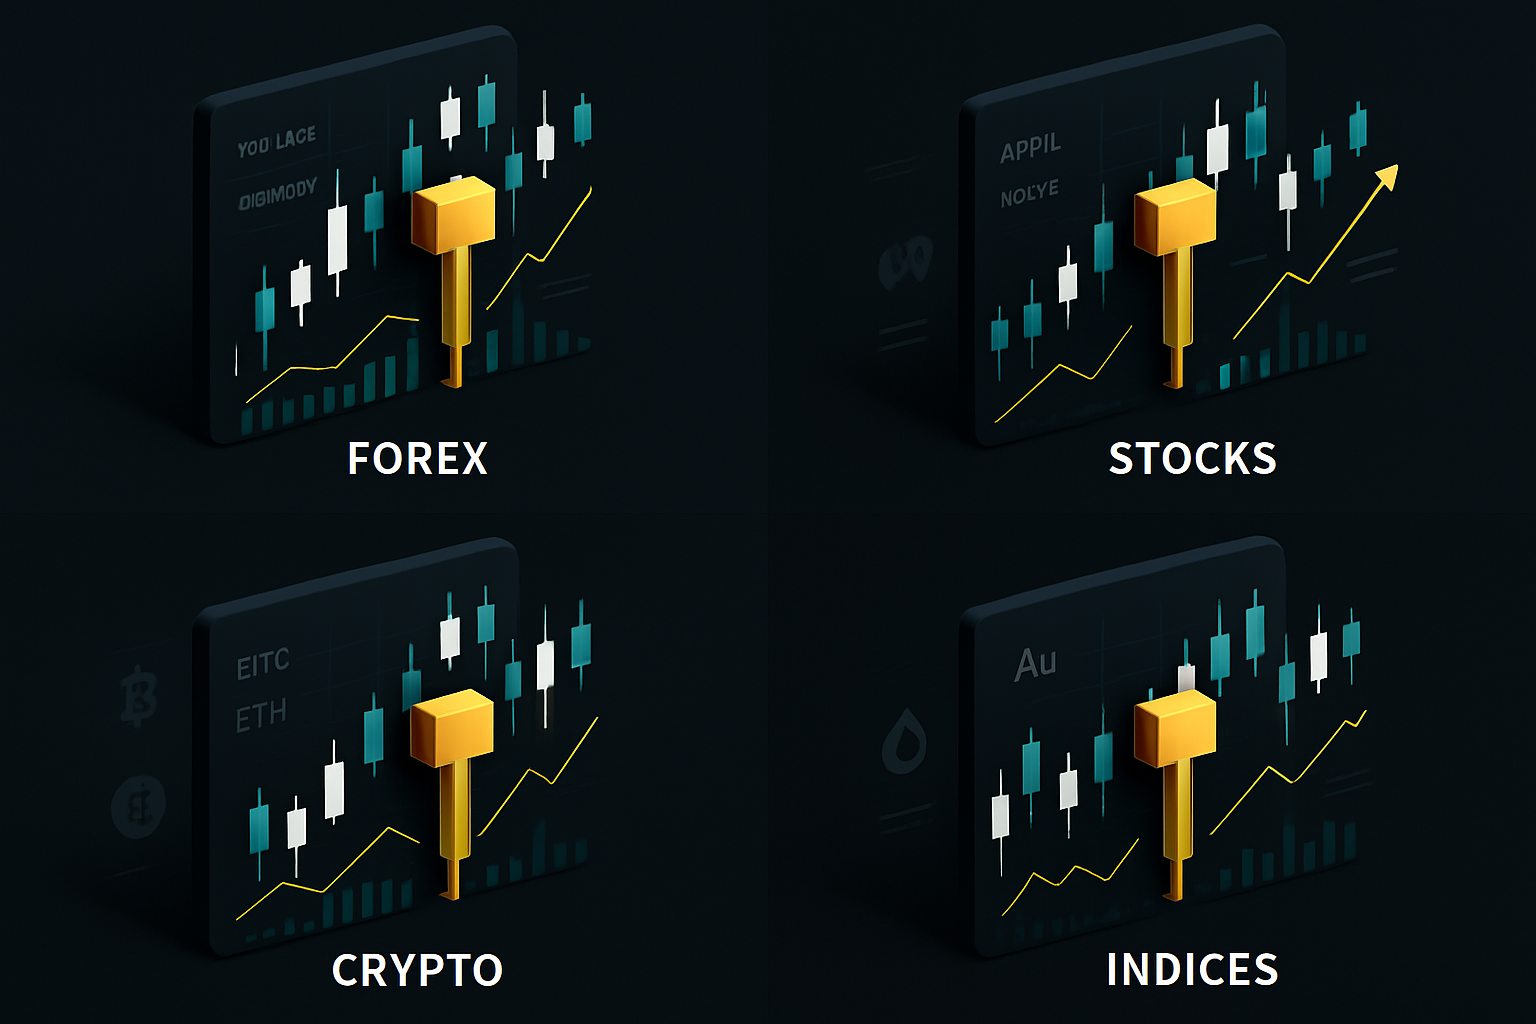
Hammer Patterns in Forex Trading
In forex, the hammer candlestick frequently appears on major currency pairs, especially during periods of high volatility and liquidity. Traders often spot hammers following sharp drops in pairs like EUR/USD or GBP/USD, signaling a potential reversal. The pattern’s reliability increases on higher timeframes, such as the daily or 4H charts, where noise is reduced.
Central bank announcements and economic news can dramatically affect hammer candlestick outcomes. It’s important to wait for confirmation before entering trades, as false signals can occur in choppy, news-driven markets. For a data-driven perspective, check out these hammer candlestick pattern success rates based on decades of backtesting. This helps you gauge how often the pattern works in forex, making your strategy more robust.
Hammer Patterns in Stock Trading
The hammer candlestick is a favorite among stock traders, particularly as a bullish reversal after earnings sell-offs or market panics. On daily charts of popular stocks like Apple or Tesla, a well-formed hammer at a key support level can signal a strong buying opportunity. Volume confirmation is especially important in equities—look for surges in buying activity alongside the pattern.
Swing traders often rely on daily or weekly hammers, while intraday traders may seek them on the 1H chart. Keep in mind that broader market sentiment, such as S&P 500 trends, can influence the effectiveness of the hammer candlestick. Failed hammers often occur when the overall trend remains bearish, so always pair pattern analysis with market context.
Hammer Patterns in Cryptocurrency Markets
In the wild world of crypto, the hammer candlestick is a frequent visitor, thanks to extreme volatility and emotional trading. Bitcoin and Ethereum often print textbook hammers on the 4H or daily charts during major sell-offs. However, due to crypto’s 24/7 nature and rapid news cycles, confirmation is even more critical—unconfirmed hammers can quickly lead to losses.
Unique risks in crypto include sudden liquidity shifts and flash crashes, which can distort candlestick patterns. Still, a confirmed hammer candlestick at a strong support level can precede dramatic price rallies. For those interested in empirical results, you can explore hammer candlestick pattern backtesting results to see how this pattern has performed historically in various markets.
Hammer Patterns in Indices and Commodities
Indices like the S&P 500 or NASDAQ, and commodities such as gold or oil, often showcase hammer candlestick formations at major support zones during market corrections. These setups are especially powerful when they coincide with macroeconomic news or global events, as institutional traders may step in to buy heavily after panic selling.
Pattern reliability tends to be higher on longer timeframes, with daily and weekly hammers providing the best reversal signals. Unlike individual stocks or forex pairs, indices and commodities are influenced by a broader range of factors, including economic reports and geopolitical shifts. Always consider the larger macro picture before acting on a hammer candlestick in these markets.
Adapting Hammer Strategies to Market Conditions in 2025
The trading landscape is evolving rapidly, with algorithmic strategies and increased volatility shaping how patterns like the hammer candlestick behave. Traders in 2025 must be nimble—using advanced tools and faster pattern recognition to keep up with changing dynamics. For example, during high-impact economic events, hammers may appear more frequently but require stricter confirmation.
Multi-timeframe analysis is key to filtering out noise and improving pattern reliability. If you want to master this approach, explore these Multi-Timeframe Analysis Tips for practical guidance. Flexibility, continuous learning, and awareness of new market trends will help you make the most of the hammer candlestick across all asset classes.
Pro Tips, Case Studies, and Common Pitfalls to Avoid
Unlocking the true potential of the hammer candlestick requires more than just knowing what it looks like. To consistently trade smarter in 2025, you need practical insights, real examples, and awareness of the most common pitfalls. Let’s dive into actionable pro tips, illustrative case studies, and the key lessons that separate successful traders from the rest.
Pro Tips for Maximizing Hammer Pattern Success
Trading the hammer candlestick effectively is all about stacking the odds in your favor. Here are some essential tips:
- Always wait for confirmation: Never enter solely on the appearance of a hammer candlestick. A strong bullish candle closing above the hammer’s high is vital.
- Combine with support and volume: Hammers at major support with rising volume are far more reliable.
- Quality over quantity: Focus on the best setups rather than chasing every hammer candlestick you see.
- Use multi-timeframe analysis: Confirm the pattern on higher timeframes for added conviction.
- Stay disciplined: Emotional trades often lead to losses. Stick to your rules.
Implementing these tips dramatically increases your chances of capitalizing on the hammer candlestick, especially in volatile markets.
Real-World Case Studies: Hammer Trades in Action
Let’s bring the hammer candlestick to life with real trade examples:
- EUR/USD Reversal: After a weeklong downtrend, a textbook hammer candlestick formed at a major support zone. Volume surged, and a bullish confirmation candle triggered a long entry. The trade hit a 2:1 risk/reward target within two days.
- Tesla Trap: A hammer candlestick formed on the daily chart, but there was no confirmation and broader market sentiment remained bearish. Jumping in early resulted in a quick stop-out.
- Bitcoin Bounce: On the 4H chart, a hammer candlestick appeared after a sharp selloff. Confirmation came with a strong green candle, and the trade captured a significant rally.
These cases highlight the importance of context, confirmation, and disciplined execution when trading the hammer candlestick.
Avoiding Common Pitfalls and Mistakes
Even seasoned traders can stumble with the hammer candlestick if they fall into classic traps:
- Over-reliance on a single pattern: The hammer candlestick is powerful, but not infallible. Always consider the bigger picture.
- Ignoring news and sentiment: Sudden events can invalidate even the best-looking hammer candlestick setups.
- Trading every hammer: Not all patterns are created equal—filter for quality.
- Lack of confirmation: Skipping this step often leads to higher loss rates.
- Neglecting risk management: Always set a stop loss below the hammer’s low.
Avoiding these pitfalls helps you use the hammer candlestick as a precision tool, not a blunt instrument.
Integrating Hammer Patterns with Other Strategies
To maximize the power of the hammer candlestick, integrate it into a broader trading system:
- Combine with moving averages: Look for hammers coinciding with dynamic support.
- Use RSI or MACD: Confirm momentum shifts before entering.
- Chart pattern synergy: Pair the hammer candlestick with classic patterns for higher probability trades. For more insights, check out the comprehensive Chart Patterns in Trading guide.
- Backtest your strategy: Validate your approach across different assets and timeframes.
Smart integration transforms the hammer candlestick from a single signal into a key part of a robust trading plan.
Resources for Further Learning and Practice
Mastering the hammer candlestick is a journey—here’s how to keep improving:
- Books: Explore classics on candlestick analysis and price action.
- Online courses: Structured video content accelerates learning.
- Trading simulators: Practice hammer candlestick setups risk-free.
- Webinars and forums: Learn from seasoned traders and discuss strategies.
- Charting platforms: Use built-in screeners for automated pattern detection.
- Backtesting data: Analyze historical hammer candlestick performance.
- For a deep dive, including backtesting stats, visit this Hammer candlestick pattern guide.
Staying curious and continually refining your hammer candlestick approach is the key to trading success in 2025.
Now that you’ve got a clear game plan for identifying and trading hammer candlesticks in 2025, why not make your life even easier? You don’t have to do it all on your own—advanced tools like PipTrend can help you spot hammer setups in real time, across any market, with instant, objective alerts. Imagine catching those key reversals confidently, knowing you have AI-powered support backing every decision. If you’re ready to simplify your trading routine and focus on results, it’s time to Start Catching Winning Trades, Right Now!