
In the fast-paced world of 2025, technical indicators are more important than ever for traders and investors navigating increasingly volatile, data-driven markets. Among these tools, the rsi index stands out as one of the most popular and effective momentum oscillators—used by professionals and beginners alike across forex, crypto, stocks, and indices.
Mastering the rsi index can help you identify overbought and oversold conditions, time your entries and exits, and spot trend reversals before they happen. This means smarter decisions and greater confidence in your trades.
In this guide, you'll discover everything you need to know about the rsi index in 2025. We'll break down its fundamentals, calculation methods, interpretation techniques, advanced strategies, integration tips, and the most common mistakes to avoid. Let’s get started on your journey to mastering the rsi index.
What is the RSI Index? Foundations & Evolution
The rsi index is a cornerstone of technical analysis, trusted by traders worldwide for its ability to distill complex price action into actionable insights. Understanding its roots, functionality, and ongoing evolution helps traders harness its full potential in today’s fast-paced markets.

Origins and Development of RSI
The rsi index was introduced in 1978 by J. Welles Wilder, a mechanical engineer turned market analyst. Wilder’s main goal was to develop a tool that could measure the speed and magnitude of price changes, giving traders a clearer sense of when an asset was potentially overbought or oversold.
Initially, the rsi index gained traction among stock traders for its straightforward approach. Its popularity quickly spread to other markets—forex, commodities, and eventually, cryptocurrencies and global indices—as traders recognized its adaptability. The indicator’s design allowed it to be applied across various timeframes and asset types, making it a versatile choice.
Over time, the rsi index has been updated and refined to meet the demands of modern trading. With the rise of algorithmic and AI-driven strategies in 2025, RSI’s original principles remain intact, but its application has expanded. Now, automated systems and trading bots use RSI as a core signal, integrating it with advanced analytics to spot opportunities in volatile, data-driven markets.
Core Concept: How the RSI Works
At its heart, the rsi index is a momentum oscillator that moves between 0 and 100, providing a visual gauge of market sentiment. The standard calculation uses a 14-period look-back window, though this can be customized to suit different trading styles.
The term “relative strength” might sound complex, but it simply compares the average gains to average losses over the set period. This ratio is then converted into an index value, making it easy for traders to quickly assess momentum. When the rsi index climbs above 70, it suggests the market may be overbought; below 30, it could be oversold.
What sets the rsi index apart is its simplicity and clarity. The indicator distills intricate price movement into a single, easy-to-read line on the chart. This makes it accessible for both beginners and seasoned professionals, allowing them to spot potential reversals or trend continuations with confidence.
Why RSI Remains Relevant in 2025
Despite the rapid evolution of trading technology, the rsi index maintains a prominent role across retail and institutional platforms. Recent statistics show that a significant percentage of active traders incorporate RSI into their daily analysis, regardless of asset class.
The rsi index’s adaptability is a key reason for its ongoing relevance. It seamlessly transitions from stocks to forex and crypto, adjusting to the unique volatility of each market. Many leading trading platforms and AI-powered tools have RSI built-in, ensuring it remains at the forefront of technical analysis.
Even as machine learning and big data models become more common, the rsi index stands out for its reliability and accessibility. If you’re interested in exploring how RSI compares with other essential technical indicators, check out the Essential trading indicators guide for a broader perspective on building a robust trading toolkit.
Calculating RSI: Step-by-Step Guide
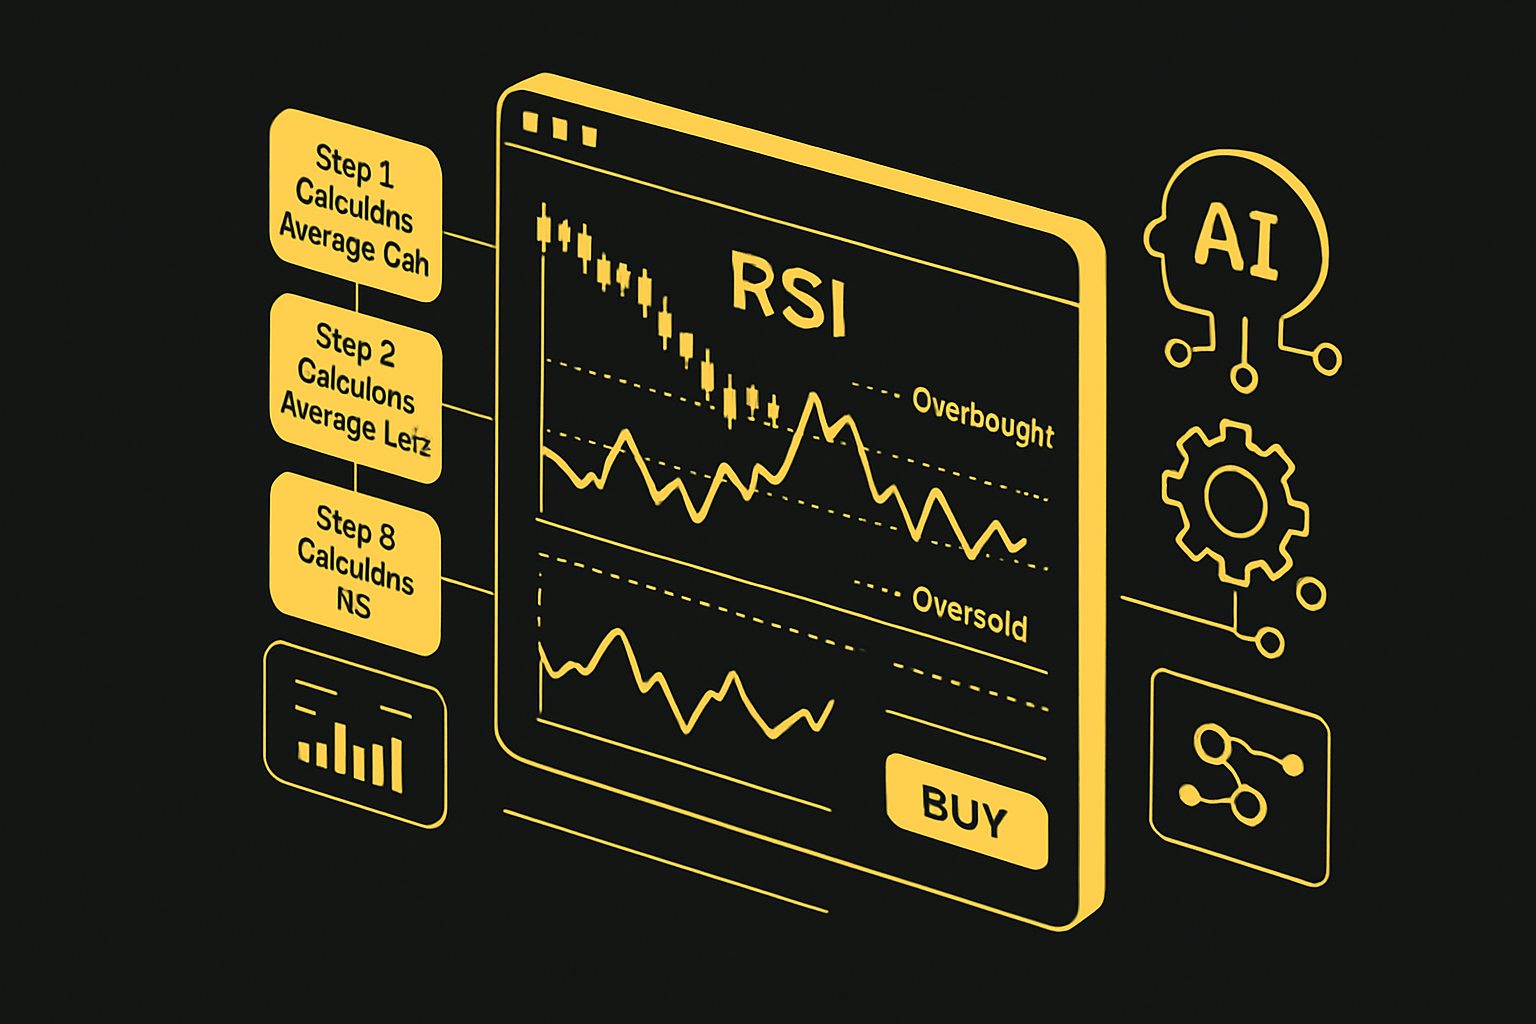
Calculating the rsi index is essential for traders who want to understand the logic behind this powerful indicator. While most platforms automate the math, a manual grasp of the calculation provides deeper insights and helps with troubleshooting. Let’s break down how the rsi index is computed and why this knowledge remains relevant in 2025.
Understanding the RSI Formula
At its core, the rsi index measures the momentum of price movements using a straightforward formula. Here’s the standard calculation:
RSI = 100 - [100 / (1 + RS)]
where RS = Average Gain over N periods / Average Loss over N periods
To start, select a look-back period—usually 14 days. Calculate the average gain and average loss for those days. For example, if a stock had gains of $2, $1, and $3 over 14 days (and losses of $1 and $2), sum the gains and divide by 14, then do the same for the losses.
Adjusting the look-back period impacts the rsi index’s sensitivity. A shorter period (e.g., 7 days) makes it more responsive, while a longer one (e.g., 21 days) smooths out signals:
| Look-back Period | Sensitivity | Use Case |
|---|---|---|
| 7 | High | Fast-moving/volatile markets |
| 14 | Standard | Most trading scenarios |
| 21 | Low | Long-term trend analysis |
Understanding these calculations is crucial for advanced customization. For a deeper step-by-step walkthrough, refer to this RSI Calculation Guide 2025.
Modern Tools for RSI Calculation
Today, most traders don’t calculate the rsi index by hand. Leading platforms such as TradingView, MetaTrader, and Thinkorswim provide automatic RSI computation with just a few clicks. These tools let you adjust the look-back period, thresholds, and even visualize RSI on multiple timeframes.
AI-powered trading bots and algorithmic systems now incorporate the rsi index into their decision-making processes. This integration allows for real-time analysis and faster trade execution. However, understanding the calculation is still vital—especially if you need to troubleshoot discrepancies or develop custom strategies.
Both beginners and advanced traders benefit from this accessibility. You can easily experiment with different settings and instantly see how changes affect the RSI output, enhancing your learning curve and adaptability.
Interpreting RSI Values: Overbought, Oversold, and Beyond
The rsi index produces values between 0 and 100, with traditional thresholds set at 70 (overbought) and 30 (oversold). When the RSI crosses above 70, it suggests the asset may be overbought and due for a pullback. Values below 30 indicate oversold conditions and potential for a rebound.
For more volatile assets, traders often customize these levels—using 80/20, for instance—to avoid premature signals. These thresholds are rooted in behavioral finance, reflecting typical patterns of investor overreaction and correction.
Let’s consider a real-world scenario: Bitcoin’s RSI dropped below 30 during a major dip in 2023, signaling a buying opportunity before a sharp recovery. Conversely, when the rsi index surged past 70 in a fast-moving stock, savvy traders anticipated a correction.
Understanding how to interpret these values—and adjust them for different markets—empowers you to make more informed trading decisions and avoid common pitfalls.
Using RSI for Trading: Core Strategies in 2025
In 2025, traders face increasingly complex and fast-moving markets. The rsi index remains a trusted and adaptable tool, helping users navigate volatility and make informed decisions. Let’s explore practical strategies for using the rsi index, from classic signals to advanced integrations.
Identifying Overbought and Oversold Conditions
One of the most popular uses of the rsi index is spotting overbought and oversold zones. Traditionally, when the rsi index climbs above 70, the asset is considered overbought, signaling a potential pullback. Conversely, an rsi index below 30 indicates an oversold condition, often hinting at a possible rebound.
For example, if a stock’s rsi index falls below 30 and then turns upward, many traders see this as a buy signal. In crypto markets, an rsi index above 70 during a bullish surge may prompt profit-taking or a short position. Major brokers like Schwab and Fidelity recommend waiting for the rsi index to cross back above 30 or below 70 before acting, reducing the risk of false entries.
The “failure swing” is another tactic—when the rsi index fails to make a new high during an uptrend, it can warn of a reversal. According to recent studies, about 60% of rsi index signals in trending markets lead to profitable trades, especially when combined with other indicators.
Spotting Divergences for Early Trend Reversals
Divergence detection is a powerful, often overlooked, feature of the rsi index. Bullish divergence occurs when price makes lower lows, but the rsi index forms higher lows. This suggests weakening downward momentum and a possible bullish reversal. Bearish divergence is the opposite: price makes higher highs, but the rsi index creates lower highs, warning of a potential drop.
To use this technique:
- Watch for price and rsi index moving in opposite directions.
- Confirm with chart patterns or volume before acting.
- Use divergence as an early warning, not a standalone trigger.
Backtests show that spotting divergence with the rsi index can improve entry timing, especially in markets prone to sharp reversals. However, patience is key—wait for price confirmation before committing capital.
Integrating RSI with Trend Analysis
The rsi index works best when paired with broader trend analysis. In strong uptrends, the rsi index often stays above 50 for extended periods, while in downtrends, readings below 50 are common. This context helps filter out false signals that might occur during choppy, sideways markets.
Many traders combine the rsi index with moving averages or trendlines. For instance, only acting on rsi index oversold signals if the price is above a rising 50-day average. This double-confirmation approach boosts accuracy and reduces whipsaws.
A practical checklist:
- Is the broader trend up or down?
- Is the rsi index confirming or contradicting the trend?
- Are there supporting signals from other indicators?
Using the rsi index in tandem with trend tools helps traders stay on the right side of momentum and avoid costly mistakes.
Adapting RSI Strategies for Different Markets
The rsi index isn’t one-size-fits-all. In highly volatile assets like cryptocurrencies, traditional 70/30 thresholds may trigger too many signals. Traders often adjust to 80/20 or use shorter look-back periods for increased responsiveness. During the 2021–2024 Bitcoin bull runs, rsi index readings above 80 were common before major corrections.
A recent Effectiveness of RSI in Cryptocurrency Markets study found that, when tailored for volatility, the rsi index remained a reliable timing tool in crypto, outperforming some alternative indicators. In forex, the rsi index is often used with 14 or 21 periods, while equity traders may prefer classic 14-day settings.
Quick reference table:
| Market | Typical RSI Settings | Thresholds |
|---|---|---|
| Crypto | 7–14 periods | 80/20 or 75/25 |
| Forex | 14–21 periods | 70/30 |
| Stocks/Indices | 14 periods | 70/30 |
Adapting the rsi index to your preferred asset class and volatility regime is essential for reliable signals.
Limitations and Risks of RSI Signals
Despite its strengths, the rsi index isn’t infallible. In powerful trends, the rsi index can remain overbought or oversold for extended periods, leading to premature trades. False signals are especially common during news-driven moves or in illiquid markets.
Experts warn against relying solely on the rsi index. It’s best used as part of a broader toolkit—combine with support/resistance, price action, and risk controls. Never skip stop-losses or position sizing, and always consider the bigger market picture.
In summary, while the rsi index offers actionable insights, its effectiveness depends on context, confirmation, and disciplined execution. Integrating these strategies helps traders harness the full potential of the rsi index in 2025.
Advanced RSI Techniques & Modern Enhancements
As the markets grow more complex, traders are constantly searching for ways to extract more value from the rsi index. Advanced techniques and modern enhancements now allow you to tailor RSI analysis for any asset class, trading style, or market condition. Let’s break down how you can take your RSI skills to the next level in 2025.
RSI Variations and Customizations
The classic rsi index uses a 14-period setting, but advanced traders often experiment with different look-back periods. For instance, a 9-period RSI reacts faster to price shifts, making it popular for day trading, while a 21-period RSI smooths out noise for longer-term strategies. Dynamic thresholds are another upgrade—rather than sticking to the standard 70/30 levels, traders may use 80/20 in highly volatile markets or adjust bands based on recent volatility.
RSI bands, similar to Bollinger Bands, can help visualize overbought and oversold zones dynamically. You can also implement multi-timeframe RSI analysis, which involves checking RSI signals across multiple chart intervals to confirm trends and filter out false positives. For a deep dive into this approach, see Multi-timeframe analysis strategies.
When customizing the rsi index, remember that no single setting fits all markets. Always backtest your adjustments to ensure they improve accuracy and reduce noise.
RSI in Algorithmic and AI-Powered Trading
With the rise of algorithmic and AI-driven trading, the rsi index has become a core component in many automated strategies. Modern trading bots leverage RSI signals for real-time decision-making, often combining them with other indicators or machine learning models to recognize complex patterns.
AI models can optimize RSI parameters automatically, adapting to changing market conditions with minimal human intervention. For example, a bot might increase RSI sensitivity during high-volatility periods or blend RSI with other momentum measures to reduce whipsaws. Here’s a basic pseudocode snippet for integrating RSI into an AI trading bot:
If rsi_index < 30 and AI confirms uptrend:
 Place Buy Order
If rsi_index > 70 and AI confirms downtrend:
 Place Sell Order
Backtesting shows that, when the rsi index is paired with AI, the frequency of false signals drops while profitable opportunities increase. However, human oversight remains crucial for monitoring and refining these systems.
Combining RSI with Other Indicators
No technical tool works in isolation—especially the rsi index. Combining RSI with other indicators is a proven way to boost reliability and reduce risk. For example, pairing RSI with the MACD or Stochastic Oscillator can confirm momentum shifts. Adding Bollinger Bands highlights volatility, while volume analysis helps detect genuine breakouts.
Professional traders often build indicator stacks to create high-probability setups. Here’s a typical combination:
- RSI below 30 (potential reversal)
- MACD bullish crossover
- Price bounces off major support
- Volume surges above average
When multiple signals align, the likelihood of a successful trade increases significantly. The key is to avoid overcrowding your chart; focus on two or three complementary indicators alongside the rsi index for clarity and actionable insights.
RSI for Swing, Day, and Position Trading
The rsi index adapts seamlessly to any trading style. Swing traders look for RSI divergences to spot early reversals on daily or 4-hour charts. Day traders prefer shorter RSI periods and capitalize on rapid overbought/oversold moves within intraday windows. Position traders, focusing on trends lasting weeks or months, benefit from longer RSI settings and traditional 70/30 thresholds.
Here’s a quick comparison:
| Trading Style | RSI Setting | Timeframe | Typical Use |
|---|---|---|---|
| Day Trading | 7–9 | 5m–1h | Fast entries/exits |
| Swing Trading | 14 | 4h–1d | Reversals & divergences |
| Position Trading | 21+ | 1d–1w | Confirm trend exhaustion |
Regardless of approach, always validate rsi index signals with price action and context. Real-world case studies consistently show that those who adapt RSI settings to their strategy achieve better, more consistent results.
Integrating RSI into a Complete Trading System
Building a robust trading system around the rsi index can transform scattered signals into a repeatable, objective approach. Let’s break down how to do this step by step, ensuring your technical analysis translates into real-world results in 2025.
Building a Trading Plan with RSI
A well-structured trading plan centered on the rsi index starts with clear entry and exit criteria. For example, you might enter a trade when RSI drops below 30 and then crosses back above, signaling a potential reversal. Exits could be set at an RSI reading above 70 or when price hits a predetermined target.
Backing up your plan with strict risk management is vital. Always define your stop-loss and position size before entering any trade. Backtest your rsi index strategy on historical data to ensure it performs consistently, and don’t hesitate to tweak parameters based on asset volatility.
Consider this sample table:
| Component | Rule Example |
|---|---|
| Entry | RSI crosses above 30 |
| Exit | RSI reaches 70 or +5% gain |
| Stop-Loss | 2% below entry price |
Combining rsi index signals with support/resistance can further improve your win rate.
RSI in Portfolio Management and Asset Allocation
The rsi index isn’t just for single trades—it’s a powerful tool for portfolio rotation and asset allocation. By monitoring RSI readings across different sectors or asset classes, you can shift capital from overbought markets to oversold opportunities.
For instance, if tech stocks show rsi index values above 70 while energy stocks dip below 30, you might reduce tech exposure and add to energy positions. This approach helps you avoid chasing overheated markets and instead focus on assets with favorable risk-reward.
Integrating the rsi index into your rebalancing process can also improve timing for portfolio adjustments. Just remember, use RSI as one input among several, not the sole decision-maker.
Psychological Aspects of RSI Trading
While the rsi index provides objective signals, human psychology often interferes. Common biases like confirmation bias or FOMO (fear of missing out) can lead traders to misinterpret RSI readings or jump into trades prematurely.
Discipline is key. Stick to your rsi index rules and avoid overtrading—don’t treat every overbought or oversold reading as a must-act signal. Take breaks to review your trades and learn from mistakes.
Tips for mastering rsi index psychology:
- Follow your written plan, not your emotions.
- Use checklists to confirm signals before entering.
- Regularly review trade outcomes for continuous improvement.
Automation and Alerts for RSI-Based Strategies
Modern platforms make it easy to automate rsi index strategies. You can set up alerts for RSI crossovers, divergences, or custom thresholds, ensuring you never miss a trading opportunity—even if you’re away from your screen.
Trading bots or custom scripts can execute trades automatically based on rsi index signals, reducing emotional bias and improving consistency. To understand how these alerts and signals work in practice, see Trading signals and alerts explained for a breakdown of their setup and benefits.
Automation doesn’t replace the need for understanding—always monitor performance and adjust your system as markets evolve.
Case Studies: Real-World RSI Trading Successes and Pitfalls
Let’s look at real-world examples. A trader using the rsi index caught a major reversal in the S&P 500 when RSI dropped near 25 and quickly rebounded, leading to a strong rally. Conversely, another trader ignored bearish divergence and suffered losses as the market reversed unexpectedly.
These cases highlight the importance of confirmation and risk controls alongside rsi index signals. For a deeper dive into advanced strategies and further case studies, check out Mastering RSI: Comprehensive Guide 2025-2030.
By integrating the rsi index into your complete trading system—and learning from both successes and failures—you can navigate 2025’s markets with greater confidence.
Common Mistakes and Best Practices When Using RSI
Traders in 2025 face more data and volatility than ever, but classic pitfalls still undermine even the best strategies. Understanding the most common mistakes—and how to avoid them—can transform how you approach the rsi index for consistent trading success.
Misinterpreting RSI Signals
One of the most frequent errors is treating the rsi index as a standalone buy or sell trigger. Many traders see the rsi index cross 70 or 30 and immediately act, ignoring other signals. This over-reliance often leads to buying too early in a downtrend or selling too soon in a rally.
It's important to remember that traditional thresholds (70 for overbought, 30 for oversold) are not absolute. Markets can remain overbought or oversold for extended periods, especially during strong trends. For deeper insights into how to interpret trend signals, see Identifying Trends with RSI.
Ignoring Market Context and Confirmation
Another major pitfall is ignoring the broader market context. The rsi index should always be analyzed alongside price action, volume, and trend indicators. Acting on the rsi index alone—without confirmation—can lead to false signals and unnecessary losses.
For example, if the rsi index signals oversold but price keeps making new lows, waiting for a trendline break or volume spike can help filter out premature trades. Combining multiple sources of confirmation increases accuracy and confidence.
Poor Risk Management with RSI Trades
Even the best rsi index signal can fail without strong risk management. Trading without stop-losses or proper position sizing exposes you to significant losses. It's crucial to set clear risk controls for every rsi index-based trade.
Best practices include:
- Using stop-loss orders below recent lows/highs
- Calculating position size based on account risk tolerance
- Avoiding overleveraging, especially in volatile markets
By integrating these controls, you protect your capital and give your strategy room to perform.
Over-Optimization and Curve Fitting
Chasing the "perfect" rsi index setting often leads to over-optimization. Many traders tweak the indicator’s parameters until backtests look flawless—only to see poor results in real markets. This process, known as curve fitting, makes strategies less robust and more likely to fail.
Instead, stick to widely tested settings and validate your approach over different timeframes and assets. Consistency and simplicity usually outperform overly complex models in live trading.
Best Practices for RSI Success in 2025
To maximize the rsi index, adopt these habits:
- Use multi-timeframe analysis for confirmation
- Combine the rsi index with support, resistance, and trend tools
- Regularly review and adapt your strategy as markets evolve
Major brokers and professional traders stress the importance of ongoing education and adaptability. Stay updated with the latest research and technology, such as AI-driven tools, to refine your approach and maintain an edge.
Now that you know how powerful the RSI can be for timing your trades in 2025, why not take the next step and put this knowledge into action? With AI-powered tools like PipTrend, you don’t have to second-guess your decisions or worry about missing critical signals—everything you need for clear, real-time alerts is right at your fingertips. Whether you’re just starting out or looking to fine-tune your strategy, PipTrend makes it simple to harness RSI and other indicators for smarter, more confident trading. Ready to see the difference for yourself?
See Your Trading Improve With PipTrend