
Missed reversal signals can drain your trading account faster than you think. In 2025’s fast-moving markets, mastering the hammer candlestick pattern is a game changer for traders across all asset classes.
This comprehensive guide breaks down everything you need to know—how to spot, interpret, and confidently trade the hammer candlestick pattern for greater profits.
You’ll discover its anatomy, market context, identification steps, trading strategies, advanced analysis, real-world examples, and essential risk management tactics.
Actionable strategies and expert insights await—apply them now to level up your trading game.
Understanding the Hammer Candlestick Pattern
Mastering the hammer candlestick pattern is a game-changer for traders in every market. To use it effectively, you need to understand its origins, anatomy, the psychology driving its formation, and how to avoid common misinterpretations. Let’s break down each aspect so you can spot and trade hammers with confidence.
What is a Hammer Candlestick?
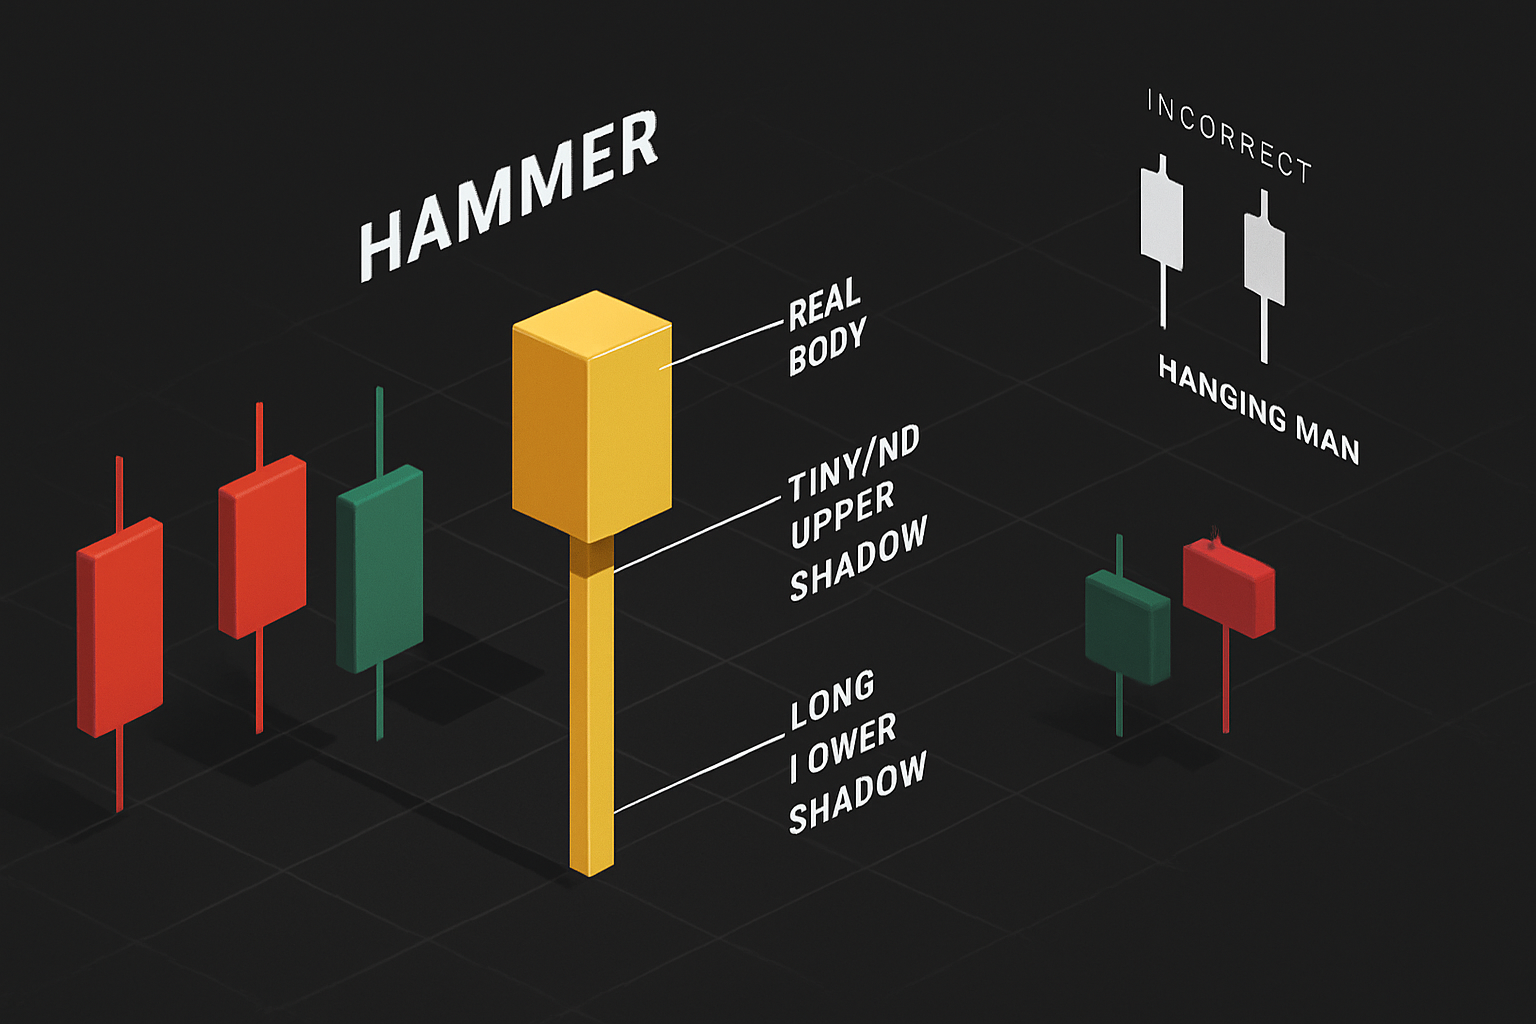
The hammer candlestick pattern is a single-candle formation in technical analysis, signaling a possible bullish reversal after a downtrend. It’s characterized by a small real body near the candle’s high, a long lower shadow at least twice the body, and little or no upper shadow.
This pattern dates back to 18th-century Japan, where rice trader Munehisa Homma first documented candlestick techniques. Today, the hammer is widely recognized as a classic bullish reversal signal—especially when it appears after a significant price decline.
A textbook hammer candlestick pattern looks like this:
Open |
 |
Low ___|____
 |____| ← Small body near top
 | |
 | | ← Long lower shadow
Both green (bullish) and red (bearish) hammers can indicate reversals, but context is critical. For a deeper dive into the hammer candlestick pattern overview, check out this comprehensive guide.
Anatomy of a Hammer Candlestick
Breaking down the hammer candlestick pattern reveals three key components:
- Real Body: Small, positioned near the candle’s top.
- Lower Shadow: At least twice the length of the real body.
- Upper Shadow: Very short or absent.
The color of the real body matters less than its position and the length of the lower shadow. What’s essential is that sellers initially drive the price down, but buyers regain control, pushing the close near the open.
Comparison Table: Hammer vs. Hanging Man vs. Inverted Hammer
| Pattern | Trend Context | Shadow Length | Psychology |
|---|---|---|---|
| Hammer | After downtrend | Long lower shadow | Bullish reversal |
| Hanging Man | After uptrend | Long lower shadow | Bearish reversal |
| Inverted Hammer | After downtrend | Long upper shadow | Bullish, different setup |
Sometimes, hammers can form with slightly longer upper wicks, but if the lower shadow isn’t at least twice the body, it’s not a true hammer.
Volume is another critical factor. Hammers forming on higher-than-average volume have a greater chance of signaling a real reversal. Charts often show that hammer candlestick patterns with heavy volume near support levels outperform those with low volume.
Psychological and Market Dynamics Behind the Hammer
The hammer candlestick pattern captures a psychological tug-of-war between buyers and sellers. At first, sellers dominate—driving the price lower and fueling bearish sentiment. But as the session progresses, buyers step in, absorbing the selling pressure and pushing the price back up to close near the open.
The result? A long lower wick, which is visual proof that the market rejected lower prices. This shift often sparks a change in sentiment, as traders recognize that buyers are regaining control.
For example, imagine a stock sliding for several days. Suddenly, a hammer candlestick pattern forms with a long tail and a small body. This signals that the downtrend may be losing steam—especially if the next candle confirms the reversal by closing above the hammer’s high.
Always wait for confirmation. Without it, even the most promising hammer candlestick pattern can fail.
Variations and Misinterpretations
Not every candle with a long lower shadow is a hammer candlestick pattern. Common variations include hammers with slightly larger bodies or minor upper shadows—but these still need the classic proportions.
Avoid confusing hammers with doji or spinning top patterns. Dojis have almost no real body, while spinning tops have small bodies but equal-length shadows above and below. The hammer candlestick pattern is unique: it appears after a downtrend, with a dominant lower wick and a compact body.
Context is everything. A hammer in an uptrend is not a bullish signal—it could be a hanging man, which is bearish. For example, a false hammer signal might appear during a sideways market, leading to failed reversals. Data shows that hammer candlestick patterns have higher success rates after sharp declines and when paired with strong volume.
Identifying Valid Hammer Patterns in 2025 Markets
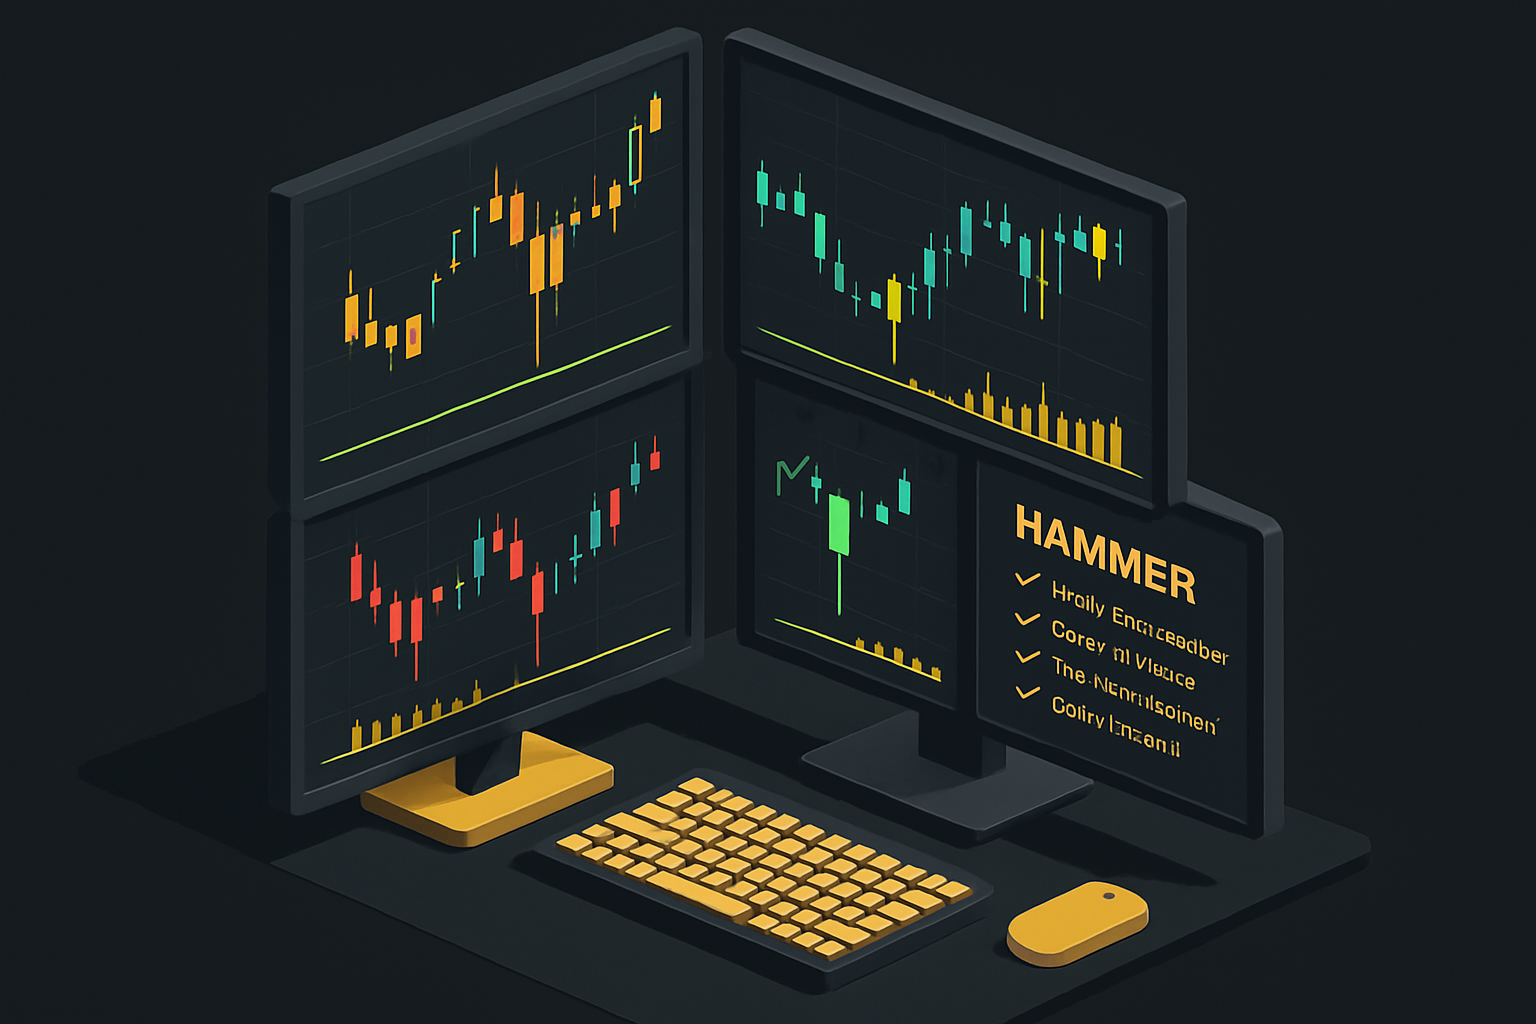
Spotting a valid hammer candlestick pattern in today’s fast-moving markets requires more than just a quick glance at the charts. To consistently profit from bullish reversals, you need a systematic approach—combining context, structure, volume, and confirmation across multiple timeframes. Here’s a step-by-step guide to help you filter out false signals and zero in on high-quality hammer candlestick pattern setups.
Step 1: Confirm Market Context
Before acting on any hammer candlestick pattern, always check the bigger picture. The pattern is most reliable after a clear downtrend—think of it as a potential turning point after sustained selling.
Look for these signs:
- A series of lower lows on the price chart
- Moving averages (such as the 20- or 50-period) sloping downward
- Recent declines of 10% or more in price
For example, a hammer candlestick pattern appearing after a week-long slide in a stock’s price signals a possible reversal. Data shows hammers following extended declines have a much higher probability of reversing the trend compared to those found in sideways or uptrending markets.
Skipping this step can lead to costly mistakes, as hammers in neutral or bullish trends often fail to deliver the reversal traders expect.
Step 2: Analyze Candle Structure and Proportions
Not every candle with a long lower wick qualifies as a hammer candlestick pattern. The structure must be precise to carry weight.
Use this checklist:
- Small real body near the top of the range
- Lower shadow at least twice the length of the real body
- Minimal or no upper shadow
Automated tools and candlestick screeners can help spot these patterns, but manual review is still vital. For example, on a multi-timeframe chart, a valid hammer on the daily timeframe should meet all the above criteria. Data shows that hammers with longer wicks—relative to their bodies—outperform those with shorter wicks, providing stronger reversal signals.
Step 3: Volume and Support Level Confluence
Volume is the secret sauce that confirms the hammer candlestick pattern’s strength. When this pattern forms with above-average volume, it signals that buyers are stepping in with conviction.
Key points to watch:
- Hammer forms near a significant support level or Fibonacci retracement (like the 38.2% or 61.8% level)
- Volume spikes noticeably above the recent average
- Order book data shows increased buying interest around the hammer’s low
For example, a hammer candlestick pattern at the 200-day moving average—paired with surging volume—often marks a powerful reversal. Research indicates that hammers appearing at support with high volume have a far greater success rate. Combining volume analysis with support zones gives you a sharper edge, helping you avoid weak setups.
Step 4: Avoiding Common Mistakes
Even seasoned traders can misread the hammer candlestick pattern. The most frequent errors involve impatience and lack of confirmation.
Mistakes to avoid:
- Entering a trade before the next candle confirms the reversal (i.e., closes above the hammer’s high)
- Confusing hammers with hanging man or doji candles—look for the proper context and proportions
- Ignoring the overall market trend or major economic news that could override technical signals
For instance, a hammer candlestick pattern during a sharp bear market rally may fail without a strong confirmation candle. Statistics show a significant percentage of failed hammers occur when traders jump in too early or ignore broader market signals.
Step 5: Multi-Timeframe Analysis
To maximize the reliability of the hammer candlestick pattern, always view it through the lens of multiple timeframes. A hammer on the daily chart is more powerful when it aligns with bullish signals on the weekly chart.
Best practices include:
- Scanning for hammers on both daily and weekly charts
- Looking for supporting indicators (like bullish RSI divergence) across timeframes
- Synchronizing trade entries with higher timeframe confirmations
According to data, hammer candlestick pattern setups that align on multiple timeframes have the highest success rates. For a deeper dive into these techniques, check out this resource on multi-timeframe analysis strategies. Just remember: while more confirmation is better, overcomplicating your analysis can lead to decision paralysis. Focus on clear, actionable signals that repeat across timeframes.
Trading Strategies Using the Hammer Candlestick Pattern
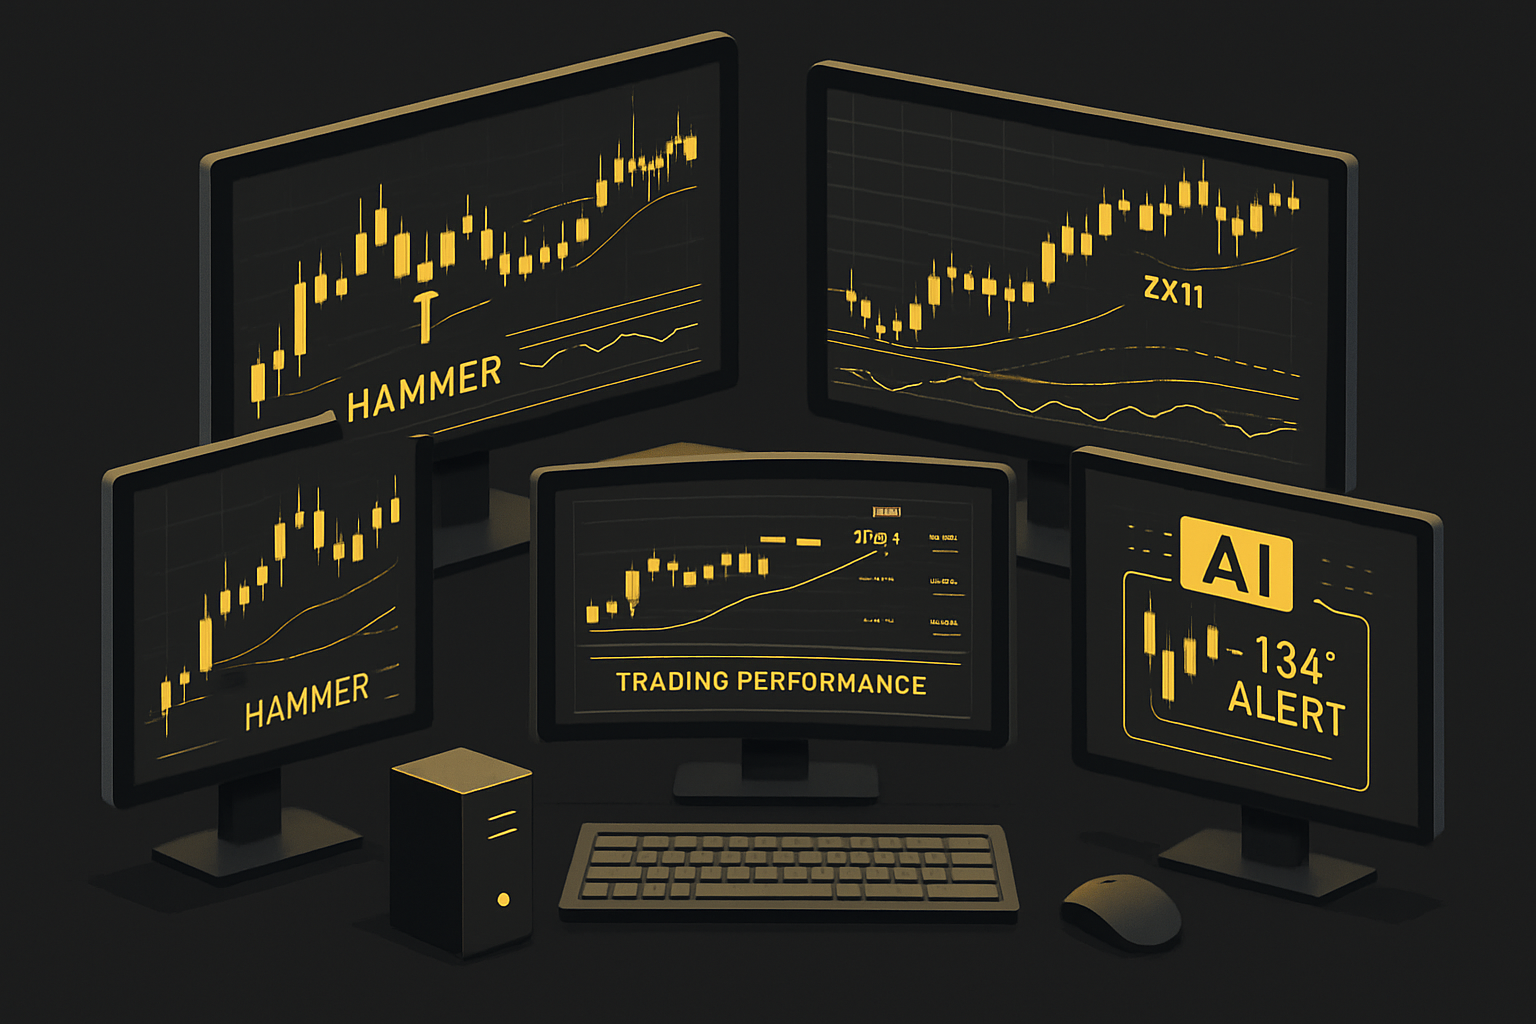
Mastering the hammer candlestick pattern requires more than just spotting its shape. To trade it successfully in 2025, traders need a structured approach—combining precise entries, robust risk management, and real-world data. Let’s break down actionable strategies you can apply in today’s fast-paced markets.
Entry and Exit Techniques
When trading the hammer candlestick pattern, choosing the right entry and exit can make all the difference. Conservative traders typically wait for a confirmation candle—a bullish close above the hammer’s high—before entering. This increases the probability of a true reversal.
Aggressive traders may enter immediately at the hammer close, aiming for higher rewards but accepting increased risk. For both styles, setting a stop-loss just below the hammer’s low or the recent swing low is critical. This limits downside if the reversal fails.
Take-profit targets are often set at the next resistance level or by using fixed reward-to-risk ratios, such as 2:1 or 3:1. For example, if you spot a hammer candlestick pattern on EUR/USD after a steep decline, you could enter after confirmation, set a stop-loss below the wick, and target the next supply zone. Backtesting shows that confirmation entries offer more consistent results, while aggressive entries may yield bigger wins but also more losses.
Combining Hammer with Other Technical Tools
The hammer candlestick pattern is even more powerful when combined with other technical analysis tools. Placing a hammer at a major support zone boosts its reversal potential. Adding moving averages, like the 50-day or 200-day, can further validate your trade. If the hammer forms while the RSI or Stochastic oscillator is in oversold territory, the reversal signal gains strength.
Trendlines and channels help identify breaks in bearish momentum, and Fibonacci retracement levels (38.2% or 61.8%) often act as magnets for price reversals. Integrating these tools creates a robust, multi-layered strategy. For a deep dive into these techniques, check out Hammer Candlestick Trading Strategies for practical setups and chart examples that showcase the hammer candlestick pattern in action.
Risk Management and Position Sizing
No matter how reliable the hammer candlestick pattern looks, strict risk management is non-negotiable. The first rule: always use a stop-loss, ideally just below the hammer’s low. This protects your capital from large, unexpected moves.
Position sizing should be based on your account size and risk tolerance—never risk more than 1–2% of your trading capital on a single trade. Adjust your trade size according to the volatility of the asset. For instance, calculating the position size for a hammer candlestick pattern on Bitcoin will differ from a low-volatility stock. Consistently applying these rules helps you stay in the game, even when some trades inevitably fail.
Backtesting and Performance Evaluation
Before relying on any hammer candlestick pattern strategy, backtesting is essential. Use historical data to assess how your approach performs across different markets and timeframes. Key metrics to analyze include win rate, average return, and maximum drawdown.
For instance, backtesting the hammer candlestick pattern on S&P 500 stocks from 2020–2024 might reveal a 55% win rate with an average 2:1 reward-to-risk ratio. In forex, results may vary due to higher volatility. Adapting your strategy for trending versus ranging environments is crucial. Regular performance reviews and tweaks based on data will keep your edge sharp as markets evolve.
Real-World Examples and Case Studies
The hammer candlestick pattern has signaled major reversals across every asset class. In 2023, Apple stock formed a textbook hammer after a sharp decline—triggering a sustained rally. Similarly, Bitcoin’s weekly hammer at its cycle low led to a multi-month uptrend.
Commodities like gold also respond to the hammer candlestick pattern, with monthly hammers often marking long-term bottoms. However, not every hammer leads to a reversal; sometimes, broader bearish momentum overwhelms the signal. Reviewing both successful and failed trades helps you understand the hammer’s real-world reliability and set realistic expectations.
Advanced Hammer Pattern Analysis
Seasoned traders take the hammer candlestick pattern to the next level by layering advanced techniques. Multi-timeframe analysis—such as spotting a daily hammer supported by a weekly bullish divergence—dramatically increases reliability. Success rates are often higher when hammers align across timeframes.
Different sectors and asset classes may show varying hammer effectiveness. For example, tech stocks may respond quicker to reversal signals than energy stocks. Volatility and news events also impact outcomes, sometimes invalidating textbook setups. By analyzing performance across environments, you’ll discover where the hammer candlestick pattern shines brightest and where it needs extra confirmation.
Hammer Patterns in Different Markets and Timeframes
Identifying and trading the hammer candlestick pattern successfully requires an understanding of how it behaves across various markets and timeframes. Whether you’re analyzing stocks, forex, or crypto, each environment brings its own flavor to pattern recognition and execution. Let’s break down the key differences, strategies, and tools you’ll need to master the hammer candlestick pattern no matter where—or how—you trade.
Stocks, Forex, and Crypto Applications
The hammer candlestick pattern appears in all major asset classes, but its effectiveness can vary dramatically. In stocks, hammers often form after sharp earnings drops, signaling a potential reversal as buyers step in. Forex traders spot hammers near key currency support zones, where the pattern can signal a shift in momentum for pairs like EUR/USD or GBP/JPY. Crypto markets, known for their volatility, frequently produce pronounced hammers—especially during deep corrections—making the pattern a favorite for traders seeking quick turnarounds.
Here’s a quick comparison of the hammer candlestick pattern’s reliability:
| Market | Typical Volume | Volatility | Hammer Reliability |
|---|---|---|---|
| Stocks | High/Variable | Medium | Moderate–High |
| Forex | High | Low–Medium | High |
| Crypto | Variable | Very High | Moderate |
Market nuances also matter. Stocks have fixed hours, influencing when hammers form and close. Forex trades 24/5, so hammers can emerge during major news releases or thin liquidity periods. Crypto trades nonstop, with high volatility amplifying both the risks and rewards of hammer trades. If you want to dive deeper, check out this Hammer Candlestick Pattern Explained & Backtested resource for performance data across markets.
Intraday vs. Swing Trading with Hammers
The hammer candlestick pattern adapts well to different timeframes. Intraday traders, working on 5-minute or hourly charts, use hammers to catch quick reversals—often setting tighter stop-losses due to rapid price swings. Swing traders prefer daily or weekly hammers, targeting larger moves with wider stops and greater patience.
For example, an intraday hammer on NASDAQ futures might signal a sharp bounce after a morning selloff, while a weekly hammer on Bitcoin could hint at a long-term bottom. Win rates for the hammer candlestick pattern can vary by timeframe, but higher timeframes generally offer more reliable signals due to reduced market noise.
Technology and Tools for Hammer Pattern Detection
Modern trading platforms make spotting the hammer candlestick pattern easier than ever. Charting software like TradingView or MetaTrader includes built-in pattern recognition, highlighting potential hammers in real time. Dedicated screeners and scanners can filter for hammer setups across hundreds of assets, saving valuable research time.
Automated trading systems take things further by executing trades when a valid hammer is detected, based on your pre-set criteria. AI-powered tools now offer lightning-fast analysis, often outperforming manual identification in speed and accuracy. For busy traders, these solutions can mean the difference between catching or missing a prime hammer reversal.
How AI-Powered Tools Like PipTrend Enhance Hammer Pattern Trading
AI-powered trading indicators are revolutionizing how traders use the hammer candlestick pattern. Platforms like PipTrend provide real-time, accurate buy and sell signals for forex, crypto, stocks, and indices—with a specific focus on candlestick reversals.
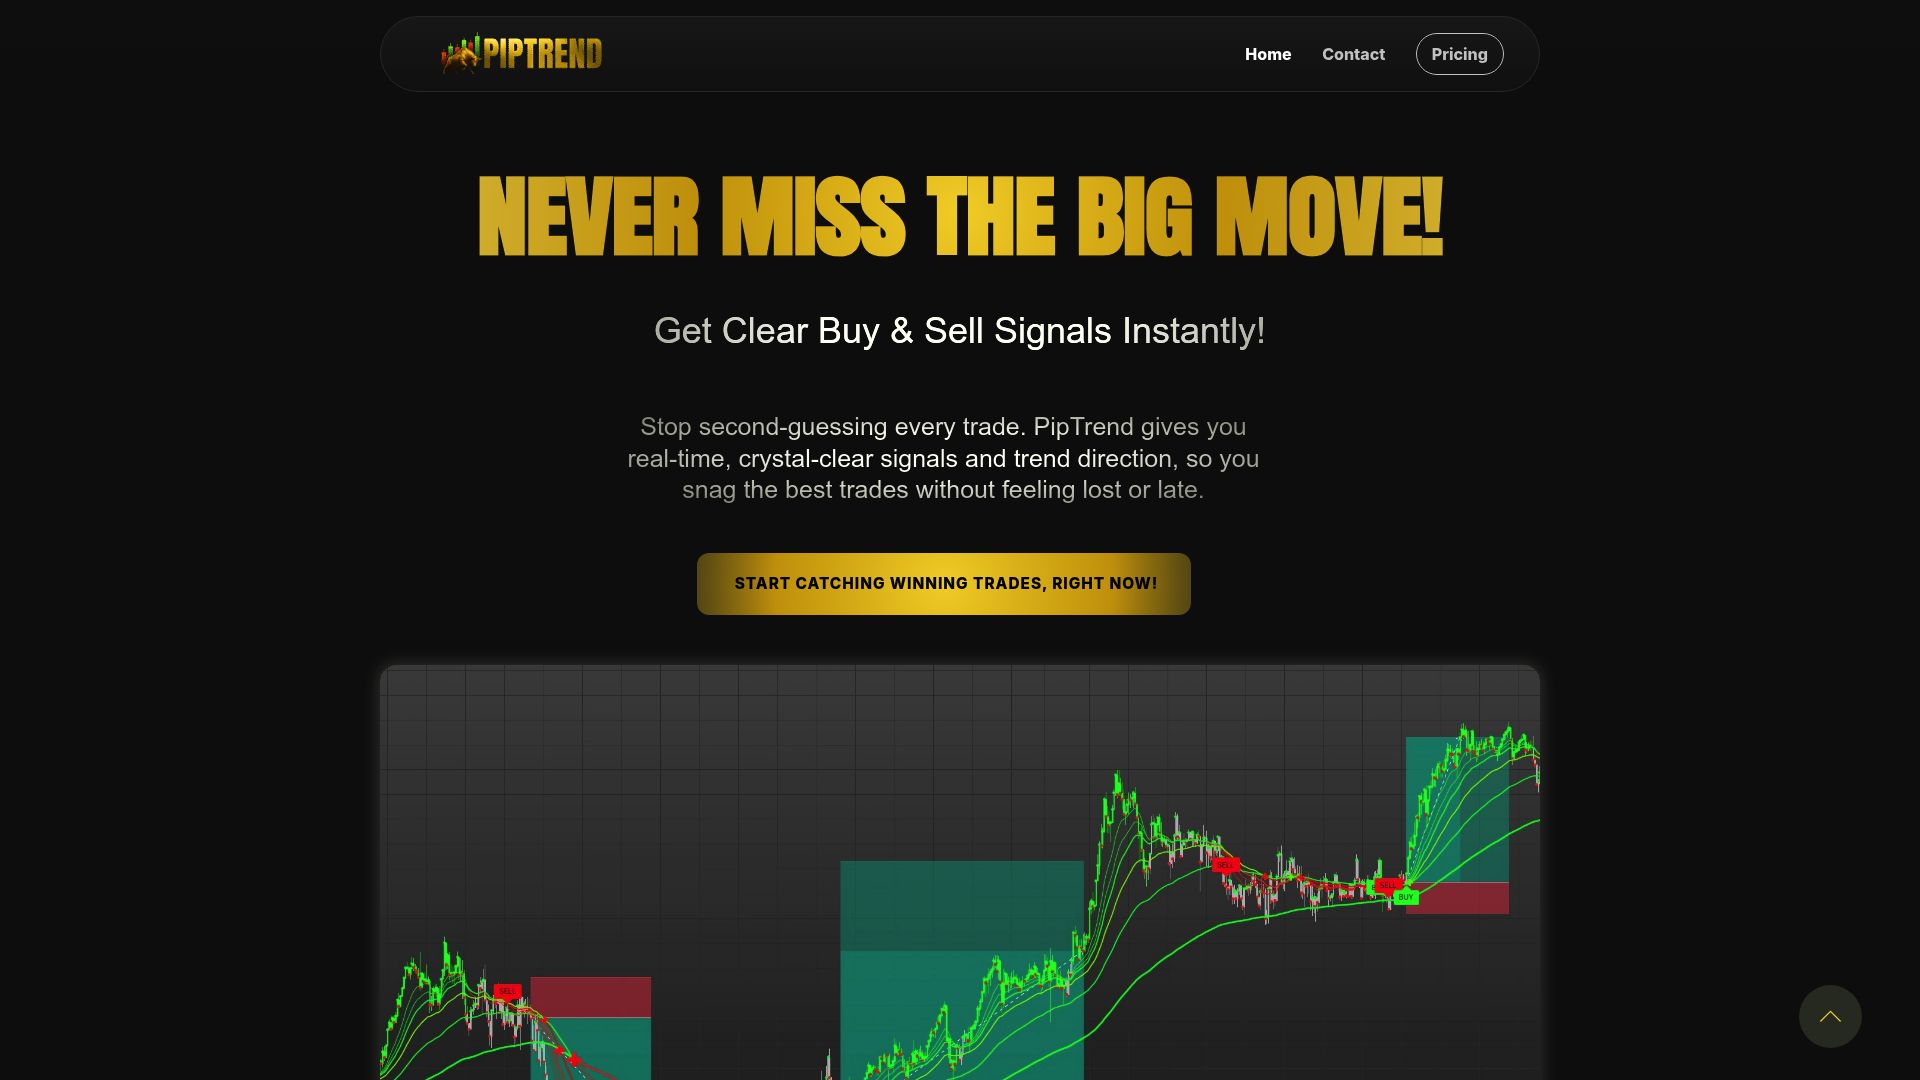
With PipTrend, you can instantly see hammer pattern alignment across multiple timeframes, making it easy to catch high-probability setups. Real-time alerts ensure you never miss a hammer opportunity, while the user-friendly interface demystifies complex candlestick analysis for traders of all skill levels.
Imagine receiving an instant notification as soon as a hammer candlestick pattern forms on your favorite asset—no more endless chart-watching or second-guessing. By leveraging AI, confidence increases, guesswork decreases, and your results become more consistent. For traders in 2025, integrating AI-powered tools like PipTrend is quickly becoming a must for mastering the hammer candlestick pattern across diverse markets and timeframes.
Avoiding Common Pitfalls and Mastering Hammer Pattern Trading
The journey to mastering the hammer candlestick pattern is filled with learning opportunities—and, if you’re not careful, common traps. Even experienced traders sometimes fall into habits that undermine their results. By recognizing these frequent errors, you can sharpen your strategy and improve your outcomes with this high-impact reversal signal.
Common Mistakes to Avoid
Traders often rush into positions whenever they spot a hammer candlestick pattern, but not every signal is valid. Overtrading, especially without a confirmation candle, can quickly erode profits. Entering trades outside of a downtrend or mistaking similar patterns—like the hanging man or doji—for a hammer can also lead to poor results.
Neglecting risk management is another frequent pitfall. Always set a stop-loss below the hammer’s low and size your position carefully. For a deeper dive into win rates and evidence-backed results, review real-world Hammer Candlestick Pattern Backtest Results. Data consistently show that discipline and confirmation are key to successful hammer trades.
Psychological Aspects of Trading Hammers
Emotions can be a trader’s worst enemy, especially when trading the hammer candlestick pattern. Fear of missing out (FOMO) might push you to jump in without proper setup, while revenge trading after a loss can cloud your judgment. Building discipline is crucial—stick to your entry and exit rules, and don’t let excitement override your plan.
Handling losses gracefully and learning from them helps you grow. Confidence comes from practicing your strategy and consistently reviewing your trades. The hammer candlestick pattern rewards patience and a clear head, not impulsivity. Remember, every trade is a learning experience.
Adapting to Evolving Markets in 2025
The landscape for the hammer candlestick pattern is changing fast. Algorithmic and high-frequency trading have made markets more volatile and unpredictable. This means that old strategies might not work as reliably in 2025 as they once did.
To stay ahead, adapt your approach for quicker market moves and integrate new tools. Monitor how the hammer candlestick pattern performs in different environments, and be ready to refine your method. Historical data shows that continuous learning and flexibility are vital as market dynamics evolve.
Practical Application: Step-by-Step Hammer Trade Setup
Applying the hammer candlestick pattern consistently requires a methodical process. Here’s a quick guide:
- Identify a clear downtrend.
- Spot a valid hammer with a long lower shadow and small real body.
- Check for high volume and proximity to a support level.
- Wait for a bullish confirmation candle.
- Set your stop-loss below the hammer’s low and size your trade appropriately.
- Monitor the trade, adjusting if new information arises.
Following these steps boosts your chances of success with the hammer candlestick pattern and keeps your trading decisions objective and repeatable.
Continuous Improvement and Community Resources
Mastering the hammer candlestick pattern is an ongoing journey. Journaling every trade helps you spot patterns in your performance and refine your approach over time. Participating in trading communities offers valuable feedback and fresh perspectives.
Leverage educational resources, webinars, and backtesting tools to stay sharp. For foundational concepts, Beginner trading fundamentals is a great resource. Data shows that traders who review and adapt their strategies consistently achieve higher long-term success rates with the hammer candlestick pattern.
Now that you know how to spot and trade the hammer candlestick pattern like a pro, why not take things to the next level? Imagine getting instant alerts and crystal-clear buy signals—no more second-guessing or missed opportunities. With PipTrend’s AI-powered platform, you can simplify your trading routine and react with confidence, whether you’re into forex, crypto, stocks, or indices. Let’s put these strategies to work together and see how much your trading can improve—starting right now.
See Your Trading Improve With PipTrend