
Liquidity is the lifeblood of every financial market, shaping how trades are executed and influencing every outcome. As we approach 2025, understanding the forces behind liquidity will be more important than ever for traders and institutions.
This guide unpacks sell side liquidity, revealing its core mechanisms, practical strategies, and the impact it has on both profits and risks. Whether you're a seasoned investor or just starting out, mastering sell side liquidity offers a real competitive edge.
You'll discover the fundamentals, learn how to identify liquidity zones, and gain tools for trading smarter in a rapidly changing landscape. Dive in and leverage these insights to make more informed trading and investment decisions.
Understanding Sell Side Liquidity: Fundamentals and Market Role
Liquidity is the lifeblood of every financial market, and understanding its structure is crucial for any trader or investor. At its core, sell side liquidity refers to the ability of the market to absorb sell orders without causing dramatic price shifts. This concept is distinct from buy side liquidity, which focuses on the ease of filling buy orders.
The sell side of the market is typically made up of brokers, banks, and market makers. These entities act as the primary providers of sell side liquidity, constantly quoting prices and facilitating trades for their clients. Their activities ensure that traders can exit positions efficiently, no matter the market conditions.
| Entity Type | Role in Sell Side Liquidity |
|---|---|
| Brokers | Match buyers and sellers |
| Market Makers | Provide continuous bid-ask quotes |
| Banks | Facilitate large institutional trades |
By maintaining a steady flow of offers, these players help stabilize prices and reduce volatility. As a result, sell side liquidity is a key pillar supporting overall market efficiency and stability.
Sell side liquidity zones often form just below significant support levels. For example, when a stock consolidates near a key price, clusters of stop-loss orders can accumulate underneath. Once these stops are triggered, a wave of sell orders hits the market, creating a dense pocket of sell side liquidity. This phenomenon can lead to sharp price drops as liquidity is quickly absorbed.
Institutional investors, such as hedge funds and prop trading desks, play a major role in shaping these liquidity pools. Retail traders also contribute, especially when their stop-loss orders align with institutional activity. This interaction between large and small players creates dynamic zones where sell side liquidity becomes concentrated.
Recent data highlights that over 90% of forex daily trading volume is driven by major financial institutions. Their actions not only provide liquidity but also influence price discovery. When these entities enter or exit large positions, they can trigger significant price movements as the market seeks a new equilibrium.
Understanding the relationship between sell side liquidity and price discovery is essential. When there is an imbalance between supply and demand, prices adjust rapidly to restore balance. Sell side liquidity acts as the buffer, absorbing selling pressure and preventing disorderly market moves.
For those interested in a deeper dive into the contrasts between buy side and sell side liquidity, Buy Side vs Sell Side Liquidity offers a comprehensive comparison that can further enhance your market perspective.
In summary, sell side liquidity is not just a technical term, but a fundamental market force. It governs how smoothly markets function, how prices are set, and how traders can enter or exit with confidence.

Key Differences Between Sell Side and Buy Side Liquidity
Understanding the distinction between sell side liquidity and buy side liquidity is crucial for anyone navigating today’s financial markets. These two forces shape how assets are traded, priced, and managed, especially as we approach 2025’s rapidly evolving landscape.
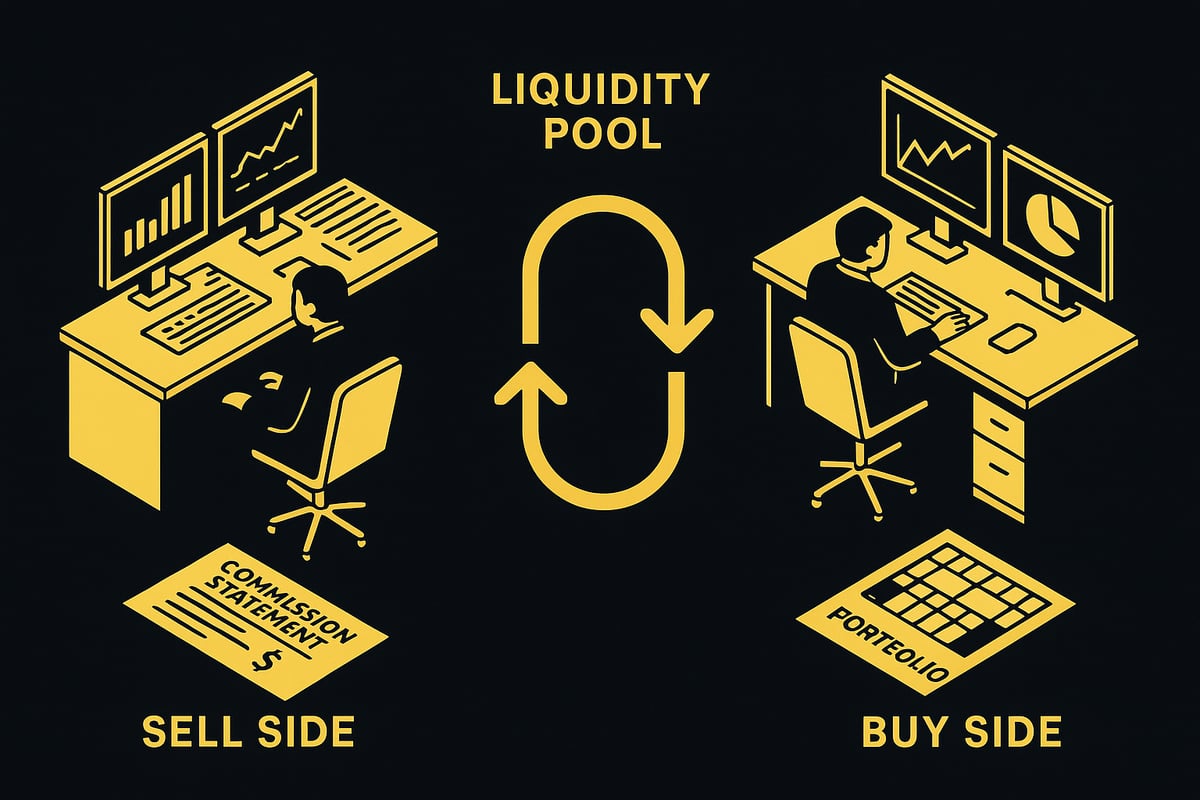
Let’s break down the core differences with a side-by-side comparison:
| Aspect | Sell Side Liquidity | Buy Side Liquidity |
|---|---|---|
| Primary Objective | Facilitate transactions, earn commissions/spreads | Maximize investment returns |
| Clientele | Issuers, retail, institutional investors | Funds, HNWIs, pension/endowment managers |
| Operations | Underwriting, market making, research | Portfolio management, security selection |
| Compensation | Fixed salaries, transaction-based bonuses | Performance-based pay |
| Regulation | Market integrity, transparency | Fiduciary duty |
The sell side liquidity providers, such as brokers, investment banks, and market makers, focus on creating a smooth marketplace. Their main goal is to match buyers and sellers, provide quotes, and earn from spreads or commissions. In contrast, buy side participants like asset managers, hedge funds, and high-net-worth individuals seek to generate returns by selecting and managing investments.
Client relationships further separate the two. Sell side liquidity teams cater to a wide array of clients, including retail traders, corporations, and institutions. Buy side liquidity is concentrated among professional investors managing large pools of capital, like mutual or pension funds.
Operationally, the sell side handles underwriting, market making, and research, enabling efficient trading environments. The buy side, on the other hand, emphasizes portfolio construction, security analysis, and risk management to achieve targeted returns.
Compensation structures highlight another key distinction. Sell side liquidity professionals often receive base salaries with bonuses tied to transaction volume or client acquisition. Buy side roles are more performance-driven, with compensation directly linked to portfolio returns.
Regulatory frameworks also differ. The sell side faces strict requirements around market transparency and integrity, while the buy side operates under fiduciary obligations to prioritize client interests.
Consider how liquidity zones form. Sell side liquidity often gathers below major support levels, where stop-loss orders cluster, creating potential for sharp price moves when breached. Buy side liquidity, however, tends to accumulate above resistance as large investors look to enter or exit positions discreetly.
For example, during a high-volume selloff, sell side liquidity pools can absorb rapid selling, preventing extreme price swings. Meanwhile, buy side liquidity may withdraw in uncertain times, leading to thinner markets and heightened volatility.
Statistics reveal that there are generally fewer buy side jobs compared to more abundant entry-level opportunities on the sell side. This reflects the broader role of sell side liquidity in day-to-day market functioning.
Understanding these distinctions is essential for traders developing robust strategies. As stock market liquidity changes in 2025, mastering the nuances between sell side liquidity and buy side liquidity can mean the difference between seizing opportunities and missing out.
By recognizing how each side operates, market participants can better anticipate price movements, manage risk, and adapt to evolving liquidity dynamics.
Identifying Sell Side Liquidity Zones: Tools and Techniques
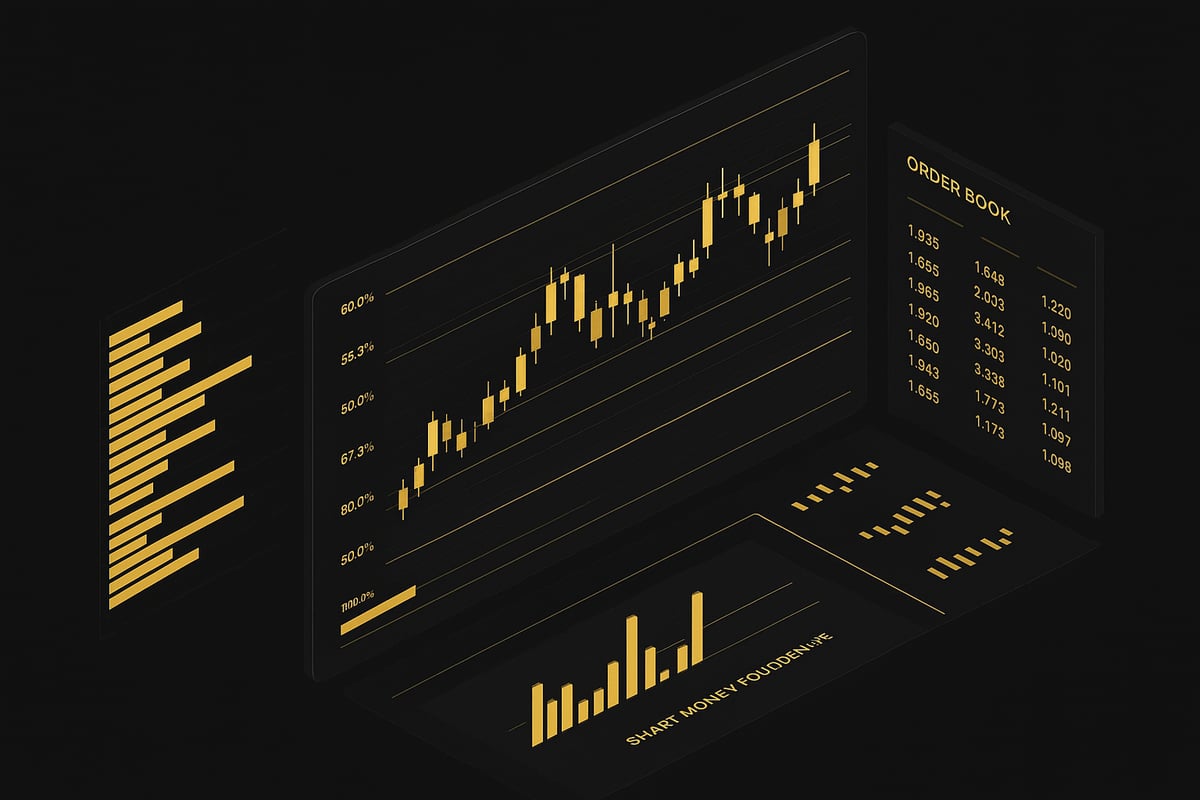
Pinpointing sell side liquidity zones is essential for traders who want to anticipate price moves and manage risk. By leveraging a combination of technical analysis and order flow insights, you can uncover the hidden pools where significant orders reside. These zones often become catalysts for sharp market reactions, so understanding how to identify them gives you a tangible edge.
Technical Analysis Methods
Technical analysis plays a foundational role in locating sell side liquidity on price charts. Several tools help traders visualize where large clusters of sell orders may be hiding.
Some of the most effective methods include:
- Support Levels: Price areas where buyers previously stepped in, often becoming zones packed with stop-loss orders. When breached, these levels can unleash a wave of sell side liquidity.
- Moving Averages and Trend Lines: These dynamic indicators frequently attract institutional activity. A price drop below a major moving average, for example, can trigger automated selling and reveal underlying liquidity.
- Volume Profile Indicators: These tools plot traded volume at each price level, highlighting zones of heavy activity. High-volume nodes often correspond to sell side liquidity pools.
- Fibonacci Retracement/Extension Levels: Many traders use Fibonacci ratios to anticipate where liquidity clusters may develop. For a detailed look at this approach, see Fibonacci Retracement Techniques.
- Candlestick Patterns: Formations like engulfing bars or spinning tops can signal battles between buyers and sellers, exposing where liquidity is concentrated.
Consider a stock consolidating at a $13.50 support level. As price tests this zone, sell side liquidity accumulates from stop-loss orders placed just below. If the support breaks, a cascade of selling can occur, pushing prices lower in a rapid move.
Here's a quick summary table:
| Tool/Indicator | Liquidity Zone Signal |
|---|---|
| Support Levels | Stop-loss clusters below |
| Moving Averages | Algorithmic selling triggers |
| Volume Profile | High-volume price areas |
| Fibonacci Levels | Anticipated cluster zones |
| Candlestick Patterns | Battle and reversal points |
By combining these approaches, traders can map out where sell side liquidity is likely to emerge and plan their entries accordingly.
Order Flow and Market Structure Insights
Order flow analysis dives deeper into the mechanics behind sell side liquidity. By scrutinizing market data, traders can detect hidden liquidity and anticipate sharp price moves.
Start by examining the order book. Large sell orders, or "icebergs", often sit just below key support areas. Monitoring these levels uncovers where big players are waiting to offload positions.
Another technique involves tracking stop-loss placement trends. Retail traders tend to cluster stops in obvious places, such as just under recent lows. When the market approaches these spots, a liquidity hunt can trigger a swift drop as stops are hit in sequence.
Market structure shifts provide further clues. When price forms lower lows and lower highs, it signals a transition to bearish control, often exposing vulnerable liquidity pools. Volume spikes and fair value gaps (areas where price moves rapidly with little trading) also point to dense sell side liquidity.
Institutional footprints are especially important. Smart money often leaves subtle traces, such as large block trades or persistent selling pressure, that reveal the buildup of liquidity zones. For example, a sudden, high-volume sell-off at a previously stable price level usually indicates that institutional players are tapping into a pool of sell side liquidity.
By weaving together these order flow and market structure signals, traders can position themselves ahead of major price moves and avoid getting caught in liquidity-driven volatility.
Strategies for Trading with Sell Side Liquidity in 2025
Mastering strategies around sell side liquidity is essential for navigating the increasingly complex markets of 2025. Traders and institutions need a clear, stepwise approach to pinpointing, capitalizing on, and managing liquidity-driven opportunities. Below, we break down actionable steps designed to help you thrive in this evolving landscape.

Step 1: Mapping Out Key Support and Liquidity Zones
Identifying key support and liquidity zones is the foundation for trading with sell side liquidity. Begin with technical analysis—plot major support levels, moving averages, and trend lines. These act as magnets for large orders and highlight where liquidity pools accumulate.
Order flow analysis adds another layer. Examine the order book to spot clusters of stop-loss orders or pending limit sells just below support zones. These clusters are often where sell side liquidity is concentrated.
Stay alert to market catalysts like earnings, central bank meetings, or news events. These can shift liquidity zones quickly, so align your analysis with the broader market context. By consistently mapping these areas, you position yourself ahead of major price moves.
Step 2: Timing Entries and Exits Around Liquidity Events
Timing is everything when trading with sell side liquidity. The goal is to anticipate when liquidity will be released, often after a support level breaks and stop-loss orders trigger a cascade of selling.
Watch for volume surges as confirmation. High volume at a breached support signals that sell side liquidity is being absorbed. Enter short trades during these moments to ride momentum.
Here’s a simple logic for trade execution:
if price < support_level and volume > avg_volume * 2:
 enter_short()
 set_stop_loss(next_liquidity_zone)
Plan exits before the next major liquidity pool. Use trailing stops to lock in gains as price approaches another dense area. This approach leverages the natural ebb and flow of liquidity for precise trade management.
Step 3: Risk Management Techniques
Managing risk is critical when trading around sell side liquidity. Set stop-losses with full awareness of where liquidity pools are clustered. Avoid placing stops too close to obvious support, where they can be hunted by larger players.
Trailing stops provide flexibility, letting you capture profits while adapting to changing liquidity conditions. Here’s a quick comparison:
| Risk Tool | Purpose | When to Use |
|---|---|---|
| Fixed Stop-Loss | Limit max loss | High volatility periods |
| Trailing Stop | Lock in profits as price moves | Trending markets |
| Partial Take-Profit | Secure gains at key liquidity zones | Before major support |
Remember, trading too close to dense sell side liquidity zones increases the chance of getting stopped out unnecessarily. By understanding the behavior of sell side liquidity, you can better protect your capital and enhance your position sizing.
Step 4: Adapting to Market Regimes and Volatility
Markets in 2025 are more dynamic than ever, and sell side liquidity can shift rapidly during high-volatility events. Adjust your strategies to fit the prevailing regime—what works in a range-bound market may fail during sudden liquidity crunches.
Historical data reveals that liquidity-driven price swings often occur around major economic releases or unexpected news. Use multi-timeframe analysis to confirm liquidity zones across daily, hourly, and intraday charts. This layered view helps you identify where sell side liquidity is most likely to influence price.
For deeper insights on how to navigate these shifting conditions, Navigating 2025’s Volatility and Liquidity Shifts offers a comprehensive look at market updates and structural changes. Staying agile and informed is key to capitalizing on the evolving sell side liquidity landscape.
Step 5: Integrating Technology and Automation
Technology is transforming how traders interact with sell side liquidity. Algorithmic tools can monitor liquidity pools in real time, alerting you to emerging opportunities or risks. AI-driven indicators analyze vast data streams to detect evolving liquidity zones faster than manual methods.
Automation helps reduce emotional bias and ensures consistent execution. However, it is important to understand the limitations—algorithms can miss context or generate false signals in unusual market conditions.
Blend automated strategies with human oversight for best results. By leveraging both technology and your own expertise, you can harness the full potential of sell side liquidity in 2025.
The Impact of Technology and AI on Sell Side Liquidity
Technology and artificial intelligence are revolutionizing how traders and institutions approach sell side liquidity. Machine learning algorithms now analyze millions of data points to uncover hidden liquidity pools, offering insights that were previously out of reach. By harnessing these advancements, market participants can spot emerging trends and react faster than ever before. If you are curious about the practical side of this transformation, check out AI and Trading Technology for a deeper dive.
Automated trading platforms now provide real-time alerts when significant sell side liquidity events occur. These systems scan order books, volume spikes, and price action to identify institutional stop clusters and sudden shifts in market structure. Big data plays a crucial role, allowing traders to map and predict sell side liquidity zones across multiple assets. For example, an AI-powered tool might flag a surge in sell orders below a key support level, helping traders anticipate rapid price moves.
The speed and accuracy of sell side liquidity detection have improved dramatically, but there are risks to consider. Over-reliance on automation can lead to false signals, especially during volatile market conditions. It is essential to combine algorithmic insights with human judgment. Regulatory bodies are increasingly scrutinizing AI-driven liquidity solutions, requiring transparency in how these algorithms operate and make decisions. Traders must strike a balance between embracing technology and maintaining compliance.
Adoption of AI trading tools is accelerating among both institutional and retail participants. Recent studies show a sharp uptick in the number of firms integrating machine learning for liquidity analysis. As we approach 2025, expect further transformation in how sell side liquidity is understood and managed. For a broader perspective on how technology is reshaping liquidity across markets, explore Secondary Market Liquidity Transformation in 2025. Staying informed and adaptable will be key to maintaining an edge as the landscape evolves.
Emerging Trends and Insights in Sell Side Liquidity for 2025
As we approach 2025, the landscape of sell side liquidity is evolving at a rapid pace. Traders and institutions must adapt to new trends, regulatory shifts, and market innovations to stay ahead. Understanding the latest developments in sell side liquidity can help you identify emerging opportunities and mitigate risks in a changing environment.
Institutional and Regulatory Developments
Institutional players are at the forefront of shifting sell side liquidity trends. In 2025, regulatory changes are expected to tighten transparency and reporting requirements, influencing how liquidity providers operate.
For example, central bank interventions or changes in trading hours can reshape liquidity pools and impact market stability. Institutions are also adopting more sophisticated techniques, such as algorithmic trading and real-time compliance monitoring, to adapt to these shifts.
To gain deeper insight into how institutional strategies are influencing the market, check out Institutional Trading Strategies and Market Impact, which examines the core methods institutions use to manage sell side liquidity.
Evolving Trading Strategies
Trading strategies are becoming increasingly hybrid, blending manual expertise with advanced automation. Sell side liquidity mapping now often spans multiple asset classes, including forex, crypto, and equities.
Traders are using cross-market analysis to spot liquidity clusters that may signal large institutional activity. This approach allows for more precise timing and execution, especially as markets become more interconnected.
Hybrid strategies help traders adapt quickly when traditional liquidity patterns shift, providing an edge in a competitive environment.
Market Risks and Opportunities
The evolving nature of sell side liquidity introduces both risks and opportunities. Liquidity crunches and flash crashes can occur when traditional support levels fail, often triggered by shifting institutional flows.
However, these events also create room for arbitrage and alpha generation. Traders who can quickly identify liquidity imbalances are better positioned to capitalize on short-lived price moves.
Historical data shows that when sell side liquidity pools are disrupted, markets can react with dramatic volatility, underscoring the need for robust risk management.
The Role of Education and Continuous Learning
Staying current with sell side liquidity concepts is essential for long-term success. The market is constantly evolving, and what worked last year may not be effective tomorrow.
Engaging with webinars, research papers, and trading communities can boost your understanding of new liquidity environments. Case studies of traders who adapt their strategies highlight the importance of ongoing education.
Continuous learning ensures you are prepared to identify new liquidity patterns and act on them with confidence.
Predictions for the Future
Looking ahead, experts predict that sell side liquidity will become even more influenced by technology, regulation, and global macro trends. Automation and AI will likely play a larger role, but human expertise will remain vital for interpreting complex market signals.
Key takeaways include the importance of integrating new tools, maintaining flexibility, and staying informed about regulatory developments. By embracing these insights, traders and institutions can maintain an edge as the market for sell side liquidity continues to evolve.
Now that you’ve seen how mastering sell side liquidity can give you a real edge in today’s markets, why not take the next step? With all the strategies and tech insights we’ve covered, you deserve tools that keep up—like real time signals, clear entry and exit points, and simple analysis across forex, crypto, stocks, and indices. If you’re ready to eliminate the guesswork and trade with confidence, let’s put these insights into practice together.
START USING PIPTREND