Sell-Side Liquidity: Where Price Really Goes to Hunt Stops
On this page
Why Every Chart Has a Magnet Below It
You mark a clean support level. Price slices through it by six pips, wicks hard, and closes back above.
Twenty minutes later it’s fifty pips higher, and your stop is sitting in the trade log as a loss.
Sound familiar?
It happens often enough that traders build entire belief systems around it.
Some start fading every low on the assumption that the market is out to get them. Others ignore the pattern completely and get chopped up on breakdowns that were never real.
Both reactions come from the same misunderstanding.
Sell-side liquidity is not evidence that someone is hunting your stop specifically. It’s a mechanical description of where resting orders pile up beneath price, and what tends to happen when enough of them get triggered at once.
That distinction matters more than it sounds.
If you treat a sweep as proof of institutional intent, you’ll take trades based on a story. If you treat it as a location where a reaction becomes more likely, you’ll wait for something measurable before committing capital.
This guide covers the mechanics first: what sell-side liquidity actually is, how sell-stop orders convert into market orders, and why equal lows behave differently from a single lonely swing low. Then it covers the harder part, which is building an objective confirmation checklist so a sweep becomes a filter instead of a trigger.
No mind reading required.
Just structure, displacement, and a defined invalidation point.
What Sell-Side Liquidity Really Means
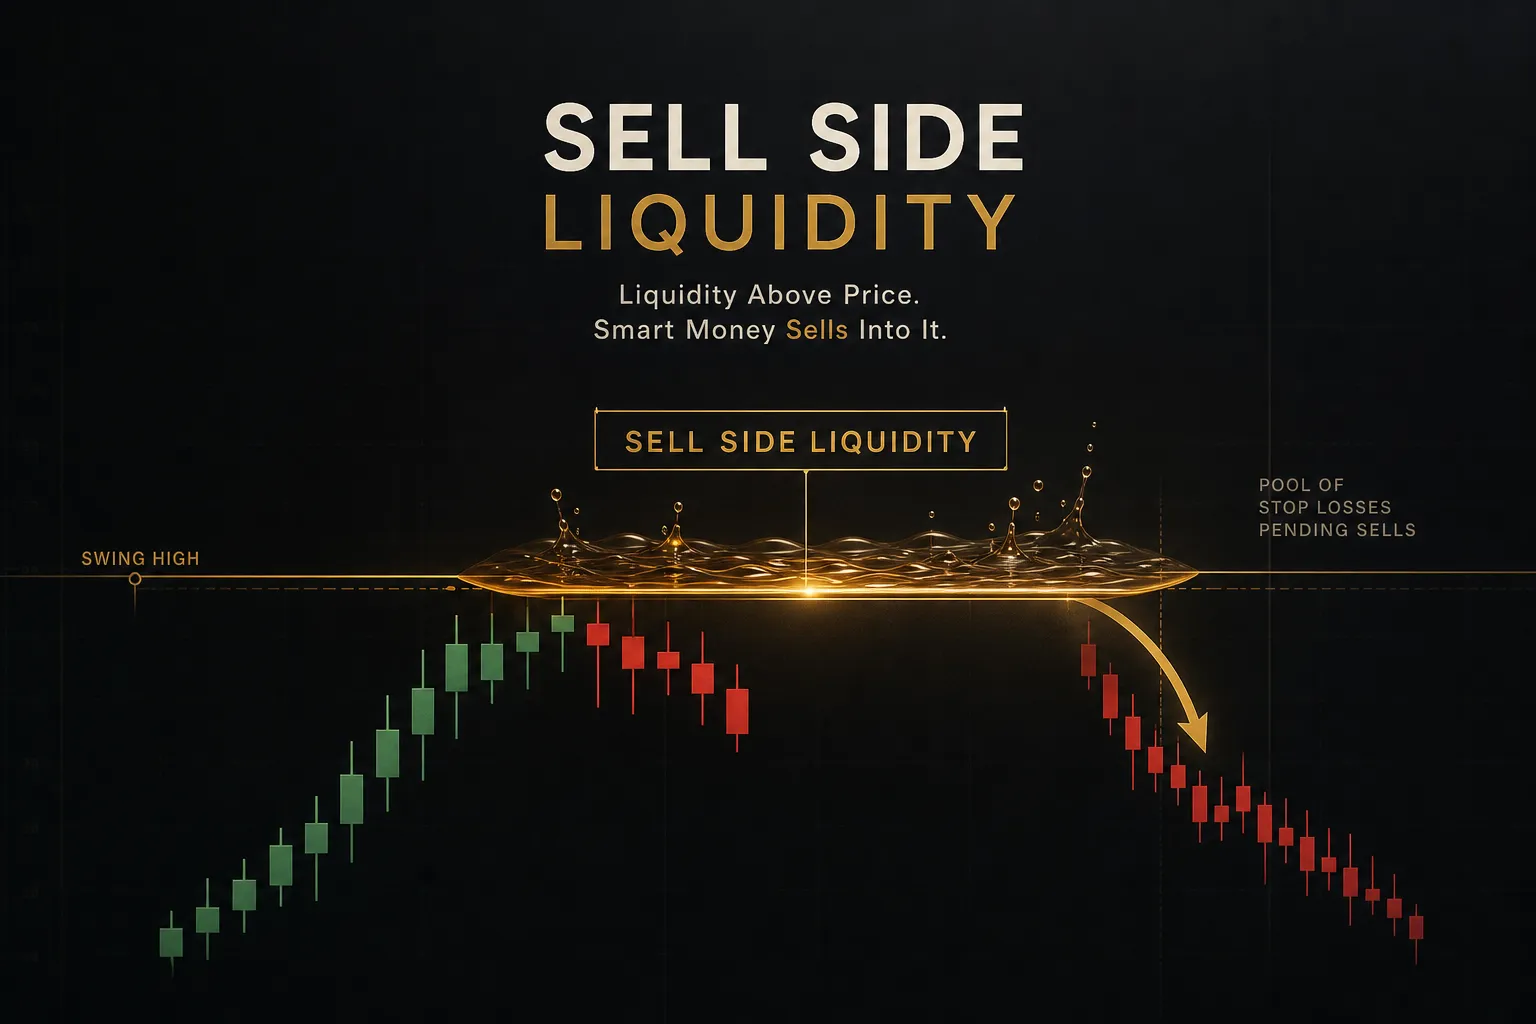
Sell-side liquidity is the cluster of sell-stop and stop-loss orders resting below identifiable lows on a chart. When price trades into that zone, those orders convert to market sell orders, and a pocket of ready-made selling pressure gets released into the book.
That’s the whole definition.
No conspiracy attached.
Here’s what separates the trading-desk version of the term from the way ICT and Smart Money Concepts traders use it:
- Conventional market liquidity describes how easily an asset can be bought or sold without moving the price. It’s measured with spreads, depth, and turnover. A liquid market absorbs size quietly.
- Order-book depth is the visible ladder of limit orders on a centralized exchange. You can see it in futures and most crypto venues. It tells you what’s sitting there right now, not what will appear when a level breaks.
- Sell-side liquidity in the ICT sense refers to inferred stop orders below lows. Nobody can see them. Retail stop-loss orders held at a broker are not published to the wider market, and in OTC forex there is no central book at all.
- Market-maker activity is a separate thing entirely. Market makers quote two-sided prices and manage inventory. That’s a business model, not a targeting operation aimed at your 20-pip stop.
The honest framing: sell-side liquidity is a probabilistic inference. You’re reasoning about where a crowd of traders most likely placed their protective orders, because technical analysis pushes people toward the same obvious spots.
Where It Sits on the Chart
Liquidity accumulates below levels that look technically meaningful to a large number of participants.
That’s the entire mechanism.
Not coordination, just convergence.
- Swing lows. A pivot low with higher lows on either side. Longs place stops beneath it because a break invalidates their structural read.
- Equal lows (double or triple bottoms). Two or more lows at nearly the same price. This is the densest form of a liquidity pool, because every trader who bought the first low and every trader who bought the second is stacking protection in the same few ticks.
- Previous day low. A reference point used by intraday traders across every asset class. It shows up on institutional dashboards and retail platforms alike.
- Previous week low and previous month low. Slower, heavier pools. Fewer traders reference them intraday, but the ones who do are typically running larger positions.
- Session lows. Asian session lows in particular, because the range is tight and the low is unambiguous. London opens and immediately has a target.
- Trendline and range lows. Any level where a chart pattern breaks is a place stops get parked.
Nobody is targeting your specific order.
The market is simply moving toward the price where the most resting orders would be activated, and that’s just a place where transactions happen easily.
Buy-Side vs Sell-Side Liquidity
The two are mirror images, and confusing them is the fastest way to trade backwards.
- Buy-side liquidity sits above highs. It’s made up of buy-stop orders: stop losses from short sellers, plus breakout buy orders from traders waiting for a high to break.
- Sell-side liquidity sits below lows. Sell-stop orders: stop losses from long holders, plus breakdown sell orders from traders shorting a break of support.
- Price moves toward liquidity, not away from it. A market drifting up is moving toward buy-side. A market drifting down is moving toward sell-side.
- Neither is bullish or bearish on its own. Taking sell-side liquidity can precede a violent reversal higher or a continuation straight down. The sweep tells you an event happened. It does not tell you the direction of the next hundred pips.
That last point gets ignored constantly.
Traders see “sell-side liquidity taken” and mentally translate it to “buy now.”
The market does not owe you that translation.
Ranking Liquidity Pools
Not all pools deserve the same attention. Ranking them is the difference between having three good levels on your chart and having twenty meaningless ones.
- Equal lows outrank a single weak low. Two or three lows at the same price concentrate stops in a narrow band. One low that formed during a fast impulse move has far fewer orders behind it.
- External range liquidity outranks internal range liquidity. External range liquidity sits at the boundaries of the established dealing range, the old swing highs and lows. Internal range liquidity sits inside it: minor lows, fair value gaps, order blocks. External pools tend to be the destination; internal pools tend to be waypoints.
- Higher-timeframe lows outrank lower-timeframe lows. A daily swing low has accumulated orders across days or weeks. A 5-minute low has accumulated them across twenty minutes. Weight accordingly.
- Untested pools outrank already-swept pools. Once a low has been taken and price has moved on, the stops behind it are gone. Refilling takes time.
- Age adds weight, up to a point. A three-week-old equal low that price keeps respecting has built up meaningful resting interest. A six-month-old low in a market that’s trended 20% away is mostly noise.
A practical rule: if you can’t explain in one sentence why a level would hold orders, remove it from the chart.
What a Liquidity Sweep Actually Is
Here’s the part most explanations skip.
When a stop-loss order triggers, it doesn’t politely find a matching buyer at your price. In most retail setups, a triggered stop becomes a market order, and a market order takes whatever the book offers.
What Happens When Stops Trigger
Picture a hundred long positions with stops clustered within three ticks of an equal low.
Price ticks into that band.
All hundred stops fire at once as market sell orders.
Three things follow.
First, a short burst of genuine selling pressure that has nothing to do with anyone’s opinion on value. Second, slippage, because the available bids get consumed faster than new ones arrive. Third, and this is the interesting part, a pocket of ready buyers who wanted size at a discount now gets filled without having to chase.
That’s the market order conversion mechanism in plain terms. It explains the characteristic shape of a sweep: a fast spike down, thin bodies, and an equally fast recovery once the forced selling exhausts itself.
A sweep is not the market rejecting a price. It’s the market briefly running out of the thing it was selling into.
Cascading execution can extend the move.
One cluster of stops triggers, price drops into a second cluster, that fires too. This is how a “five-pip stop hunt” occasionally turns into a forty-pip flush.
The order flow feeds itself until the resting bids underneath absorb it.
Sweep, Stop Hunt, or Breakdown?
Three terms, constantly used interchangeably, describing three different things.
A liquidity sweep is an observable price event: price trades below a defined low, fails to hold there, and reclaims the level.
You can point to it on a chart. You can define it with rules.
It either happened or it didn’t.
A stop run or stop hunt is a narrative about why the sweep happened. It claims the move was deliberately engineered by a large participant to trigger retail orders.
This is unverifiable from a price chart.
Large orders do get worked into liquid areas because that’s where they can be filled, but that’s execution logic, not targeting.
A genuine breakdown is the third possibility, and the one that costs money when it’s misread. Price trades below the low, keeps trading below it, and closes candles there.
Sellers are no longer just triggering stops.
They’re setting a new value area.
The uncomfortable truth: at the moment of the wick, all three look identical. The difference only appears in what happens next.
Rejection vs Acceptance
Distinguishing rejection from market acceptance is the single most useful skill in this whole framework, and it comes down to three measurable things.
Closes. Did the candle close back above the swept low? A rejection wick with a close inside the old range is a completely different message from a body that closes below it.
Bodies matter more than wicks.
Always.
Time. How long did price spend below the level?
Thirty seconds is a sweep. Forty minutes of consolidation below is acceptance.
Time below a level is the market’s way of saying it’s comfortable there.
Follow-through. Do the next two or three candles hold below, or does price immediately reclaim and push away?
A reclaim that stalls right at the level is weaker than one that displaces through it.
And here’s the caveat worth repeating: price can reach an obvious low through nothing more exotic than ordinary order flow, a data release, or the volatility spike that comes with a session open.
No coordination needed.
A CPI print at 8:30 that takes out the previous day low is not a stop hunt. It’s a news reaction that happened to pass through a level.
Confirming a Setup Instead of Guessing
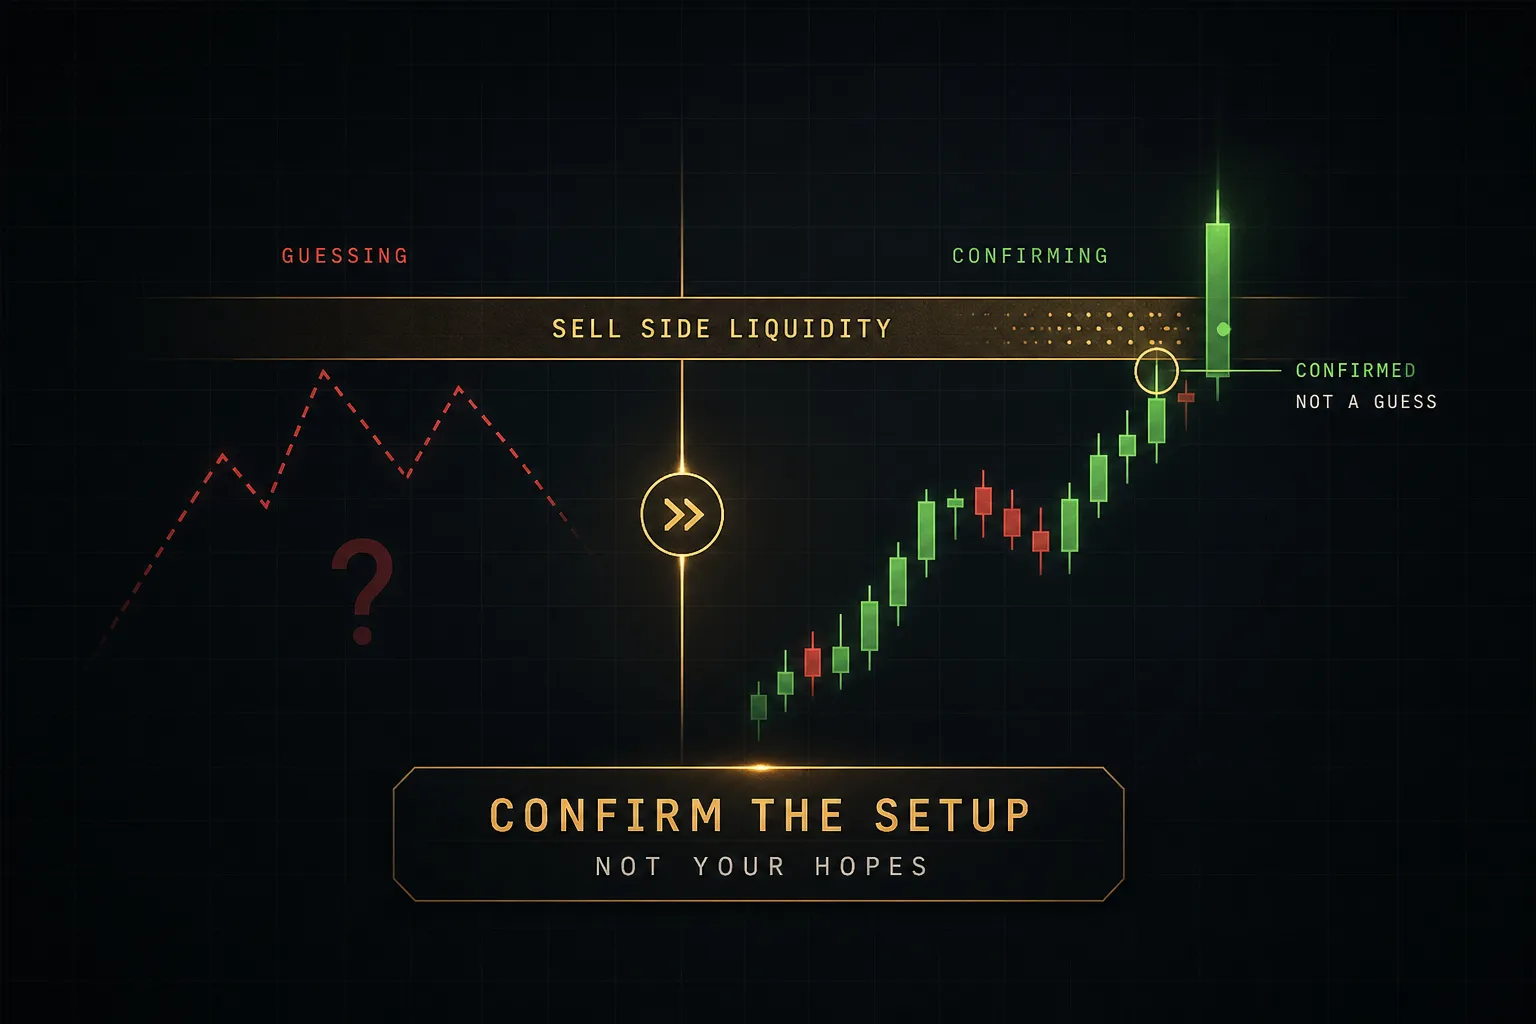
A sweep is a question.
Confirmation is the answer.
Trading the question is how accounts get drained.
Mark Liquidity Top-Down
Start on the daily chart.
Mark the previous day low, the previous week low, and any obvious equal lows or major swing lows within reach of current price.
Keep it to four or five levels.
Drop to the 4-hour.
Refine those levels and identify whether they represent external range liquidity (range boundaries) or internal range liquidity (minor structure inside the range).
Note where the premium and discount midpoint of the current dealing range sits, because a sweep in deep discount carries different implications than one in premium.
Only then move to the 15-minute and 5-minute charts.
This is where you watch the actual reaction: how price approaches the level, how fast it moves through, and whether it reclaims.
The higher timeframes tell you where. The lower timeframes tell you whether.
Do not skip the top-down step and hunt for sweeps on a 1-minute chart. Every 1-minute chart has a sweep every twenty minutes.
That’s not analysis, that’s pattern-matching noise.
Look for Displacement and Structure Shift
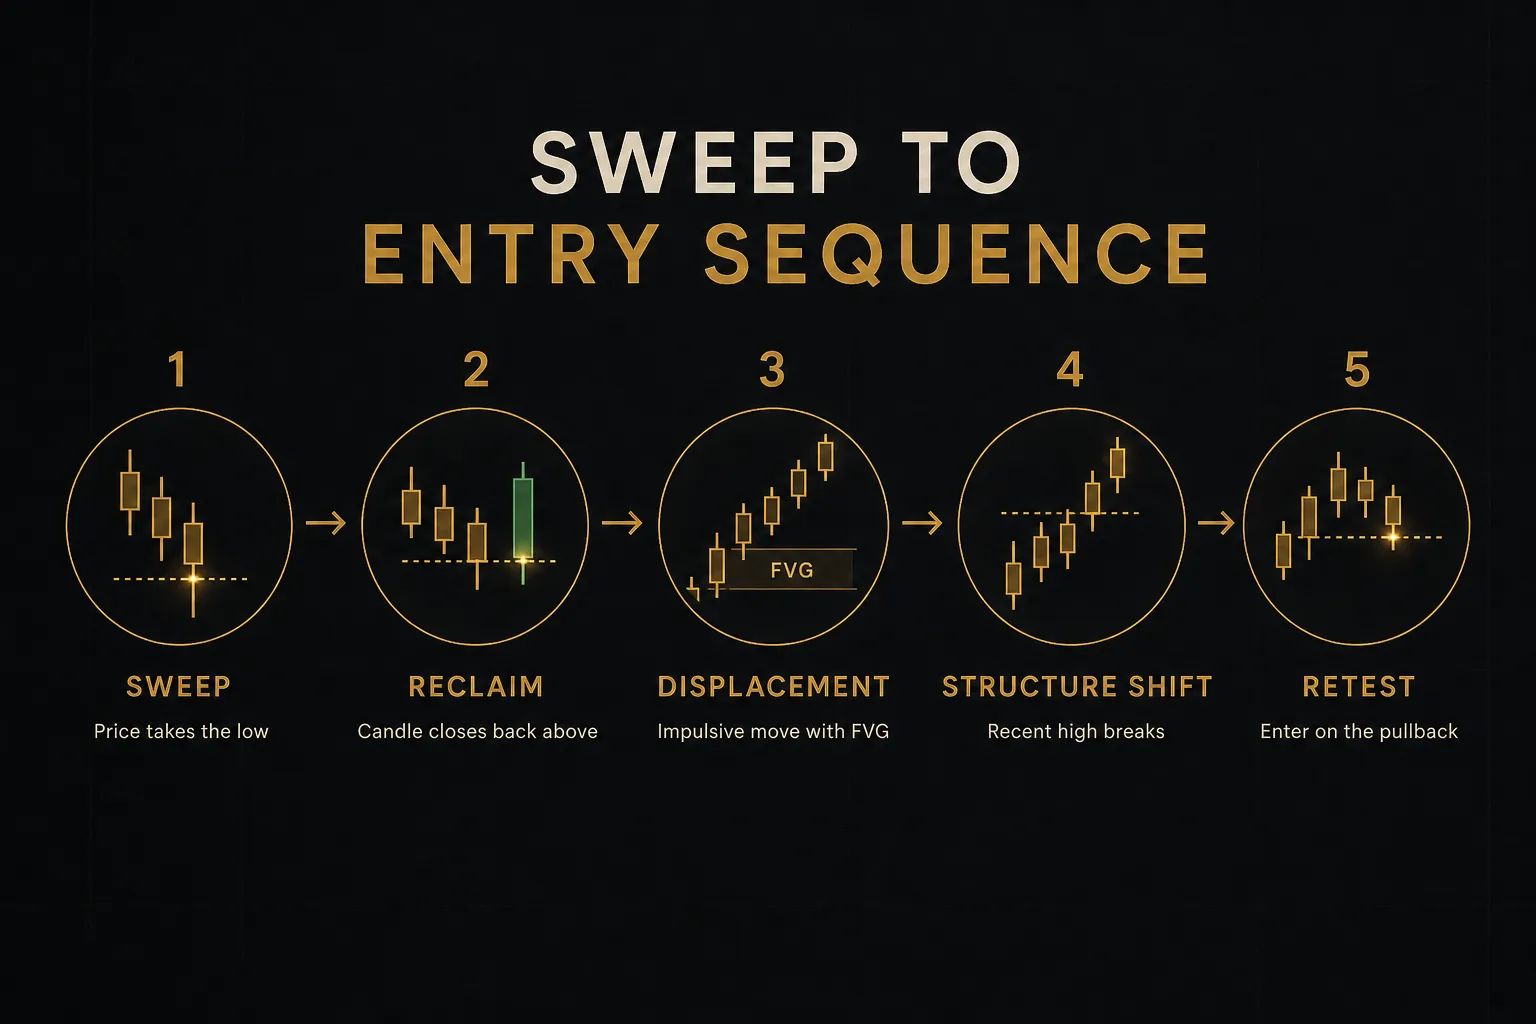
Three things need to happen after the sweep before a long setup becomes credible.
Displacement. An aggressive, impulsive move away from the swept level. Large-bodied candles, minimal overlap, usually leaving a fair value gap behind.
Displacement is the footprint of real buying pressure absorbing the stop cascade.
Slow, overlapping candles crawling back above the level are not displacement.
Market structure shift. On your entry timeframe, price needs to break the most recent short-term high that formed during the decline.
That break of structure is the objective evidence that the sequence of lower highs has ended.
Without it, you’re buying into a downtrend and calling it a reversal.
A retest. Most workable entries come on a pullback into the fair value gap left by the displacement, into an order block at the origin of the move, or back to the reclaimed level itself.
Entering on the retest gives you a tighter stop and a materially better risk-to-reward ratio than chasing the impulse.
Context sits on top of all three.
What’s the higher-timeframe bias? Is the sweep happening in discount or premium?
Which session is it, and is this the London or New York window where displacement actually tends to follow through? Is there high-impact news in the next thirty minutes?
And critically, where’s the nearest opposing buy-side liquidity that could cap the move before your target?
A sweep with a daily bearish bias, in premium, during the Asian session, with a wall of buy-side liquidity forty pips above is a very different proposition from the same pattern in discount during New York open.
Using PipTrend to Filter the Signal
The weakness of pure Smart Money Concepts analysis is that it depends heavily on discretionary reading.
Two traders look at the same wick and see opposite things.
Tooling helps by making some of the confirmation objective.
PipTrend does not detect sweeps and does not claim to.
What it does is answer the follow-up questions with measurable output. Its color-coded trend candles and whipsaw filter show whether momentum genuinely shifted after the sweep or whether price is just chopping around the level, which is exactly the failure mode that turns a promising reclaim into a second stop-out.
The multi-timeframe table checks alignment across 12 timeframes before you commit.
If your 5-minute reclaim is fighting bearish readings on the 1-hour and 4-hour, that’s a documented conflict rather than a gut feeling.
Session high and low markers, VWAP, and fair value gap levels mark the prices where a reaction would actually carry weight.
The point is discipline, not prediction.
You keep the liquidity concept for locating the level, then replace “I think smart money is accumulating here” with “momentum flipped on three of my four reference timeframes and price is holding above VWAP.”
Stop Placement and Common False Signals
Why Obvious Stops Get Vulnerable
A stop placed one pip below an equal low is not protecting you from anything. It’s sitting in the densest part of the pool, exposed to ordinary intraday volatility that has nothing to do with your thesis being wrong.
The reflexive fix is to move the stop further away. That helps with the stop-out and hurts everything else, because a wider stop with the same lot size means more risk per trade.
You haven’t solved the problem, you’ve relocated it to your account balance.
The actual fix is structural.
Place the stop beyond a point where the trade idea is genuinely invalid, typically below the low of the sweep candle plus a volatility buffer such as one ATR fraction, then reduce position size so the dollar risk stays constant.
Same risk, better placement.
False Positives Traders Miss
Plenty of things look like sweeps and aren’t.
Lows that aren’t real pivots. Two lows that appear equal on a compressed chart may be eight pips apart when you zoom in.
Check the actual prices before treating them as a pool.
Thin-volume periods. Late Friday, holiday sessions, and the Asian lunch hour produce wicks that mean very little.
A five-pip poke through a low on almost no participation is not information.
Spread expansion. Around session rollovers and news releases, spreads widen.
Your stop can trigger on the ask while the bid never reached the level, which makes it look like your platform hunted you personally.
It didn’t.
The spread did.
Broker feed differences. In forex and CFDs there is no consolidated tape.
Broker A’s low might be 1.0842 and Broker B’s 1.0839.
A “clean sweep” on one chart genuinely does not exist on another.
This alone should temper any confidence about precise sweep levels in OTC markets.
Market structure differences matter too.
Centralized futures markets give you a visible order book, real volume, and delta, so you can see whether a low was defended with actual size.
Spot forex gives you tick volume at best. Crypto is fragmented across venues with different depth, meaning a sweep on one exchange can be a non-event on another.

The risk framework that holds all of this together is unglamorous.
Define invalidation before entry as a specific event, usually a candle close beyond a structural point, not a vague feeling that the trade isn’t working.
Size the position to that distance.
And after a failed sweep, resist re-entering three more times at the same level.
Repeated re-entry after failure is revenge trading with technical vocabulary attached.
Frequently Asked Questions
What is an example of sell-side liquidity?
A textbook example is a pair of equal lows on the 4-hour chart at 1.0850. Traders who bought both bounces placed protective stops just under that price, and breakout sellers placed sell-stop entries there too.
That narrow band beneath 1.0850 is the sell-side liquidity pool.
The previous day low and the Asian session low are the two most commonly referenced intraday versions.
What happens when sell-side liquidity is taken?
Resting sell-stop orders convert to market sell orders, producing a short burst of selling pressure, possible slippage, and sometimes a cascade into the next cluster below. After that, one of two things happens: price reclaims the level and closes back inside the range (rejection), or it keeps trading and closing below (acceptance, meaning a genuine breakdown).
The trigger event itself does not decide which.
Is sell-side liquidity below or above price?
Sell-side liquidity sits below current price, beneath swing lows, equal lows, and prior session or daily lows. Buy-side liquidity sits above price, above swing highs and equal highs.
The naming refers to the order type resting there, sell stops below and buy stops above, not to the direction you should trade.
What is the difference between buy-side and sell-side liquidity?
Buy-side liquidity is made of buy-stop orders above highs: short sellers’ stop losses plus breakout buy entries. Sell-side liquidity is made of sell-stop orders below lows: long holders’ stop losses plus breakdown sell entries.
They’re structural mirrors, and neither one is inherently bullish or bearish.
Price frequently sweeps one pool and then travels to the opposite one.
How do you identify a liquidity sweep?
Look for price trading below a clearly defined low, then closing back above it within one to three candles, ideally with a long rejection wick and little time spent below the level.
Confirm on the entry timeframe that the reclaim is followed by displacement and a market structure shift.
If price closes below and consolidates there instead, it’s a breakdown, not a sweep.
Does liquidity always get swept before a market reversal?
No.
Many reversals begin from a higher low that never touches the prior low, and plenty of clean sweeps continue straight down after briefly reclaiming.
The sweep is a location marker, not a signal.
What actually separates the tradeable cases from the traps is the confirmation that follows: displacement, a break of structure, and alignment with higher-timeframe bias.
Treat the Sweep as a Question, Not an Answer
Sell-side liquidity tells you where a reaction is possible.
That’s the entire claim.
Anything beyond that is narrative you’ve added yourself.
The decision rule is simple enough to write on a sticky note.
If price sweeps a low and shows no displacement, no structure shift, and no timeframe alignment, stand aside and let it go.
If it sweeps, reclaims with an impulsive move, breaks the recent short-term high, and lines up with your higher-timeframe bias and session context, the setup is worth structured consideration with a defined invalidation and sized risk.
One is a story.
The other is a plan.
Here’s what to do tonight.
Open your main pair, mark the nearest untested equal low or swing low on the 4-hour chart, and do nothing else.
Watch how price behaves when it eventually gets there. Note the closes, the time spent below, whether displacement follows.
Do that ten times before you trade it once. The pattern will teach you more than any explanation of it can.
Sources
Risk Disclaimer: Trading involves risk. Past performance doesn't guarantee future results. Only trade with money you can afford to lose. PipTrend is a tool to assist your trading decisions, not financial advice.