DMI Indicator ADX: A Trader's Guide to Trend Strength
On this page
Why Traders Misread DMI and ADX
Here’s the mistake that costs traders money every single day: they see ADX cross above 25, assume it’s a green light, and buy.
Then price rolls over.
ADX never told them to buy.
It told them the existing move had conviction. Direction was never part of the message.
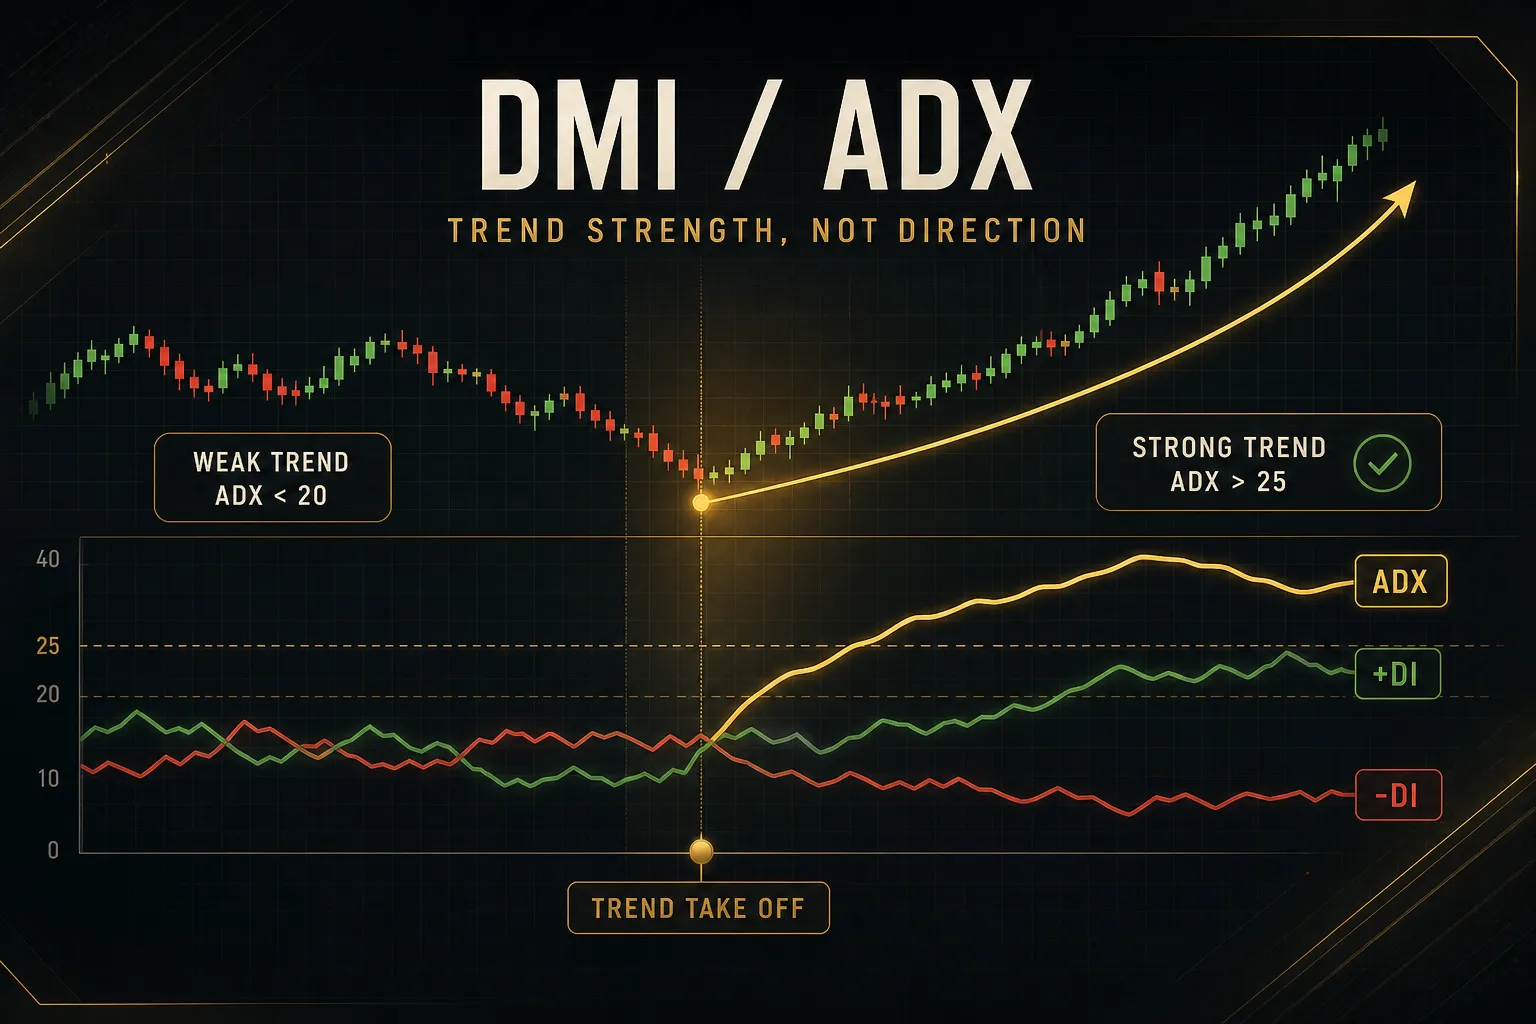
The Average Directional Index (ADX) is a non-directional measure of trend strength. It reads the same whether price is screaming higher or collapsing lower.
That single property makes it powerful as a filter and useless as a standalone entry trigger.
Direction lives elsewhere in the system.
The positive directional indicator (+DI) and negative directional indicator (-DI) handle that job, and they are part of the same parent framework: the Directional Movement Index (DMI).
ADX supplies conviction. The DI lines supply direction. Price structure supplies context. Remove any one of the three and the reading falls apart.
This guide takes a rules-based approach. Not a prediction engine, not a secret setting, but a repeatable way to read what the indicator actually reports and a confirmation workflow you can apply to any chart.
The framework travels well across asset classes. Forex, indices, individual equities, and crypto all respond to the same math, but each carries its own volatility profile, and that changes what “strong” looks like on the ADX line.
A 24/7 crypto market can print ADX readings that would be exceptional on a large-cap equity chart.
Session-driven forex pairs behave differently again. We will get into those nuances, because copying thresholds across markets without recalibration is another quiet source of losses.
By the end, you should be able to look at a chart and answer three questions in about five seconds: is there a trend, which way does it point, and does structure agree?
What DMI and ADX Actually Measure
Ask ten traders whether they use DMI or ADX and most will pick one.
That question does not quite make sense.
The Directional Movement Index is the whole system. J. Welles Wilder Jr. introduced it in his 1978 book New Concepts in Technical Trading Systems, and it ships with three plotted lines: +DI, -DI, and ADX.
They are components of one framework, not competitors.
Think of it like a car dashboard.
The DI lines are the steering wheel angle.
ADX is the tachometer. Neither tells you where you are going on its own.
What +DI and -DI Reveal
Both DI lines come from a simple comparison: how far did today’s high push above yesterday’s high, and how far did today’s low push below yesterday’s low?
If the upward move is larger, that period records positive directional movement. If the downward move is larger, it records negative directional movement.
Only one can register per period, and if neither expansion is larger, the period records zero.
A rising +DI means buyers are consistently extending the range upward. A rising -DI means sellers are consistently extending it downward.
The absolute values matter less than the relationship. +DI at 30 with -DI at 12 describes clear buyer dominance.
+DI at 30 with -DI at 28 describes a fight with no winner, regardless of how respectable that 30 looks in isolation.
What ADX Actually Measures
ADX starts with the spread between the two DI lines. The DX calculation takes the absolute difference between +DI and -DI, divides it by their sum, and multiplies by 100.
That produces a raw dominance score.
Wide separation between the lines yields a high DX. Lines tangled together yield a low DX regardless of which one sits on top.
ADX is then a smoothed average of DX.
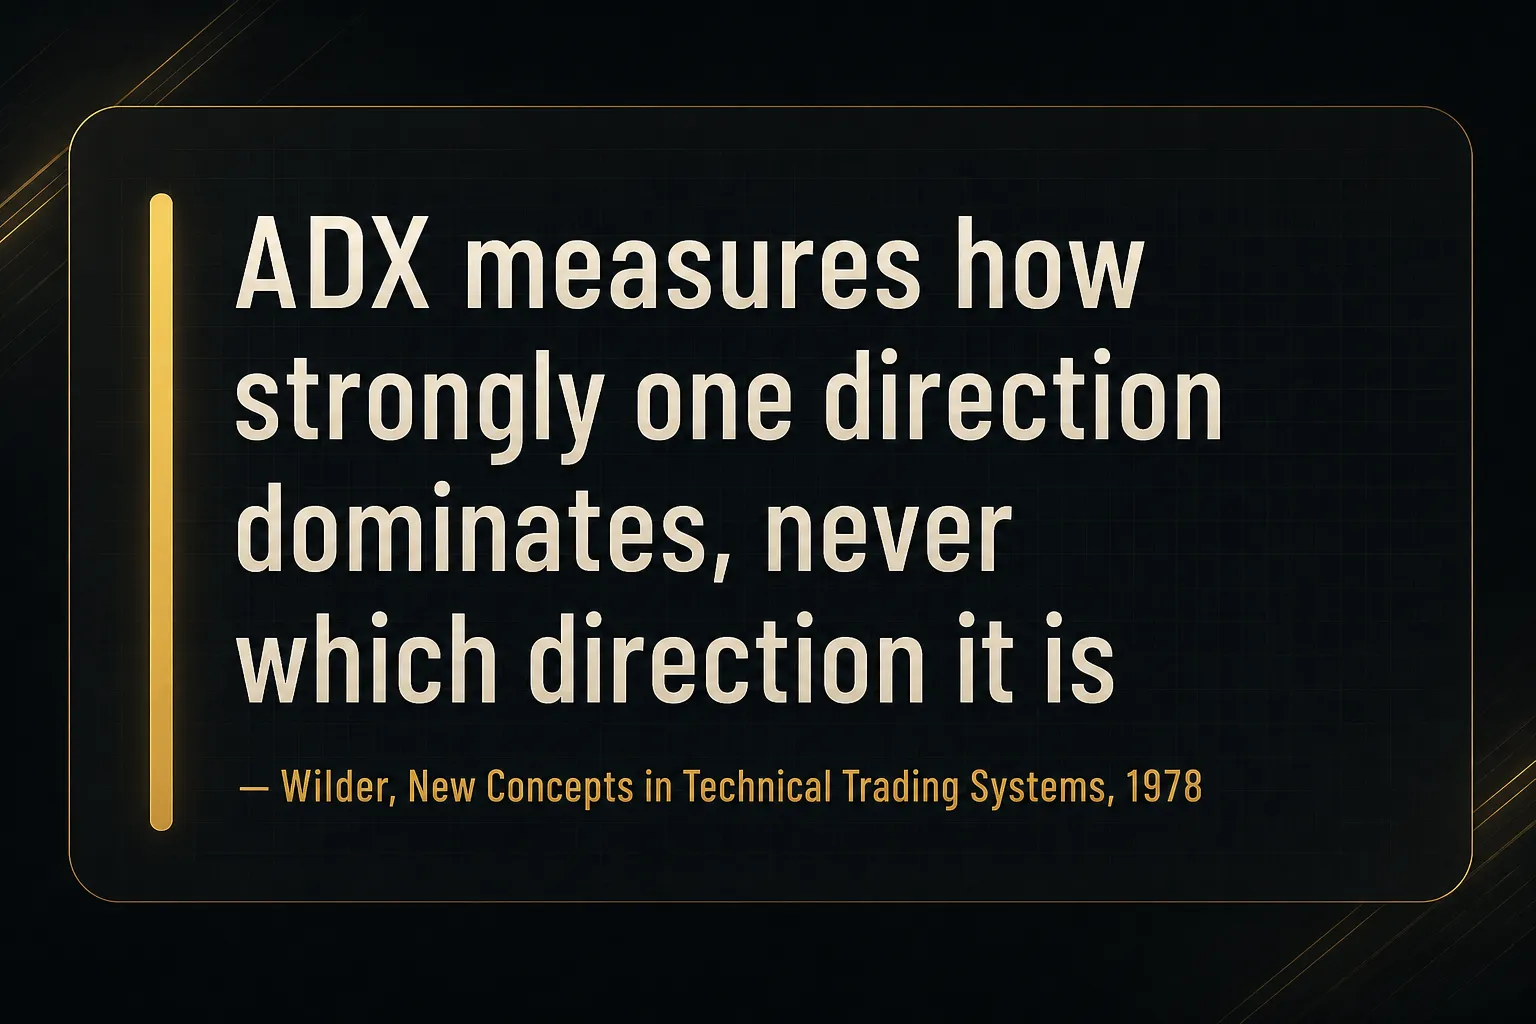
Because the absolute difference strips out the sign, ADX cannot tell you direction. It can only tell you how decisively one side is winning.
There is also ADXR, the Average Directional Index Rating, which averages today’s ADX with the ADX from a set number of periods ago. Wilder used it to grade which markets were worth trading at all.
Most modern platforms include it, and most traders ignore it.
The Logic Behind True Range and Wilder Smoothing
Raw directional movement is measured in price units, which makes a 40-point move in an index look enormous next to a 40-pip move in EURUSD. Wilder normalised this using true range.
True range is the largest of three values: current high minus current low, current high minus previous close, or current low minus previous close. Including the previous close captures gaps, which matters enormously for equities and index futures.
Dividing directional movement by true range converts everything into a percentage of typical volatility. That is why DI values are comparable across a currency pair, a stock, and a Bitcoin chart.
Wilder smoothing then handles the averaging. It is a modified exponential average that weights the prior value heavily and adds a fraction of the new one, which produces a smoother line than a simple moving average but reacts more slowly than a standard EMA.
That slowness is the trade-off. ADX passes through smoothing twice, once in the DI lines and once more from DX to ADX.
Double smoothing is exactly why ADX confirms trends beautifully and predicts them terribly.
Reading ADX Levels and DI Crossovers
Every chart platform draws that horizontal line at 20 or 25 and traders treat it like a law of physics. It is a convention from 1978, tested on commodity futures, with a hand calculator.
ADX Thresholds Are Conventions, Not Rules
The commonly cited scale reads roughly like this: below 20 signals an absent or weak trend, 20 to 25 marks a transition zone, 25 to 50 indicates a strong trend, 50 to 75 an very strong one, and above 75 an extreme move.
Useful as a starting map. Dangerous as a fixed rule.
A 4-hour Bitcoin chart may spend large stretches above 30 simply because crypto volatility inflates directional expansion. A 15-minute chart on a quiet major pair during the Asian session may never touch 25 all night, even while a perfectly tradeable drift is underway.
The fix is empirical.
Pull up 12 months of data on the instrument and timeframe you actually trade, and look at where ADX typically sits. If the median reading is 28, then 25 is not a meaningful filter for you.
Calibrate to your own chart.
High ADX vs Rising ADX
This distinction separates traders who use ADX well from those who get chopped up by it.
A rising ADX means the spread between the DI lines is widening.
Dominance is increasing.
Momentum is building, and that is the condition trend-following entries want.
A high ADX means dominance is already substantial.
It says nothing about what happens next.
ADX at 45 might mean the trend has another 200 pips in it, or it might mean the move is mature and about to exhaust.
When ADX peaks at a high level and starts falling, most traders read reversal.
Wrong more often than not.
A falling ADX from a high level typically signals that the DI lines are converging, which usually resolves into consolidation, not a flip.
Price can keep grinding in the trend direction while ADX falls. It just does so with less conviction and more overlap between candles.
Treating that as a short signal in an uptrend is how traders end up fighting a market that never actually turned.
What a DI Crossover Really Signals
+DI crossing above -DI is the classic bullish directional movement cue. -DI crossing above +DI is the bearish equivalent.
Simple enough.
The problem is frequency.
In a range-bound market, the DI lines cross constantly, because price is doing exactly what the math describes: expanding upward, then downward, then upward again with no side winning.
Each of those crossings is technically a valid signal by the raw rule.
Almost all of them are noise.
This is the crossover whipsaw problem, and it is the single largest source of losses for traders who use DMI without a filter.
A crossover with ADX below 20 and flat has a dramatically higher failure rate than the same crossover with ADX at 22 and rising. Same signal, different regime, completely different expectancy.
Which brings us to the workflow.
A Complete Chart-Reading Workflow
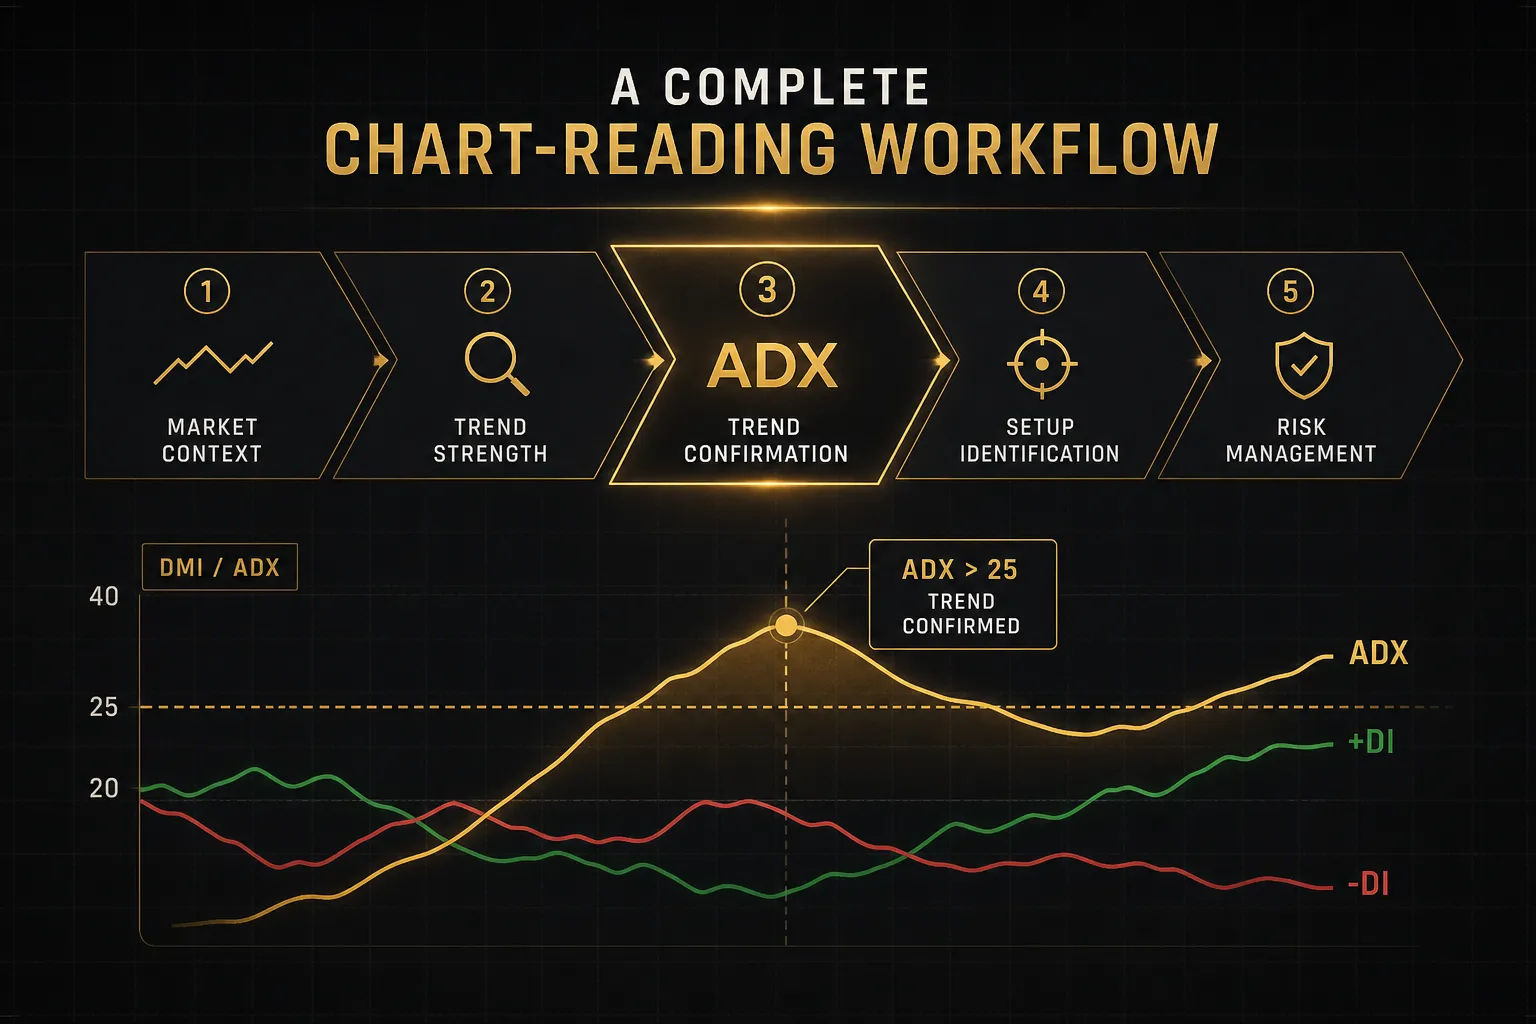
Reading DMI properly is a sequence, not a glance. Each step either confirms or kills the setup, and the order matters because early steps are cheaper to check than later ones.
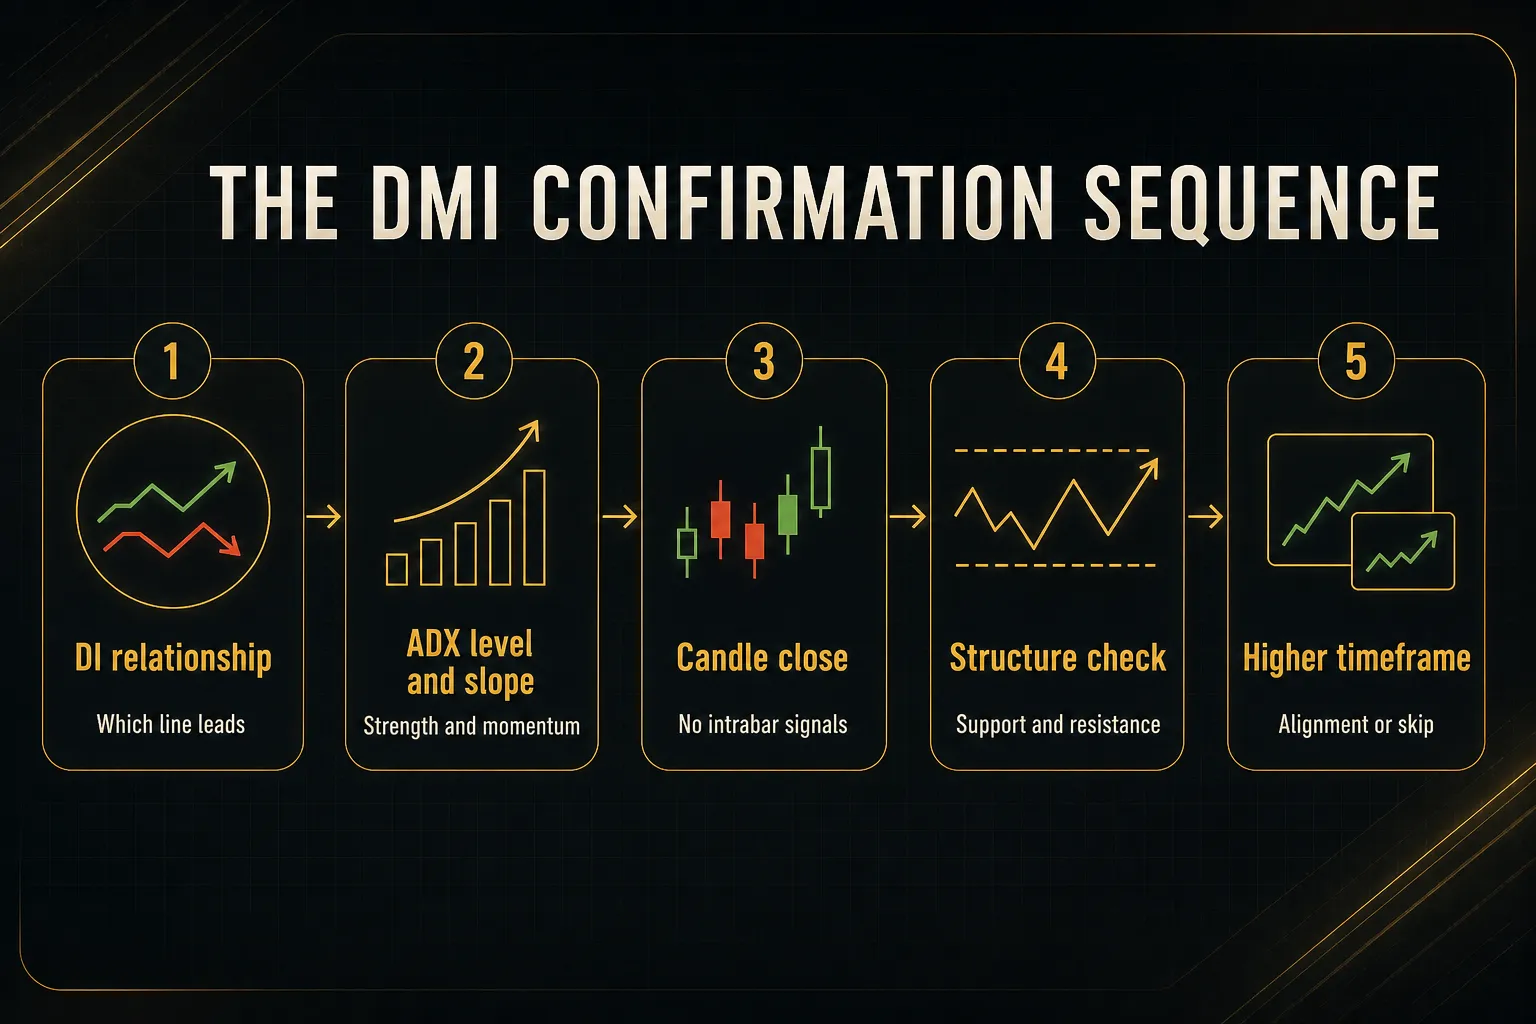
A Confirmation Checklist
- Identify the DI relationship. Determine which line is on top and whether a crossover has occurred within the last few candles. +DI above -DI points bullish; -DI above +DI points bearish. If the lines are overlapping and whipping, stop here.
- Check ADX level and slope together. You want ADX above your calibrated threshold or clearly rising toward it. A flat ADX at 16 kills the setup no matter how clean the crossover looks.
- Wait for candle close confirmation. Intrabar DI crossovers repaint constantly because the calculation updates with every tick. A crossover that exists at 14:23 may not exist at the close. Only act on closed-candle readings.
- Locate price against structure. Mark the nearest significant support and resistance before deciding anything. A bullish signal directly beneath a weekly resistance level has poor risk-reward even if the indicator reading is textbook.
- Confirm higher-timeframe alignment. Check the DI relationship one or two timeframes up. A 15-minute bullish crossover inside a 4-hour downtrend is a countertrend trade, and it should be sized accordingly or skipped entirely.
- Define the invalidation point before entry. Place the stop where the setup’s logic fails, typically beyond the swing point that the directional move originated from. If that stop distance makes the risk-reward unacceptable, the setup does not qualify.
- Decide the exit rule in advance. Common approaches include exiting on the opposite DI crossover, on ADX turning down from above 40, or at a structural target. Pick one and apply it consistently.
Why Low-ADX Ranges Cause Whipsaws
Picture a market pinned between a support floor and a resistance ceiling 60 pips apart. Price bounces between them for two days.
Every push toward the ceiling expands the high, so +DI climbs and -DI falls. Every rejection expands the low, so the reverse happens.
The DI lines cross four, five, six times in that window.
Meanwhile ADX sits at 14, because the DX calculation keeps reporting that neither side dominates.
The indicator is doing its job perfectly.
It is telling you not to trade directionally.
That is the core value of ADX as a market regime filter: it separates conditions where a trend-following strategy has an edge from conditions where it bleeds out through repeated small losses.
The practical rule is blunt.
When ADX is below your threshold and flat, ignore DI crossovers entirely. Either stand aside or switch to a range-appropriate approach with completely different logic.
Layering Structure and Multi-Timeframe Confluence
Adding a moving average as a trend filter resolves a surprising number of conflicting signals. A common configuration uses a 50-period MA: take bullish DI signals only when price trades above it, bearish signals only below.
Consider a real conflict.
+DI sits comfortably above -DI, ADX reads 27 and rising, everything looks green. But price is two points below a horizontal level that has rejected four times in six weeks.
The indicator is accurate.
The location is terrible.
Structure overrules the reading, and the correct action is to wait for a close above that level before committing.
Multi-timeframe confluence handles the same problem from a different angle. When directional strength points the same way on the 15-minute, 1-hour, and 4-hour charts simultaneously, the probability profile improves meaningfully compared to a single-timeframe signal.
Checking that manually across a watchlist is tedious, which is why tools like PipTrend compress it into a multi-timeframe confirmation table with colour-coded trend candles across 12 timeframes. The value is speed of assessment: you see at a glance whether directional strength is aligned or fragmented.
No such table is a guaranteed signal.
It is a confluence view that reduces the time between question and answer, and the confirmation checklist above still applies in full.
Settings, Markets, and Backtesting
The 14-period default is not magic.
Wilder chose it because roughly half a lunar month suited the commodity cycles he traded, and hand-calculating anything longer was painful.
It remains the sensible educational baseline. Everyone else uses it, so signals cluster around it, and that self-fulfilling quality has real value.
But it is a starting point, not a destination.
Choosing a Period by Trading Style
Period selection is a trade-off between responsiveness and reliability.
Shorter periods react faster and produce more false signals. Longer periods filter noise and arrive late.
- Scalpers and intraday traders (7 to 10 periods): Faster DI reactions catch shorter momentum bursts on 1-minute to 15-minute charts. Expect noticeably more crossover whipsaw and plan a tighter filter, such as requiring ADX to be rising for at least three consecutive closes.
- Day traders (12 to 14 periods): The standard setting works well on 15-minute to 1-hour charts, where it balances session-level moves against intrabar noise. Most published research on DMI behaviour uses this range, so comparisons are easier.
- Swing traders (14 to 21 periods): Longer smoothing suits 4-hour and daily charts where holding periods run several days. Signals arrive later but survive the ordinary pullbacks that would shake out a shorter setting.
- Position traders (21 to 30 periods): On weekly charts, heavy smoothing isolates multi-month regime changes. ADX moves slowly here, and a shift from 18 to 26 over several weeks carries real information.
- Threshold adjustment travels with the period: Shorter periods produce more volatile ADX readings, so a scalper may need a 30 threshold where a swing trader uses 22. Test the threshold and the period together, never separately.
Forex vs Indices vs Crypto Differences
The same settings behave very differently depending on what you point them at.
| Market | Volatility Character | ADX Behaviour | Practical Adjustment |
|---|---|---|---|
| Forex majors | Session-driven; London and New York overlap dominates | ADX often decays overnight then builds on session open | Filter signals by session; ignore low-ADX Asian-session crossovers |
| Index futures and ETFs | Gap risk at cash open; news-sensitive | Sharp ADX spikes around economic releases and earnings season | Require two closes above threshold to avoid single-event spikes |
| Individual equities | Earnings gaps, sector rotation, liquidity varies | True range inflates on gaps, temporarily suppressing DI values | Avoid signals within two sessions of scheduled earnings |
| Crypto majors | 24/7 trading; no session structure | Baseline ADX runs structurally higher than in FX | Raise the strong-trend threshold to roughly 30 to 35 |
| Commodities | Supply shocks, seasonal patterns, contract rolls | Extended high-ADX runs during supply-driven trends | Standard 14/25 works reasonably; watch roll dates for distortion |
Building a Reproducible Backtest
Testing a setting properly is not “scroll back and see if it looked good.”
That is confirmation bias with a chart attached.
- Write the rules before you run anything. Specify the exact crossover condition, the ADX level and slope requirement, the confirmation candle rule, and the timeframe. If a rule requires judgement to apply, it is not testable.
- Define stops and exits with equal precision. Fixed ATR multiple, structural swing point, opposite crossover, or time-based exit. Ambiguous exits are the most common reason backtest results fail to reproduce in live trading.
- Model costs honestly. Include spread, commission, and a realistic slippage assumption. Strategies that generate many signals on short timeframes often look profitable gross and lose money net.
- Set a minimum sample size. Aim for at least 100 trades, and ideally 200 or more, spanning trending and ranging conditions. Thirty trades tells you almost nothing about a strategy with 45% win rate variance.
- Reserve out-of-sample data. Optimise on roughly 70% of your history, then validate on the untouched 30%. A large gap between in-sample and out-of-sample performance means you fitted noise.
- Forward test before committing capital. Run the rules on a demo or small live account for one to three months. Live execution reveals slippage, fill quality, and behavioural problems no backtest captures.
- Refuse to curve-fit. If period 13 works brilliantly and periods 12 and 14 fail, that is not an edge. Robust parameters show gradual performance changes across neighbouring values, not cliffs.
Common Questions About DMI and ADX
What is the difference between DMI and ADX?
ADX is a component of DMI, not a separate indicator. The Directional Movement Index is the full system comprising +DI, -DI, and ADX.
The DI lines report direction by comparing current and prior highs and lows. ADX is derived from the spread between them via the DX calculation, then smoothed again, and reports strength only.
What is the best setting for the DMI ADX indicator?
There is no universally best setting, but 14 periods remains the standard baseline and the right place to start. Wilder’s original choice is still the most widely used, which means signals cluster around it.
Day traders often shorten to 7 to 10 for faster response, while swing and position traders extend to 14 to 21 for stability. Any deviation should come from your own testing on your own instrument, not from copying someone else’s screenshot.
What does it mean when +DI crosses above -DI?
It means upward directional movement has become the dominant force over the lookback period. Buyers are extending highs more than sellers are extending lows.
That is a directional cue, not a trade signal.
Without ADX above your calibrated threshold or clearly rising, and without supportive price structure, the crossover carries a substantially higher failure rate, particularly inside a range-bound market.
Is ADX above 25 a buy signal?
No.
ADX is non-directional by construction, so a reading of 25 is equally consistent with a powerful downtrend.
Reading 25 as bullish is the most common misuse of the indicator. Direction must come from the DI lines, and even then, ADX at 25 and falling describes a different situation than ADX at 25 and rising.
The slope matters as much as the level.
Can ADX predict trend reversals?
No, ADX is a lagging confirmation tool and cannot predict reversals. Its double smoothing, once in the DI calculation and again from DX to ADX, guarantees it reports on established conditions rather than emerging ones.
A falling ADX after a high peak most often precedes consolidation, where the DI lines converge and price chops sideways. Reversal detection requires price structure, divergence analysis, or other tools entirely.
How accurate is the DMI ADX indicator?
Accuracy depends entirely on regime, and no honest figure exists outside a specific tested ruleset. DMI performs well as a regime filter in trending conditions and poorly as a signal generator in ranges.
Used properly, its function is to reduce trades taken in unfavourable conditions rather than to raise raw win rate. Traders who apply the ADX filter typically take fewer trades with better average outcomes, which is the realistic benefit.
The Bottom Line on Trend Strength
Strip everything back and the decision rule is short.
If ADX is low and flat, treat DI crossovers as noise. They will occur repeatedly, they will look convincing, and they will mostly fail.
Stand aside or trade a range approach with different logic.
If ADX is rising, the DI lines are separating in the direction you want, and price structure supports the move, then you have a legitimate trend-confirmation signal worth risk-managing. Enter on a closed candle, place the stop where the idea is proven wrong, and size the position before you click.
Everything else is refinement.
Period selection, threshold calibration, multi-timeframe confluence… useful, but secondary to getting that one distinction right.
DMI and ADX form a regime filter.
They tell you whether the market environment suits trend-following at all, which is genuinely valuable information and not the same thing as a strategy.
A complete plan still needs entry rules, defined stops, position sizing, exit criteria, and a record of results you actually review.
The indicator narrows the field.
You still have to trade it.
Sources
- Wikipedia: Average directional movement index
- TradingView: Directional Movement (DMI)
- Fidelity: What Is DMI? - Directional Moving Index
- MetaTrader 5: Average Directional Movement Index Wilder - Trend Indicators - Technical Indicators - Price Charts, Technical and Fundamental Analysis
- CMC Markets: ADX Indicator explained: Measuring trend strength
Risk Disclaimer: Trading involves risk. Past performance doesn't guarantee future results. Only trade with money you can afford to lose. PipTrend is a tool to assist your trading decisions, not financial advice.