Bearish Candle Patterns: A Trader's Field Guide
On this page
What Bearish Candle Patterns Really Signal
A red candle is not a sell signal.
It’s a record of what happened between the open and the close, nothing more.
The gap between “this candle closed lower” and “sellers have taken control” is where most traders lose money. Bearish candle patterns only carry information when they appear at a specific location, on a relevant timeframe, with a defined level that proves them wrong.
This guide treats each formation like a field specimen. What the candlestick anatomy actually shows about buying pressure and selling pressure, where the pattern has to appear to matter, how to confirm it before risking capital, and what to do when the setup fails anyway.
The principles carry across forex, crypto, equities, and futures. The mechanics behind them, price rejection at a level, a shift in market structure, do not care which asset class you trade.
But the inputs differ.
Volume data means something very different on the CME than it does on a spot forex feed, and we’ll cover those caveats in detail.
No candlestick pattern, indicator, or combination of the two guarantees direction. Patterns are probabilistic evidence about who currently controls price, and evidence can be wrong.
Treat everything here as a hypothesis you test, not a rule you obey. The traders who survive are the ones who know their invalidation level before they know their target.
Candle vs Pattern: Know the Difference
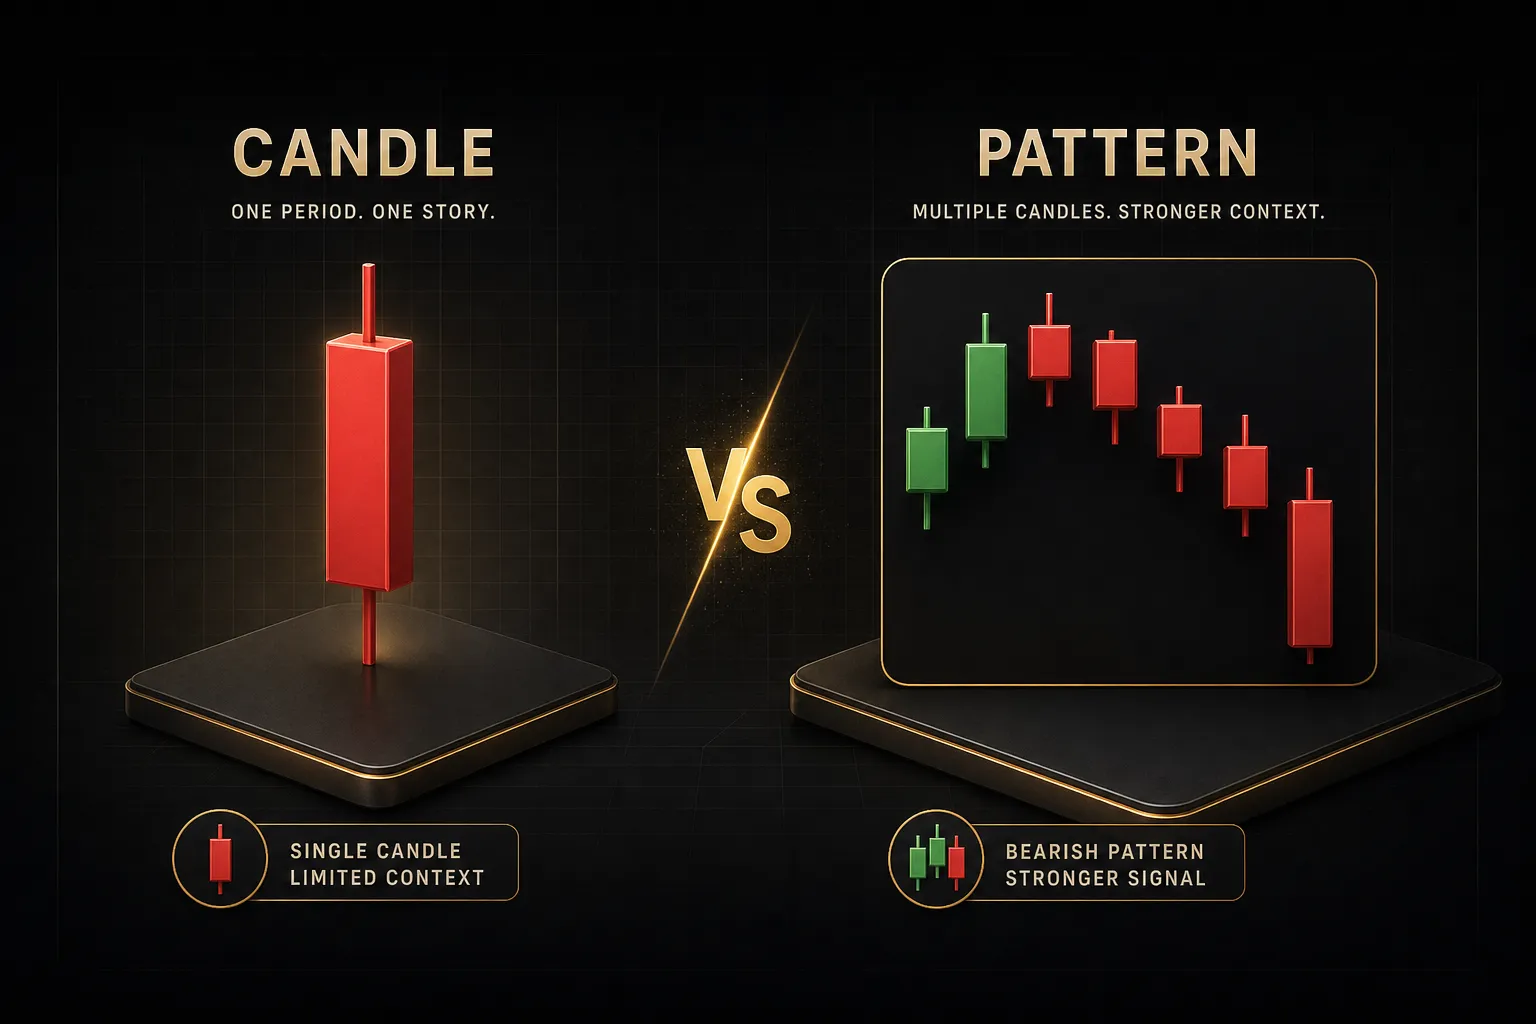
Here’s a distinction that gets flattened in most candlestick tutorials, and it costs beginners real money.
One Candle Isn’t a Signal
A bearish candle is a single-period fact: the close sits below the open (or, under a stricter definition, below the prior candle’s close).
That’s it.
Four data points, open high low close, describing one slice of time.
A bearish pattern is a relationship.
It requires two or more candles interacting with each other and with the surrounding price structure, ideally at a level the market has already respected.
Consider a strong uptrend on the daily chart. Price pulls back for three sessions, printing three red candles with small real bodies and long lower shadows. Every one of those candles is technically bearish.
None of them is bearish evidence.
What they actually show is buyers absorbing supply on a dip, the lower shadows marking price rejection at lower prices. Read as isolated signals, they’d have you shorting into a trend continuation.
The real body tells you the net result of the session. The upper shadow and lower shadow tell you where price went and got refused.
A pattern reads all of that in sequence and asks a better question: has control changed hands, or is this just noise inside a healthy trend?
Reversal or Continuation?
Bearish patterns split into two families, and confusing them is one of the fastest ways to mistake a pause for a top.
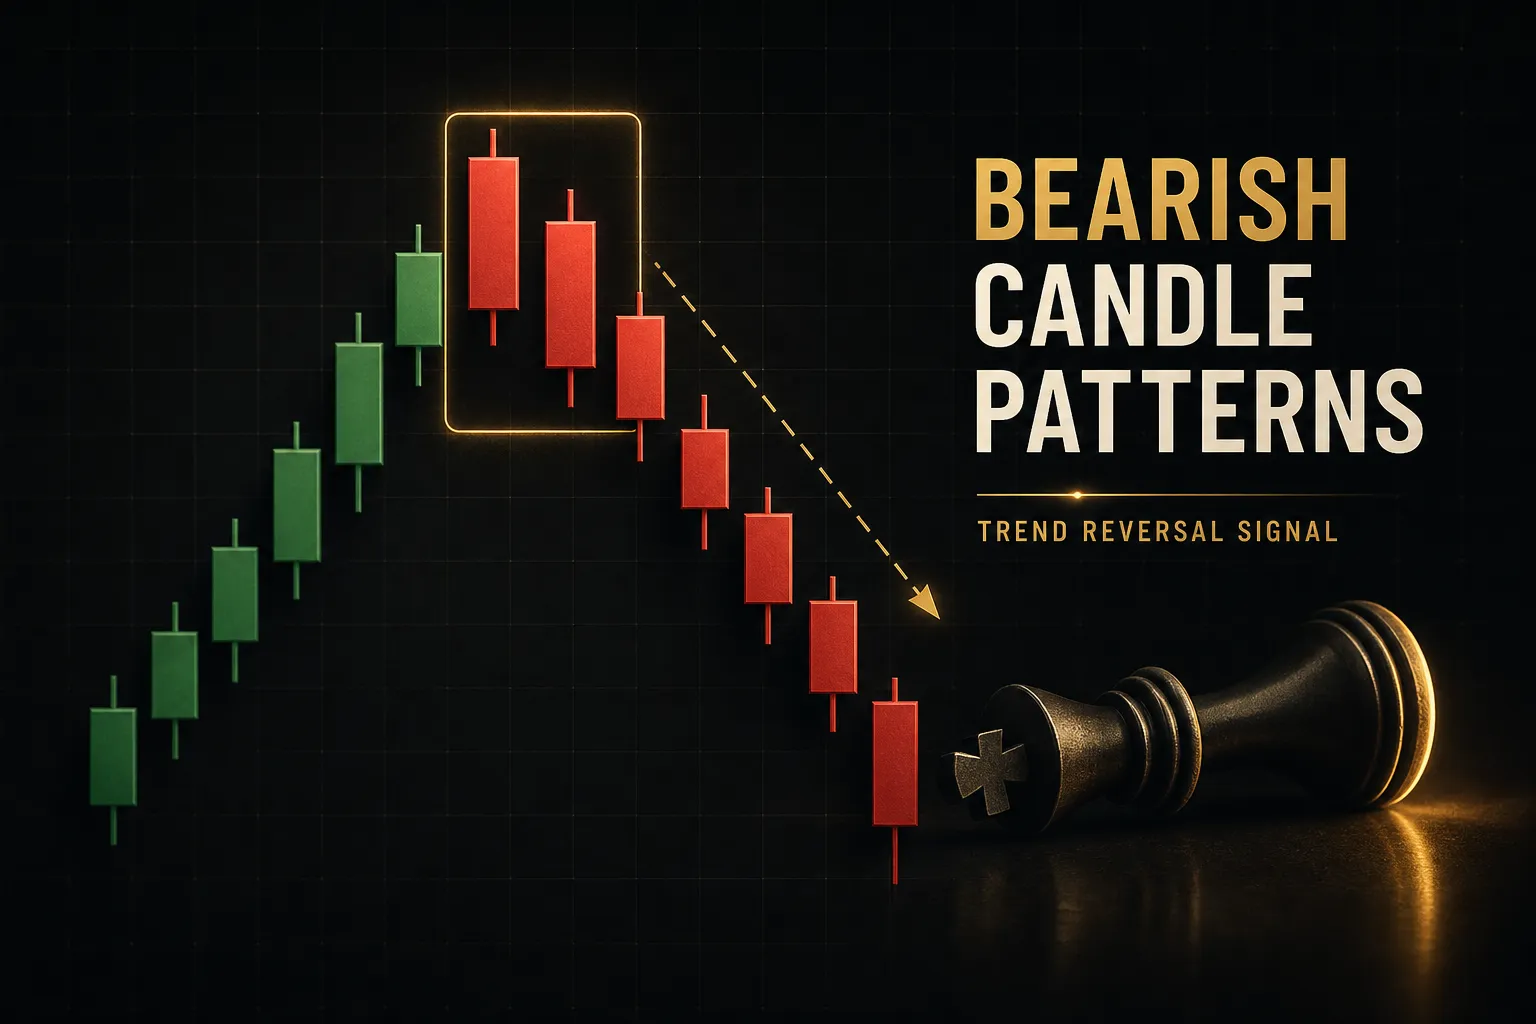
Reversal patterns appear after an advance and suggest the prior move is exhausting. Shooting star, hanging man, bearish engulfing, dark cloud cover, and evening star all belong here.
They only mean anything after a genuine uptrend, because a reversal pattern with nothing to reverse is just a shape.
Continuation patterns appear inside an existing downtrend and suggest the move has further to run. Bearish flags, descending triangles, and three black crows extending an established decline sit in this camp.
Same red candles, completely different message.
Now make it concrete.
A bearish engulfing candle prints in the middle of a two-week sideways range on the four-hour chart. No prior trend, no tested resistance overhead, no swing high to break.
Statistically, you’re flipping a coin and paying spread for the privilege.
Take the identical candle formation and place it at the top of a nine-day rally, right into a horizontal resistance level that rejected price twice in the last quarter. Now the engulfing candle is doing something specific: it’s showing that buyers pushed into supply and got overwhelmed inside a single session.
Same shape.
Same numbers.
Entirely different trade, because location changed the interpretation.
The Core Bearish Patterns
Six formations cover the vast majority of bearish setups you’ll encounter. Each one has a required trend context, a confirmation trigger, and a level that proves it wrong.
Read the table with the invalidation column first. That’s the number that determines your position size and your risk-to-reward ratio before you ever think about a target.
| Pattern | Structure | Trend Context Required | Signal Type | Confirmation Trigger | Invalidation Level | Common Failure Condition |
|---|---|---|---|---|---|---|
| Shooting Star | Small real body near the low, upper shadow at least 2x the body, minimal lower shadow | After a sustained uptrend or into resistance | Reversal | Next candle closes below the shooting star’s low | Above the upper shadow high | Appears mid-range or during low-liquidity sessions with no supply overhead |
| Hanging Man | Small real body near the high, lower shadow at least 2x the body, little to no upper shadow | At the top of an uptrend only | Reversal | Bearish close below the hanging man’s real body, ideally below its low | Above the candle high | Traded without confirmation; the long lower shadow shows buyers defending, not sellers winning |
| Bearish Engulfing | Down candle whose real body fully covers the prior up candle’s real body | After an advance, strongest at tested resistance or a supply zone | Reversal | Close below the engulfing candle’s low, or a lower high forming afterward | Above the engulfing candle’s high | Forms on a news spike or session open, then price reclaims the body within one or two candles |
| Dark Cloud Cover | Gap or strong open above the prior up candle, then a close back below its midpoint | After an uptrend, typically at a resistance breakout failure | Reversal | Follow-through candle closing below the pattern low | Above the high of the dark cloud candle | Penetration is shallower than 50 percent of the prior body, making it a weak version of the signal |
| Evening Star | Large up candle, small-bodied indecision candle, then a down candle closing deep into candle one | End of an extended rally or into a major level | Reversal | Third candle closes below the midpoint of the first; break of the star’s low | Above the high of the middle star candle | Third candle body is too small, leaving the prior swing high intact |
| Three Black Crows | Three consecutive down candles with progressively lower closes and small shadows | Reversal at a top, or continuation inside an existing downtrend | Both, depending on location | Break and close below the prior swing low | Above the high of the first crow | Pattern completes far from any support, arriving late and exhausted just as buyers step in |
Shooting Star vs Inverted Hammer
These two are visually identical.
Small real body at the bottom of the range, a long upper shadow, almost no lower shadow.
If you screenshot one and remove the surrounding chart, no trader alive can tell you which is which.
The difference is entirely positional.
A shooting star appears after an uptrend and is bearish: buyers drove price up during the session and gave the entire move back by the close.
That upper shadow is a record of failed buying pressure.
An inverted hammer appears after a downtrend and is read as bullish: buyers attempted an advance for the first time in a while, and even though they didn’t hold it, the attempt itself signals shifting sentiment.
Prior trend direction is the only variable.
Get that backwards and you’ll short a bottom.
Hanging Man vs Hammer
Same trap, mirrored.
Both candles have a small real body near the high and a lower shadow at least twice the body’s length.
The hammer forms at the bottom of a downtrend. Sellers pushed price to new lows, buyers reclaimed the entire move by the close, and that lower shadow is a rejection of lower prices.
Bullish.
The hanging man forms at the top of an uptrend. Identical shape, but the message is that sellers finally showed up with enough size to push price meaningfully below the open, even if buyers papered over it before the bell.
Bearish, and notably weak without confirmation.
A note on dark cloud cover versus bearish engulfing, since these two get conflated constantly. Both involve a down candle overwhelming a prior up candle.
Dark cloud cover requires the close to penetrate at least 50 percent into the previous real body but not below its open. Bearish engulfing swallows the entire prior body.
Engulfing is the stronger structural statement; dark cloud cover often carries more emotional weight because it typically begins with a gap higher that traps late buyers.
Confirming a Signal Before You Trade It
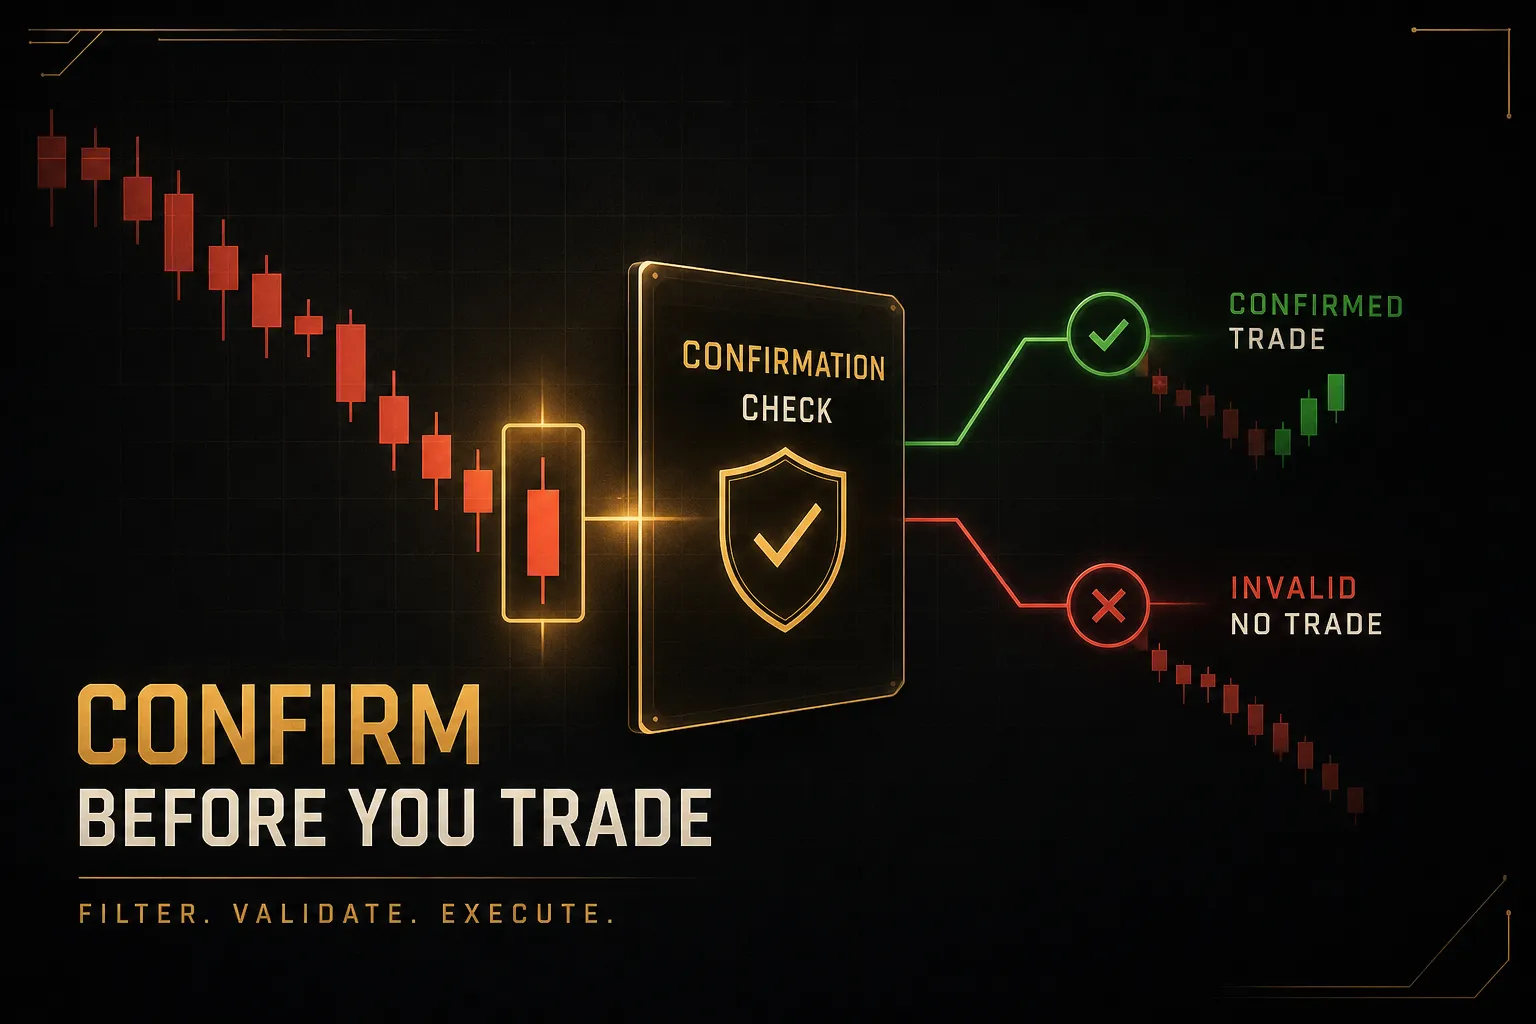
Most losing candlestick trades share one cause: the trader entered before the pattern was actually a pattern.
Location and Trend Context
Before you evaluate the candle itself, answer three questions about where it appeared.
Is there an established trend to reverse or continue? Is there a tested level directly overhead, a horizontal resistance, a supply zone, a prior swing high, a session high?
And has price already shown it respects that level at least once?
A bearish engulfing candle 4 percent below a major resistance zone is unfinished business.
The same candle right at the zone, after a failed breakout attempt, is a trapped-buyer signature.
That second scenario, resistance breakout failure, tends to produce the sharpest downside moves because the traders who bought the breakout now need to exit.
Mid-range patterns are the single largest source of false signals.
If you can’t name the level your pattern is reacting to, you don’t have a setup.
Confirmation and Invalidation Rules
Confirmation needs to be objective, or it’s just a feeling with extra steps. Three rules cover most situations.
- Wait for candle close. A candle that looks like a perfect shooting star with twelve minutes left in the hour can close as a bullish marubozu. Until the period ends, the pattern does not exist. This single rule eliminates a large share of bad entries.
- Require a break of the pattern’s low. The pattern is the hypothesis; the break is the entry trigger. Price trading below the low of the formation confirms sellers followed through rather than merely appearing for one session.
- Check whether market structure actually shifted. A genuine trend reversal produces a lower high followed by a break of the prior swing low. If the uptrend’s structure of higher highs and higher lows is still fully intact, your bearish candle is a pullback, not a top.
Your invalidation level is the price at which the bearish thesis is objectively wrong. For most of these patterns, that sits just above the pattern’s high or above the upper edge of the nearby supply zone.
Place the stop there, sized so the loss is acceptable, and calculate the distance to the next support or demand zone. If that math doesn’t produce at least a 2:1 risk-to-reward ratio, the pattern quality doesn’t matter.
Skip it.
Using an ATR volatility reading to add a buffer beyond the pattern high helps in fast markets, where a stop sitting exactly at the high gets swept by normal noise before the move plays out.
Volume and Timeframe Nuances
Two variables quietly ruin more candlestick trades than any pattern-recognition error: bad volume assumptions and timeframe conflict.
Volume in Spot Forex and Crypto
Volume confirmation only means what you think it means in centralized markets. On listed equities and futures, exchange volume represents essentially all transactions in that instrument, so a bearish engulfing candle on twice the average volume is genuine evidence of participation.
Spot forex has no central exchange.
What your platform displays is tick volume, the number of price updates in a period, which correlates reasonably with activity but is not transaction volume.
Crypto is fragmented across dozens of venues, so exchange volume shows one slice of a much larger market.
Practical takeaway: in forex and crypto, treat volume as supportive context, never as the deciding factor.
A high tick-volume bearish candle at resistance is encouraging.
It is not proof.
When Timeframes Disagree
You spot a textbook bearish engulfing on the 15-minute chart. Clean structure, decent volume, right at intraday resistance.
Then you open the daily and find price sitting three days into a powerful advance, well above a rising 50-period moving average.
That 15-minute pattern is probably just a pullback in a higher-timeframe uptrend. The default hierarchy is simple: the higher timeframe sets the bias, the lower timeframe sets the timing.
Counter-trend lower-timeframe patterns can be traded, but they demand tighter targets, faster management, and the acceptance that you’re fighting the dominant flow. Aligned setups, where a daily downtrend, a four-hour supply zone, and a one-hour bearish engulfing all point the same direction, are where the real edge concentrates.
Finally, event risk.
Weekend gaps in forex, thin Sunday-evening crypto liquidity, earnings releases, and scheduled economic data all print dramatic candles that reflect a liquidity vacuum rather than seller control.
A “perfect” bearish engulfing formed in the first ninety seconds of an NFP release tells you almost nothing about who wants to own the asset an hour later.
Why Bearish Patterns Fail (and How to Test Them)
Every pattern in this guide fails regularly.
That isn’t a flaw in the method; it’s the baseline condition of trading.
What separates profitable traders is knowing why failures cluster.
Common Failure Triggers
Four causes account for the large majority of blown candlestick trades.
- Trading the pattern in a range rather than at a level. Inside a chop zone, price oscillates and every second candle looks meaningful. Without a defined resistance or supply zone, there’s no reason for sellers to be positioned there.
- Ignoring the higher-timeframe trend. Shorting a five-minute shooting star while the daily prints consecutive expansion candles upward is a fight against size you can’t see.
- Entering before candle close. Anticipating a pattern that hasn’t formed yet converts a defined setup into a guess. The candle has to finish.
- Skipping stop placement. A trade without a predefined invalidation level has an unlimited loss profile and no way to measure whether the strategy works.
Add a fifth for completeness: overtrading marginal versions of good patterns. A bearish engulfing where the body barely covers the previous one is not the same signal as a decisive full-body engulf, and treating them identically dilutes your results.
Backtesting a Rule Set
Anyone who tells you a specific candlestick is “the most reliable bearish pattern” is stating a hypothesis as a fact. Reliability varies by asset, timeframe, market regime, and, critically, transaction costs.
Academic and practitioner testing of engulfing patterns has produced inconsistent results across markets and periods. Some samples show a modest edge, others show none after spread and commission.
That inconsistency is the honest answer.
So test it yourself.
The workflow is straightforward.
- Define rules with zero ambiguity. Specify the pattern criteria numerically, the entry (break of pattern low by X pips or ticks), the stop (pattern high plus a buffer), and the exit (fixed R multiple or next support zone).
- Collect at least 100 occurrences. Fewer than that and you’re measuring randomness. Use one instrument and one timeframe per test so results stay interpretable.
- Record win rate and average R multiple. Win rate alone is meaningless. A 38 percent win rate at 3R beats a 65 percent win rate at 0.7R comfortably.
- Compare against a random-entry baseline. Run the same stop and target rules on randomly selected entry points. If the pattern doesn’t outperform the random baseline, it isn’t providing edge, it’s providing comfort.
- Subtract realistic costs. Include spread, slippage, and commission. Plenty of patterns that look profitable in raw price terms die on the cost line.
Adding an Independent Indicator
Candlestick evidence gets stronger when it’s confirmed by something that doesn’t derive from the same three candles. That’s the point of confluence: independent inputs agreeing.
Common independent layers include momentum indicators such as RSI showing bearish divergence against a higher price high, MACD confirmation via a signal-line cross, or price closing below a key moving average that has been acting as trend support.
Tools built for this kind of multi-layer read can compress the work.
PipTrend’s color-coded candles and multi-timeframe trend table, as one practical example, let you check at a glance whether a bearish engulfing on your entry chart aligns with the direction shown on higher timeframes, rather than eyeballing four charts in sequence.
Its marked supply zones and session levels then give you a defined location to trigger the entry from, instead of shorting into open space.
Confluence improves the quality of your sample. It does not turn a probabilistic signal into a certainty, and any tool that promises otherwise is selling something.
The order of operations matters more than the specific tool: establish higher-timeframe direction, identify the level, wait for the candle pattern, confirm with an independent read, then define invalidation.
Frequently Asked Questions
What is the strongest bearish candlestick pattern?
Bearish engulfing and evening star tend to test best when they appear at a tested resistance or supply zone with follow-through confirmation. Both require multiple candles and a decisive close deep into prior buying, which makes them harder to form by accident than single-candle signals.
That said, there is no fixed hierarchy.
Results shift by instrument, timeframe, and market regime, so treat any ranking as a hypothesis to backtest on the specific market you trade.
What are the 5 bearish candlestick patterns?
The five most commonly cited bearish patterns are the shooting star, hanging man, bearish engulfing, dark cloud cover, and evening star. Three black crows is frequently added as a sixth.
All five are reversal formations requiring a prior uptrend to be meaningful. Placed mid-range or against a strong higher-timeframe trend, they carry little predictive weight regardless of how textbook the shape looks.
How do you know if a candle is bearish?
A candle is bearish when its close sits below its open, producing a filled or red real body. Under a stricter definition, some traders also require the close to be below the previous candle’s close.
But a single bearish candle is a fact about one period, not a signal.
It becomes evidence only when it sits at a defined level, follows a genuine advance, and is confirmed by a break of the pattern’s low.
What candlestick pattern predicts a downtrend?
No candlestick pattern predicts a downtrend on its own.
What patterns like the evening star or three black crows can indicate is that selling pressure has overwhelmed buying pressure at a specific location.
An actual downtrend is confirmed by market structure: a lower high followed by a break and close below the prior swing low. The candle pattern is the early hint; the structure break is the confirmation.
What is the difference between bearish engulfing and dark cloud cover?
Bearish engulfing requires the down candle’s real body to completely cover the prior up candle’s body, while dark cloud cover only requires a close past the midpoint of that prior body. Engulfing is structurally the stronger signal.
Dark cloud cover typically opens with a gap or strong push above the previous high before reversing, which traps buyers who chased the move. Both need the same treatment: candle close, confirmation, invalidation above the pattern high.
How do you trade bearish candlestick patterns?
Work in a fixed sequence: identify the higher-timeframe trend, confirm the pattern sits at a tested resistance or supply zone, wait for the candle to close, then require confirmation via a structure break or an independent indicator. Only then consider entry.
Place the stop beyond the invalidation level, usually above the pattern high plus an ATR-based buffer, and set the target at the next support or demand zone. If the resulting risk-to-reward ratio is below roughly 2:1, pass on the trade.
Reading Candles Without Guessing
One rule outranks everything else in this guide: never trade a bearish shape alone.
Three conditions must be present before you risk capital.
Trend context that makes the pattern meaningful. A closed confirmation candle, not a forming one. And a defined invalidation level you identified before entry, not after.
The decision framework fits in two sentences.
If the pattern appears mid-range or against a strong higher-timeframe trend, it’s noise, so wait. If it appears at a tested resistance or supply zone with market structure confirming the shift, it’s a valid, riskable setup with a measurable risk-to-reward ratio.
Here’s the perspective shift that changes results.
A candlestick pattern isn’t a signal to act on.
It’s a starting hypothesis that earns your attention and then has to survive further testing before it earns your money.
Pair the pattern with objective tools, higher-timeframe alignment, marked levels, an independent momentum read, and you reduce uncertainty meaningfully.
You never eliminate it.
Trade accordingly.
Sources
- CME Group: Chart Types: candlestick, line, bar
- ScienceDirect: Bullish and Bearish Engulfing Japanese Candlestick patterns: A statistical analysis on the S&P 500 index
- ScienceDirect: Profitable candlestick trading strategies: The evidence from a new perspective
- IG: How to Trade the Shooting Star Candlestick Pattern
- IG: 16 Candlestick Patterns Every Trader Should Know
Risk Disclaimer: Trading involves risk. Past performance doesn't guarantee future results. Only trade with money you can afford to lose. PipTrend is a tool to assist your trading decisions, not financial advice.