How the EMA Indicator Really Works for Traders
On this page
Why Every Trader Asks About EMA
The EMA indicator does not predict anything. It is a smoothing calculation applied to prices that have already happened, which means every value on your chart is a summary of the past, not a forecast of the future.
That distinction matters more than any setting you choose.
Traders who treat the exponential moving average as a signal generator get chopped up. Traders who treat it as a context tool tend to survive.
Here is the second thing most people miss.
A faster EMA reacts to price sooner, but it also picks up more noise, so you pay for responsiveness with false signals. A slower EMA filters noise beautifully and tells you about the trend well after the good entry has passed.
That trade-off is why “what’s the best EMA setting?” has no universal answer. The right period depends on your instrument’s volatility, your chart timeframe, and how long you intend to hold.
This guide covers the actual calculation and why your broker’s EMA may differ slightly from TradingView’s. Then settings by market, how to read trend slope, the real difference between a price cross and a moving average crossover, how to build pullback entries around an EMA zone, where the indicator fails, and how to test it honestly.
No single buy-or-sell rule at the end.
Something more useful: a decision framework.
What an EMA Actually Is
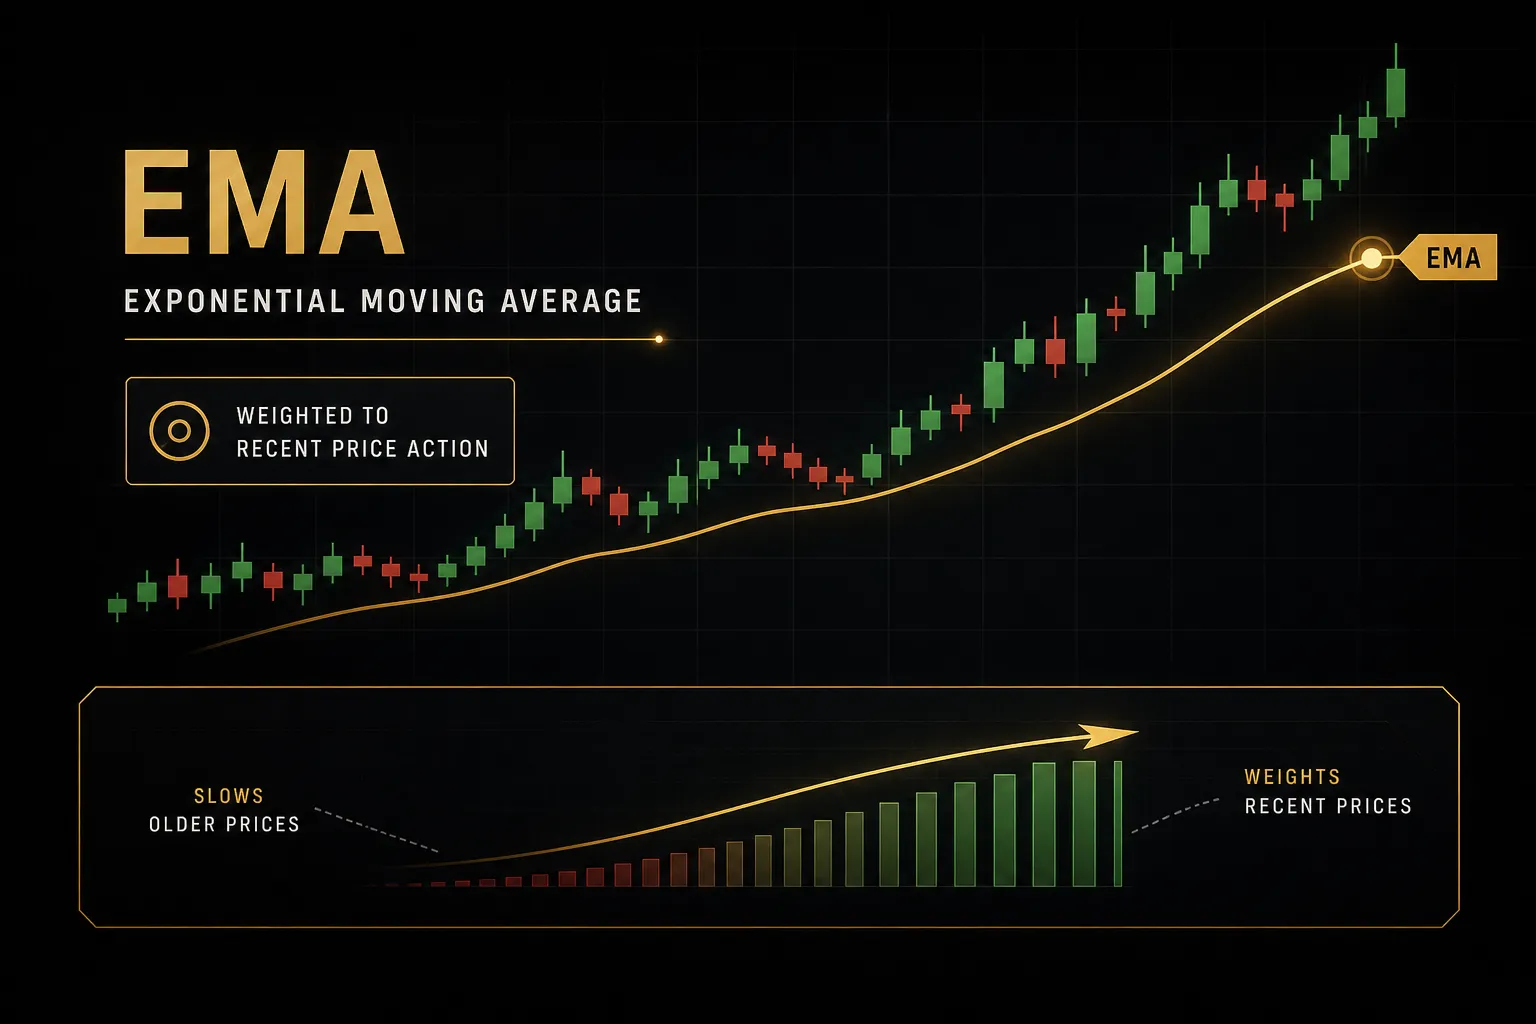
An exponential moving average is a moving average that weights recent prices more heavily than older ones. A simple moving average (SMA) treats every bar in its lookback window as equally important.
The EMA does not.
Think of it like judging a football team’s form.
The SMA says the game ten weeks ago counts exactly as much as last weekend’s result. The EMA says last weekend matters most, and last month barely registers.
That weighting is applied through a smoothing multiplier, and every EMA value carries a trace of every price that came before it, just with exponentially shrinking influence. A weighted moving average does something similar but with a linear decline instead of an exponential one.
The EMA Formula Step by Step
The EMA formula is short enough to run in a spreadsheet. Work through it once and the indicator stops feeling like a black box.
- Pick your period. Decide the lookback length, for example 20 bars. Everything else follows from this number.
- Calculate the smoothing multiplier. Multiplier = 2 / (period + 1). For a 20 EMA that is 2 / 21 = 0.0952, meaning today’s close gets roughly 9.5% of the weight.
- Seed the first value with an SMA. Take the simple average of the first 20 closes. This becomes your “EMA yesterday” for the first real calculation.
- Apply the recursive formula. EMA today = (price today x multiplier) + (EMA yesterday x (1 - multiplier)). For the 20 EMA: 9.52% new price, 90.48% carried forward.
- Repeat forward, bar by bar. Each new value feeds the next one, which is why the EMA line is continuous and never resets.
- Sanity-check the responsiveness. A 9 EMA has a multiplier of 0.20, so it gives today’s close double the weight a 20 EMA does. That single number explains why short EMAs hug price.
EMA vs SMA: Key Differences
Neither one is better. They answer different questions.
The SMA answers: what has the average price been over this window? The EMA answers: where is price gravitating right now, given that recent action matters more?
In a fast reversal, a 50 EMA will turn several bars before a 50 SMA.
That is an advantage when the move is real and a liability when it is a two-day head fake.
In sideways conditions the SMA’s stability produces fewer whipsaw signals, simply because it refuses to chase.
Responsiveness and stability are opposites. Choosing between EMA and SMA is choosing which error you would rather make: reacting to noise, or reacting too late.
Why Early Values Can Differ
Strictly speaking, a true EMA needs infinite price history.
The recursion never fully drops old data, it just shrinks its weight toward zero. Since no chart has infinite bars, every platform has to start somewhere.
Most seed the calculation with an SMA of the first N closes. Others use the first close, and some use a longer warm-up window before displaying the line.
The practical consequence: a 200 EMA plotted on TradingView, in your broker’s terminal, and in your own spreadsheet can differ slightly near the left edge of the data. The gap converges to nothing after a few hundred bars, but it explains why backtest results sometimes refuse to match a chart exactly.
Load plenty of history before you trust an early value.
Choosing EMA Settings for Your Market
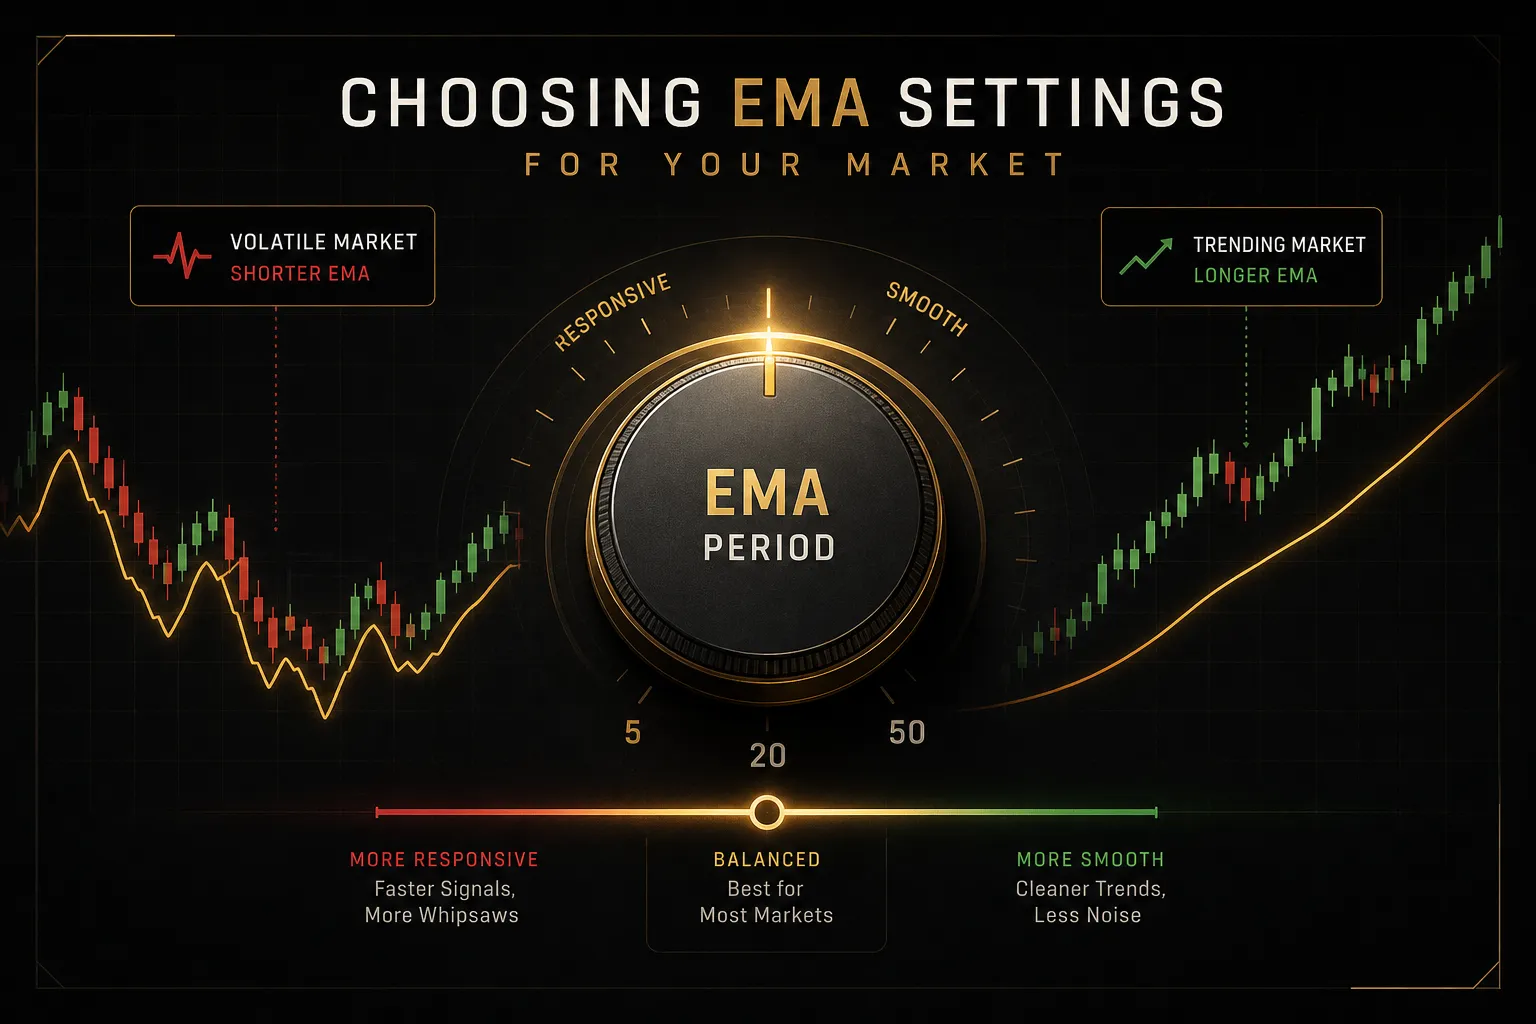
Round numbers dominate EMA settings for one reason: everyone else uses them. The 9, 20, 50, and 200 are not mathematically superior, they are simply the levels the largest number of participants are watching, which gives them a self-reinforcing quality as dynamic support and resistance.
Common EMA Periods and Their Uses
| EMA Period | Typical Role | Common Timeframe | Noise Sensitivity | Multiplier |
|---|---|---|---|---|
| 9 EMA | Fast signal line; momentum timing and short-term exits | 1m to 15m intraday charts | Very high; reacts within 1-2 bars | 0.200 |
| 20 EMA | Short-term trend and intraday pullback zone | 5m to 1H | High but tradeable; filters single-bar spikes | 0.095 |
| 50 EMA | Medium-term trend confirmation for swing trades | 1H to daily | Moderate; ignores most intraday chop | 0.039 |
| 200 EMA | Long-term directional bias; widely watched institutional reference | Daily to weekly | Low; turns only on sustained moves | 0.010 |
Notice the multiplier column.
The 200 EMA gives today’s close just 1% of the weight, which is exactly why it looks like a slow-moving floor rather than a signal line.
Matching the Period to Timeframe and Volatility
The same period behaves completely differently depending on what you apply it to. Four variables decide whether a setting fits: instrument volatility, chart timeframe, holding horizon, and what you actually want the line to do.
In forex, sessions run continuously through the week and major pairs typically move within relatively contained daily ranges. A 20 EMA on the EUR/USD 1-hour chart produces a fairly clean pullback zone because gaps are rare and volatility clusters around session opens.
In crypto, the market never closes and daily ranges of 5-8% are ordinary. A 20 EMA on Bitcoin’s 1-hour chart gets penetrated constantly, so many traders shift slower, to 50 or 100, or measure distance in average true range multiples rather than treating the line as a hard level.
In stocks and futures, fixed sessions create overnight gaps. Price can open on the far side of the 50 EMA with no chance to fill an order at the line, which breaks any strategy that assumes continuous price.
That is a structural issue, not a settings issue.
Practical starting points, and they are starting points, not prescriptions:
- Day trading timing: 9 and 20 EMA on 5m or 15m charts, used for momentum and pullback entries within an already-established intraday direction.
- Swing trend confirmation: 50 EMA on the 4H or daily chart to define whether the current leg deserves your attention at all.
- Higher-timeframe bias: 200 EMA on the daily or weekly, used to answer one question only: am I allowed to be long or short here?
Test any setting on the instrument you actually trade. A period that works on the S&P 500 daily may be useless on a low-float small cap.
Reading Trends and Crossover Signals
Most losing EMA trades come from reading a crossover without reading the market regime around it. The line is identical in a trend and in a range.
The outcome is not.
Trend Direction From EMA Slope
Slope is the most underused piece of information on the chart.
A rising EMA means recent closes are consistently above older ones, which is a mechanical description of upward momentum. A steeply rising line means that pressure is accelerating.
Flat is the signal traders ignore.
When a 50 EMA runs sideways for twenty bars, it is telling you that buyers and sellers have reached a stalemate and that any crossover you see is noise dressed up as information.
Combine slope with price position.
Price above a rising EMA is the cleanest trend-following condition available. Price below a rising EMA is either a pullback opportunity or the first crack in the trend, and market structure decides which.
Look for higher highs and higher lows to confirm the slope’s story. If the EMA rises but price stops making higher highs, momentum is fading before the average shows it.
Price Cross vs EMA Cross Explained
These two events get lumped together and they should not be.
A price cross happens when the candle closes on the other side of a single EMA. It is immediate and it is fast, and on a 5-minute chart price may cross the 20 EMA fifteen times in a session.
Fast, noisy, and mostly meaningless without context.
An EMA cross happens when a faster average crosses a slower one, for example 9 over 20, or the famous 50/200 golden cross and death cross.
Because both lines are smoothed, this event is far less frequent and far slower. The 50/200 cross on a daily chart typically arrives well after a trend change is visible to anyone watching price action.
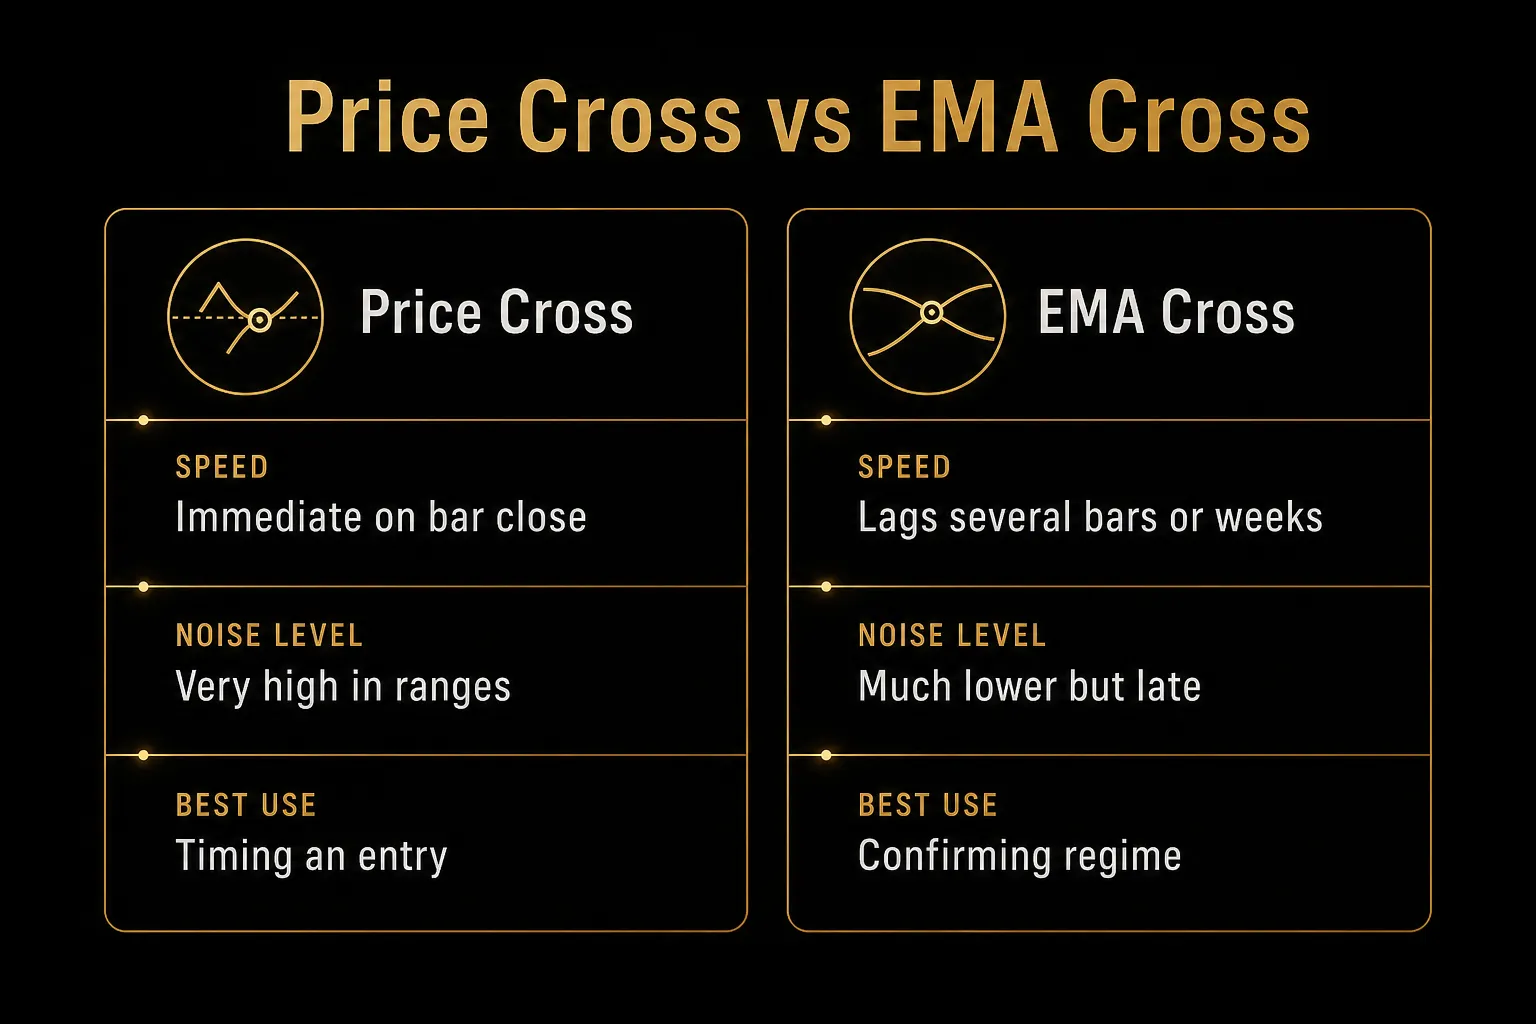
Both signal types whipsaw for the same reason: in a sideways market, the averages sit almost on top of each other and price oscillates through them. Every oscillation triggers a cross, and each cross costs you a spread plus commission.
Filtering helps.
Four filters that genuinely reduce false signals:
- Slope angle: require the slow EMA to be sloping in the trade direction, not flat, before accepting a cross.
- Separation: require a minimum gap between the two EMAs, measured in average true range units, so tangled lines are automatically disqualified.
- Structure: only take long crosses when price has recently made a higher high, confirming the trend the cross claims to identify.
- Volatility context: compress your expectations in low-ATR regimes and widen stops in high-ATR ones instead of using fixed pip or tick values.
Multi-Timeframe Bias and Timing
Multi-timeframe analysis solves the biggest weakness of a single-chart EMA setup: you cannot tell whether you are trading with the dominant flow or against it.
The structure is simple.
A higher timeframe sets direction, a lower timeframe sets timing. If the daily 50 EMA is rising and price sits above it, you only look for long entries on the 1-hour chart.
Short setups get ignored no matter how attractive they look.
This does two things.
It cuts your trade count sharply, and it removes the most common category of loss, the countertrend entry that looked perfect on a 15-minute chart while the daily was grinding higher.
The higher timeframe tells you which direction is permitted. The lower timeframe tells you when. Confusing those two jobs is how traders end up short in a bull market.
Checking three or four timeframes by hand is tedious, and that is precisely why traders skip it under pressure. Multi-timeframe confirmation tables solve this by displaying EMA alignment across timeframes in one view, so agreement or disagreement is visible at a glance rather than reconstructed from memory.
PipTrend’s confirmation table is built for exactly that check.
Turning EMA Signals Into Trades
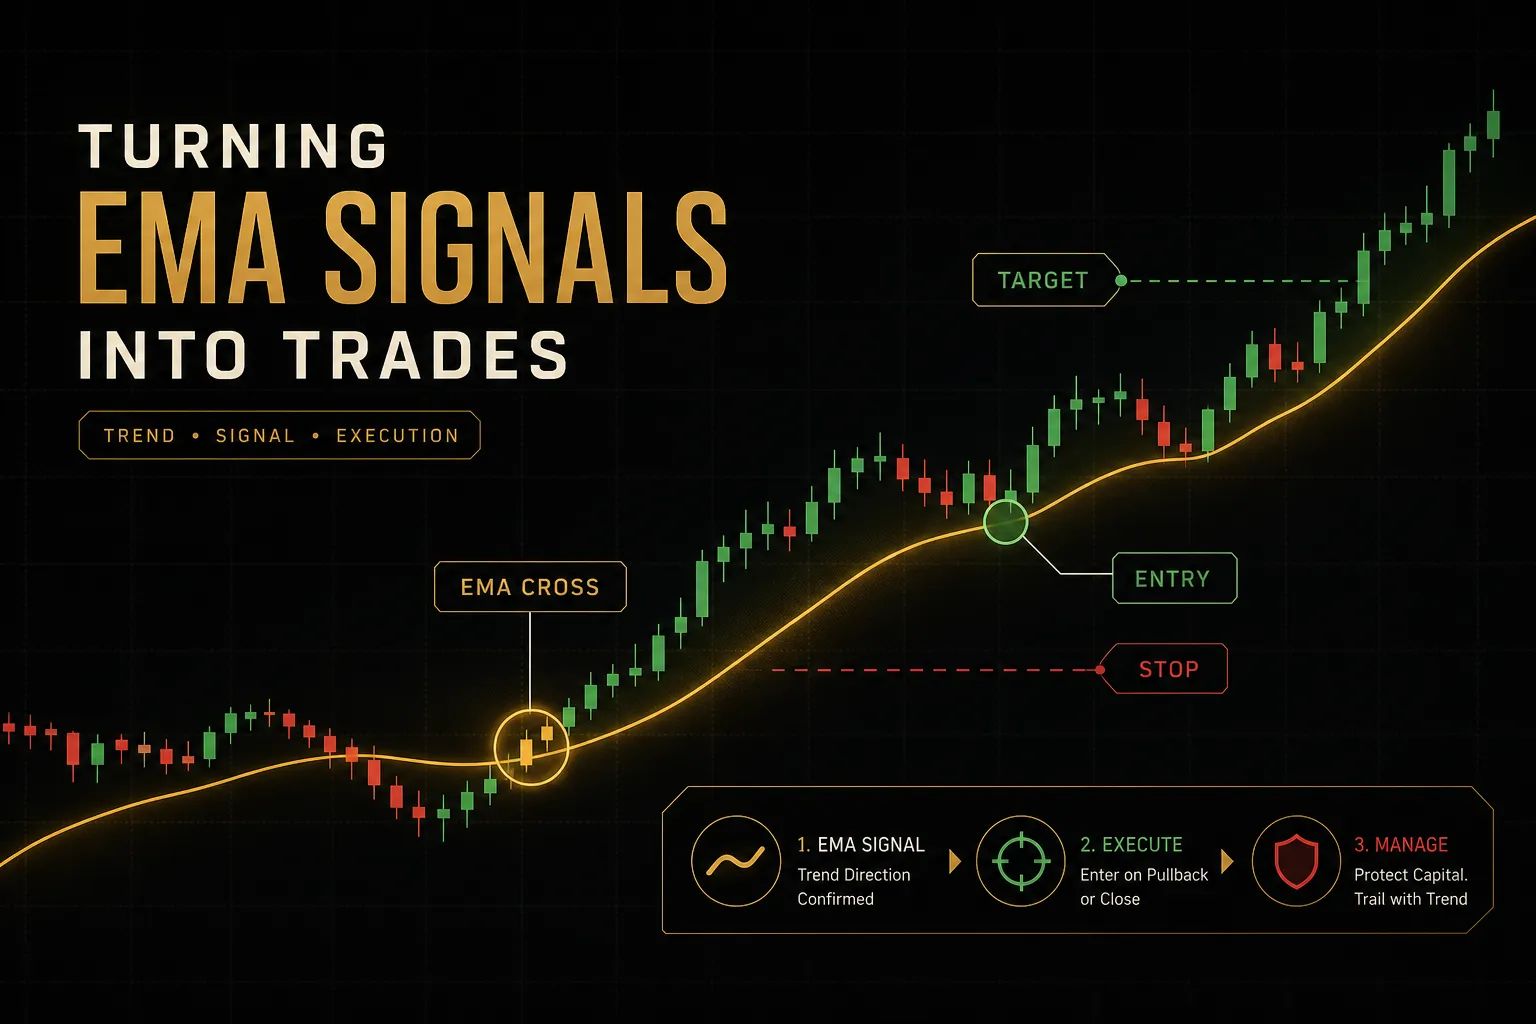
An EMA signal is not a trade.
It is one input into a process that also has to handle entry location, stop distance, target, invalidation, and size. Skip those and the best indicator setting in the world will still bleed money.
Why EMAs Lag and Whipsaw
Lag is not a flaw to be engineered away.
It is the entire mechanism.
Smoothing works by giving weight to past prices, so the output must trail the input.
You can shorten the period to reduce lag, but the noise rises in direct proportion. Drop from a 20 EMA to a 9 EMA and you will get signals two or three bars earlier, along with roughly two to three times as many false ones.
Then costs enter the picture.
A crossover system on a 5-minute chart might generate 20 signals a day, and if each round trip costs one spread plus slippage and transaction costs, a strategy with a genuine statistical edge can still finish the month negative.
High-frequency crossover trading is a fee-generation machine.
Gaps make it worse in equities and futures.
Your stop sits under the 50 EMA, the stock opens 4% lower on an earnings miss, and your actual fill has nothing to do with your planned risk. Any strategy built on EMA levels needs to account for that possibility in advance.
A Rule-Based Trade Workflow
Write the rules before you risk money.
Every element below should be defined in advance, in a sentence you could hand to another trader.
- Market selection. Choose instruments with tight spreads, real liquidity, and a volatility profile that matches your stop distance. Do not run the same parameters on a major FX pair and an illiquid altcoin.
- Higher-timeframe trend filter. Define bias with one rule, for example price above a rising daily 50 EMA equals long-only. Non-negotiable, and checked before anything else.
- Setup identification. Wait for price to retrace toward the EMA zone on your execution timeframe while the trend structure remains intact. The setup is a condition, not an order.
- Entry trigger. Require something specific from price action: a reversal candle closing back in the trend direction, a reclaim of the prior bar’s high, or a breakout confirmation from the pullback consolidation.
- Stop-loss placement. Place the stop where the idea is wrong, typically beyond the swing low and outside the EMA zone, sized using an ATR multiple rather than a fixed number. Structure sets the level; volatility sets the buffer.
- Profit target. Define it before entry, whether that is a prior swing high, an ATR multiple, or a trailing exit on a close below the 20 EMA. Aim for a risk-to-reward ratio of at least 1.5:1 so a sub-50% win rate remains viable.
- Invalidation rule. Specify what cancels the setup before you enter, for example the higher-timeframe EMA turning flat or price closing decisively through the zone. Exiting an invalidated idea is not a loss of discipline, it is discipline.
- Position sizing. Fix risk per trade as a percentage of account equity, commonly 0.5% to 1%, then derive size from stop distance. Position sizing is where most accounts are actually won or lost.
Notice what the entry is anchored to.
Not the crossover moment, but a level identified in advance.
That reframing matters because an EMA is never an exact line in practice.
It is a zone.
Price on the daily chart routinely overshoots the 50 EMA by half an ATR before turning, and treating the line as a precise price invites stops that are too tight.
Pullback trading works better when you define the zone explicitly, from slightly above the EMA to slightly below it, then wait for a trigger inside that band. Tools such as PipTrend’s Confidence Band visualise this pullback zone alongside multi-timeframe confluence, so the entry comes from a marked level with context attached rather than from whichever bar happened to produce a cross.
Testing an EMA Strategy Honestly
Before testing, one warning about confirmation stacking.
Adding the relative strength index and MACD to an EMA setup feels like triple confirmation, but MACD is literally built from two EMAs.
You are asking the same question three times and mistaking the echo for agreement.
Genuine confirmation comes from a different information source.
Volume confirmation, ATR-based volatility state, market structure, or relative strength against a benchmark all tell you something an EMA cannot. Check the timing too: if two indicators fire on the same bar every time, one of them is redundant.
Now, backtesting that means something:
- Eliminate lookahead bias. Only use data available at decision time. An EMA value calculated on the bar’s close cannot be used to enter at that bar’s open.
- Account for survivorship bias. A stock backtest using only currently listed companies excludes every delisting and bankruptcy, which inflates results substantially.
- Reserve out-of-sample data. Optimise on one period, validate on a period you never touched. If performance collapses, you fitted noise.
- Use walk-forward validation. Roll the optimisation window forward through time to mimic how you would actually re-tune parameters in live trading.
- Demand adequate sample size. Aim for at least 100 trades across multiple market regimes, including one trending phase and one range. Thirty trades tell you almost nothing.
- Model real costs. Include spread, commission, and realistic slippage. Backtests that assume perfect fills at the EMA are fiction.
Treat any historical win rate as probability context, not a promise.
A 58% win rate over 200 trades means the edge was present in that data, under those conditions. Markets change regime, and a trend-following indicator that thrived in 2020-2021 conditions had a considerably harder 2022.
EMA Questions Traders Ask Most
What is the best EMA to use?
There is no single best EMA, and any source claiming otherwise is selling something. The right period is a function of your timeframe, your instrument’s volatility, and your holding period.
As of 2026, the most widely used defaults remain 9, 20, 50, and 200, largely because their popularity makes them meaningful reference levels. Start with 20 for intraday and 50 for swing trading, then test on your own instrument.
Is EMA a good indicator for beginners?
Yes, the EMA is one of the better starting indicators, because it teaches trend context rather than encouraging prediction. The formula is simple enough to understand fully, which matters more than beginners realise.
The risk is treating every crossover as a trade. Beginners who use the EMA to answer “what is the dominant direction?” progress faster than those who use it to answer “should I click buy?”
What is the most accurate EMA crossover?
No crossover combination is reliably accurate on its own. Accuracy depends entirely on market regime: crossovers perform in trends and fail in ranges, regardless of the periods chosen.
The 50/200 cross is the most-watched on daily charts and produces fewer false signals, but it also arrives late by design. The 9/20 cross gives earlier intraday signals with substantially more whipsaw signals.
Filtering by higher-timeframe trend and EMA slope improves both far more than changing the numbers does.
Should I use 9 EMA or 20 EMA?
Use the 9 EMA for momentum timing and short-term exits; use the 20 EMA for defining a short-term trend and pullback zone. They serve different jobs and many traders run both.
The 9 EMA gives today’s close 20% weight versus the 20 EMA’s 9.5%, so it hugs price and reacts within a bar or two. On a 5-minute chart that means more signals and more noise.
Scalpers lean on the 9; intraday swing traders lean on the 20.
What is the difference between a 50 EMA and a 200 EMA?
The 50 EMA tracks medium-term trend and the 200 EMA defines long-term directional bias. The 50 reacts to a few weeks of price action on a daily chart, while the 200 requires a sustained multi-month shift to change direction.
Their relationship is the signal most institutions watch.
Price above both, with the 50 above the 200, describes a structurally bullish market. When they invert, the regime has changed even if individual candles look bullish.
Can EMA be used for buy and sell signals?
An EMA can generate buy and sell signals, but used alone it is not a complete strategy. Crossover-only systems typically show acceptable results in trending backtests and deteriorate badly in ranges once spread, commission, and slippage are included.
The workable approach is to use the EMA for bias and pullback location, then require a separate trigger from price action, structure, or volume before entering.
Signals plus rules for stops, targets, and position sizing.
Not signals alone.
Trade the Trend, Not the Line
Strip everything above down to a decision tree and it fits in three lines.
If the EMA slope and your higher-timeframe trend agree, treat pullbacks into the EMA zone as opportunities, and wait for a trigger inside that zone before committing.
If the EMAs are flat, tangled, or contradicting each other across timeframes, stand aside.
And if price is on the wrong side of your higher-timeframe filter, the setup does not exist regardless of how good the lower timeframe looks.
That is it.
The hard part is not the logic, it is doing nothing during the flat stretches.
The perspective shift worth keeping: the EMA is not a signal generator that occasionally requires filtering. It is a context tool that occasionally produces a tradeable location.
Traders who chase every crossover are asking a smoothing calculation to do a job it was never built for.
Read the slope.
Check the higher timeframe.
Wait for the pullback.
Size the risk.
That sequence, applied consistently across a hundred trades, matters far more than whether you chose 20 or 21.
Risk Disclaimer: Trading involves risk. Past performance doesn't guarantee future results. Only trade with money you can afford to lose. PipTrend is a tool to assist your trading decisions, not financial advice.