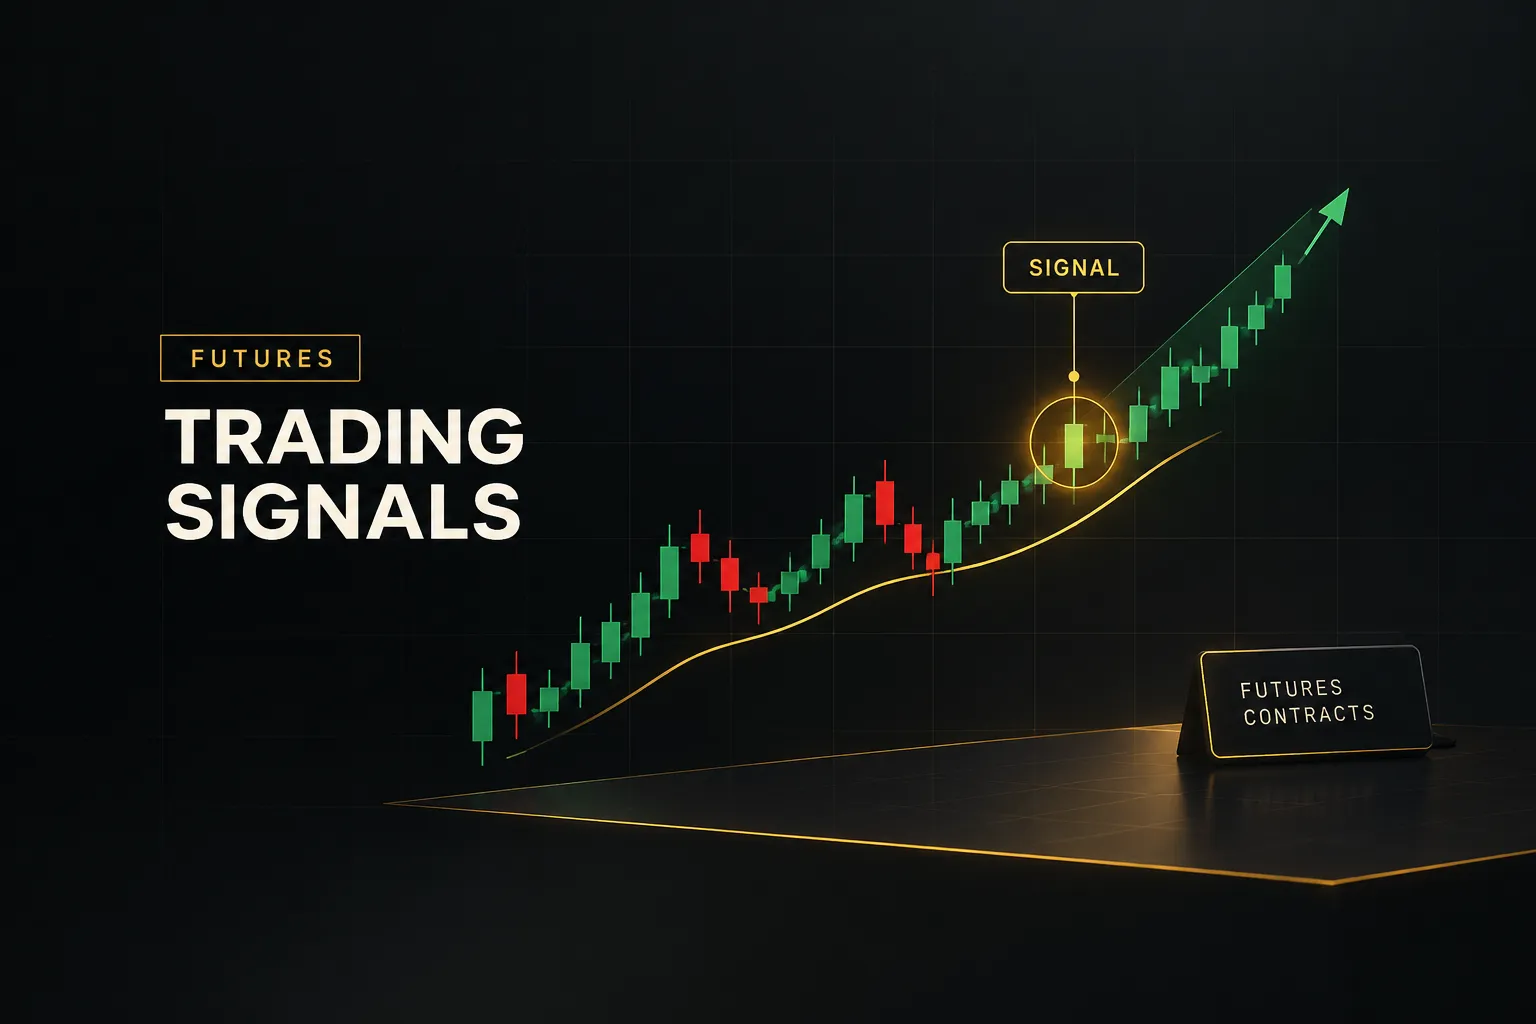
Futures Trading Signals: A Beginner's Guide to Using Them Well
On this page
The Signal Trap Most Traders Fall Into
Most beginners don’t lose money because their signals are bad.
They lose because they treat a signal as if it were a complete trading plan.
An arrow on a chart says “something happened here.” It doesn’t say how much to risk, where you’re wrong, or whether the market is even in a condition where that arrow tends to work.
The typical guide to futures trading signals makes this worse. It hands you a list of the “best indicators” and moves on. The unstated assumption is that a good entry produces a good outcome.
It doesn’t.
An entry is roughly a quarter of the decision.
A signal is a question the market asks you. Context, confirmation, execution, and risk management are how you answer it.
This guide uses that four-part framework instead of an indicator shopping list.
Context asks what kind of market you’re in. Confirmation asks whether independent evidence supports the trade. Execution covers the exact contract, price, and timing. Risk management decides whether the trade is worth taking at all, and at what size.
Set your expectations now.
Signals are decision-support tools, not predictions. Even a well-built system will hit losing streaks, give back gains, and stop working when market conditions change.
So we’ll cover the parts most competitors skip: drawdown, slippage, repainting, and regime change (the moment a market shifts from trending to choppy and your favorite setup quietly stops paying).
That’s where accounts are actually won or lost.
What a Futures Signal Actually Is
Ask five traders what a “signal” is and you’ll get five different answers.
That confusion isn’t harmless.
When a provider sells you “signals,” you need to know whether you’re buying a price alert, an indicator crossover, or a fully specified trade with exits and sizing rules.
Alert, Indicator, Setup, Strategy
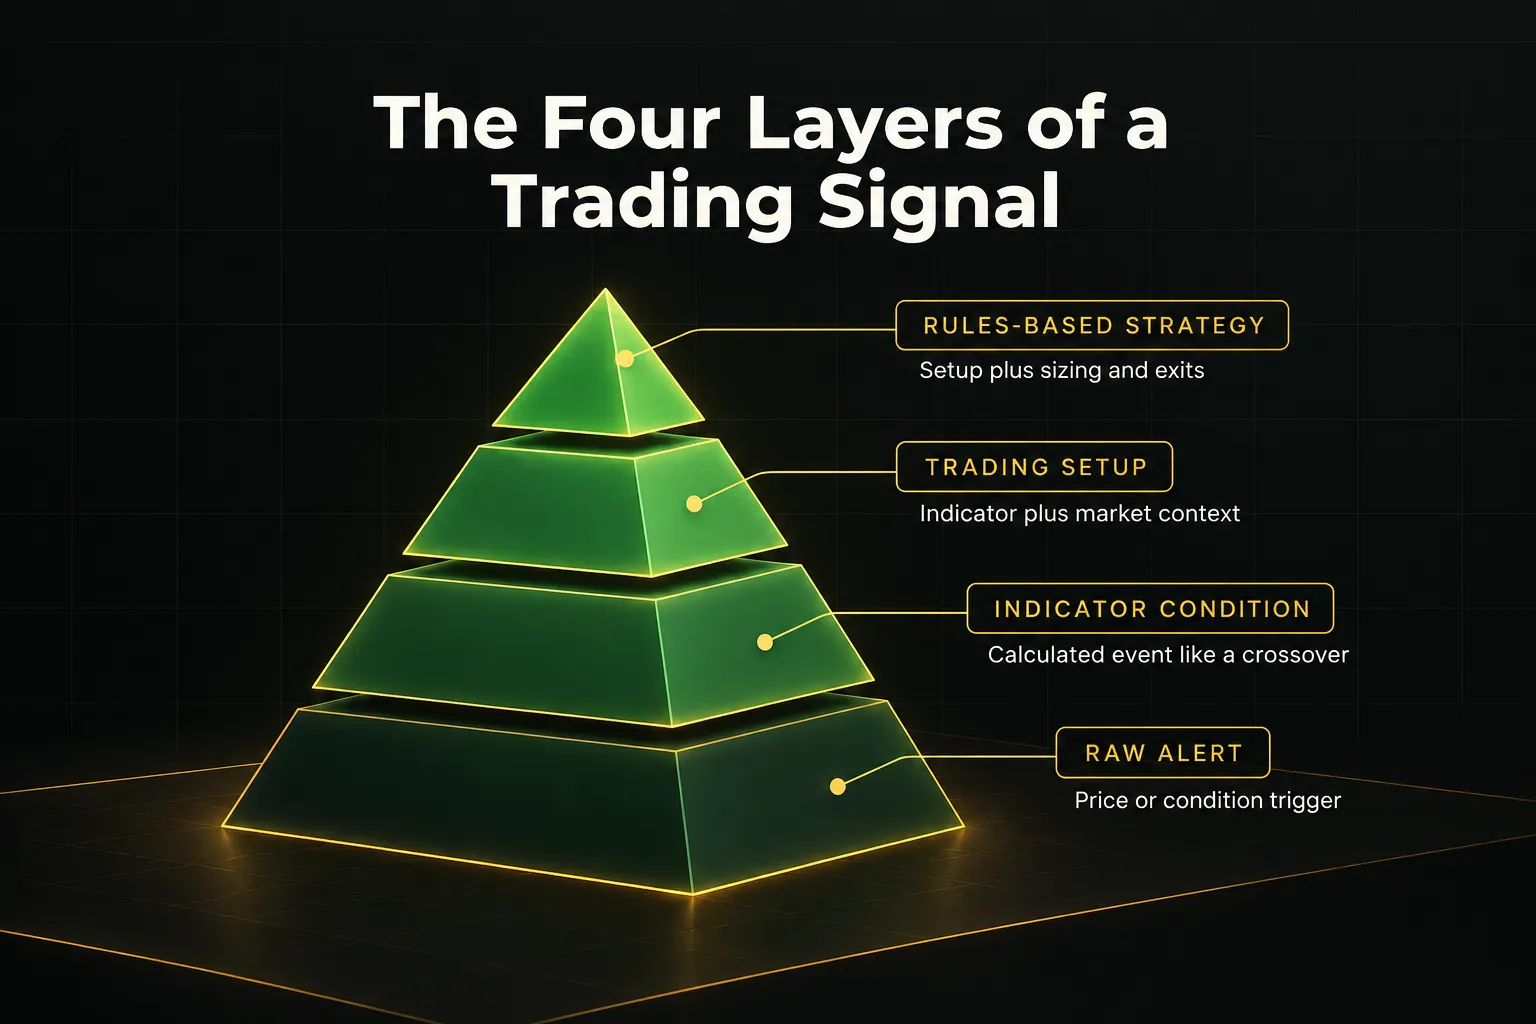
Think of these as four layers, each built on the one below it. Most marketing blurs them together because the bottom layers are cheap to produce and the top layer is where the real work lives.
- Raw alert: A simple trigger based on price or a condition, such as “ES crossed 6,000” or “CL hit yesterday’s high.” It tells you something happened, nothing more.
- Technical indicator condition: A calculated event from technical analysis, like a 9/21 moving averages crossover or the relative strength index dropping below 30. It’s more specific than an alert, but it still ignores the bigger picture.
- Trading setup: An indicator condition plus context. For example, an RSI pullback that only counts when price is above the daily 50-period moving average and near a known support zone. Now you’re filtering for market structure, not just reacting to a number.
- Rules-based strategy: A setup plus position sizing, stop placement, profit targets, and trade management rules. This is the only layer you can properly backtest and evaluate, because every decision is defined in advance.
Competitors routinely call all four of these “signals.” When a provider advertises “85% accurate signals,” ask which layer they mean.
An alert can’t have a win rate, because it has no exit.
Eight Parts of a Legitimate Signal
A signal you can actually trade answers every question you’d face at the moment of entry. If any of these eight components is missing, you’re filling the gap with guesswork, usually under time pressure.
- Contract: The exact instrument and expiry, such as ESM6 (E-mini S&P 500, June 2026) or MNQ (Micro Nasdaq). “Nasdaq” alone isn’t enough when the mini and micro differ tenfold in dollar risk.
- Direction: Long or short. Simple, but surprisingly often implied rather than stated.
- Timeframe: The chart the signal was generated on. A 5-minute signal and a daily signal imply completely different holding periods and stop widths.
- Entry price or zone: A specific level or a tight range. “Now” is not a price.
- Stop-loss: The exact price where you exit at a loss.
- Target: One or more profit-taking levels, which together with the stop define your risk-to-reward.
- Invalidation condition: The market event that proves the idea wrong, such as “a 15-minute close back below VWAP.” This often sits at or near the stop but isn’t always identical.
- Expiration or time validity: How long the signal stays live. A breakout entry that hasn’t filled within 30 minutes may no longer reflect current conditions.
Here’s the difference in practice.
A vague alert reads: “BUY NQ now 🚀.” You don’t know the contract size, the timeframe, where to exit, or when the idea expires.
A fully specified version reads: “Long MNQM6, 15-minute chart. Entry zone 21,480 to 21,490 (retest of the overnight high). Stop 21,440. Target 1 at 21,560, Target 2 at 21,620. Invalid on a 15-minute close below 21,450. Valid until 11:00 a.m. ET.”
Every decision is made before your emotions get a vote.
Accuracy Claims vs Real Performance
A 70% win rate sounds like a money machine.
It can just as easily be a slow leak.
The number that gets advertised is almost never the number that determines whether you make money.
Leading vs Lagging Indicators
Leading indicators try to anticipate a move before it happens. Oscillators like the RSI and stochastics, along with tools that flag overbought or oversold conditions, fall into this group. They get you in early but produce more false positives, especially in strong trends where “overbought” can stay overbought for days.
Lagging indicators confirm a move after it starts. Moving averages, MACD crossovers, and most trend-following tools belong here. They filter out noise but enter later, which means giving up part of the move and accepting wider stops.
Here’s the trap.
Stacking RSI, stochastics, and Williams %R feels like triple confirmation.
It isn’t.
All three are momentum indicators derived from the same price data, so they agree with each other almost by design.
Real confirmation comes from independent sources: a momentum reading, plus a structural level, plus volume or volume profile data, plus volatility from average true range (ATR).
Different inputs, different blind spots.
Metrics That Beat Win Rate
Win rate tells you how often you’re right.
It says nothing about how much you make when right versus how much you lose when wrong. Trade expectancy combines both: (win rate × average win) minus (loss rate × average loss), after costs.
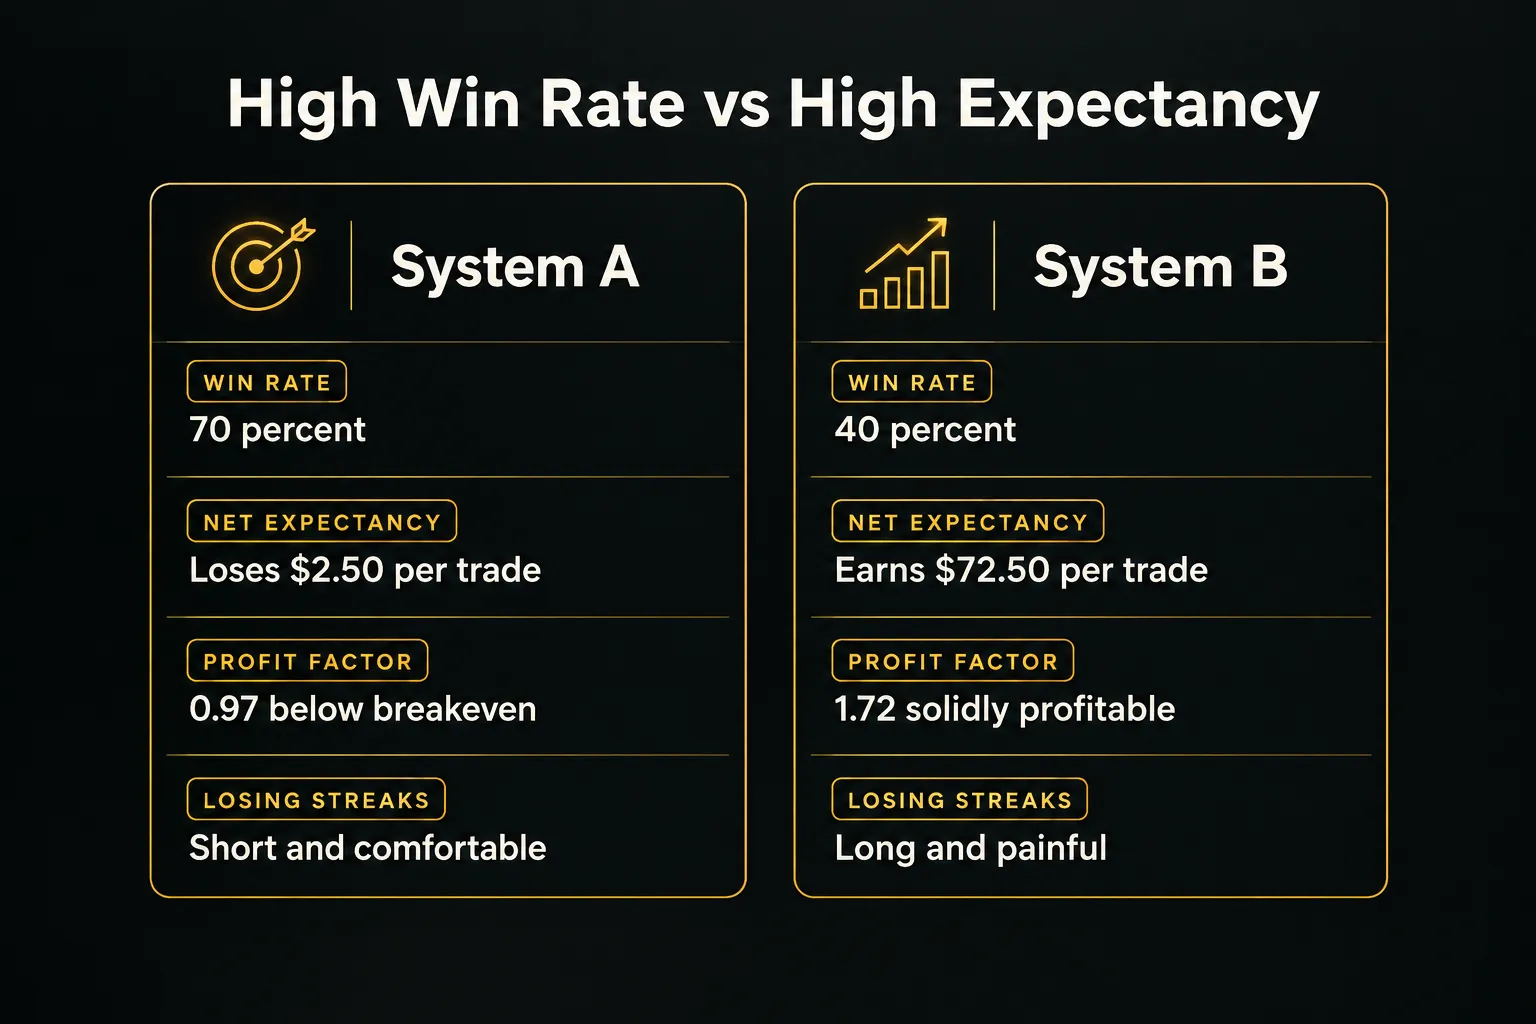
The table below compares two hypothetical E-mini S&P systems over 100 trades. Both include roughly $17.50 per round trip in costs (about $5 commission plus one tick, or $12.50, of slippage).
| Metric | System A (70% win rate) | System B (40% win rate) | What It Tells You |
|---|---|---|---|
| Gross average win / loss | $150 / $300 | $450 / $150 | The raw edge before real-world friction |
| Net average win / loss (after costs) | $132.50 / $317.50 | $432.50 / $167.50 | Costs shrink wins and enlarge losses |
| Win-to-loss ratio | 0.42 | 2.58 | How much a typical win pays relative to a typical loss |
| Net expectancy per trade | −$2.50 | +$72.50 | The single number that predicts long-run profit |
| Net profit factor | 0.97 | 1.72 | Gross profit divided by gross loss; below 1.0 loses money |
| Typical longest losing streak (per 100 trades) | About 4 losses | About 9 losses | The psychological test you must survive |
| Drawdown from that streak | About $1,270 | About $1,510 | Minimum capital cushion you need to keep trading |
System A wins seven out of ten trades and still loses money.
System B loses six out of ten and earns about $7,250 per 100 trades.
But System B demands that you sit through nine straight losses without abandoning it, which is exactly where most traders quit.
Track profit factor, expectancy, and maximum drawdown together. A profit factor between 1.3 and 2.0 over a meaningful sample is respectable.
Anything far above 3.0 deserves suspicion before celebration.
Repainting and Lookahead Bias
Published accuracy numbers are often built on flaws you can’t see in a screenshot. These are the most common ways a backtest flatters a signal:
- Repainting signals: Some indicators recalculate past values as new data arrives, so historical arrows appear in perfect spots that never existed live. Pivot-based and zigzag indicators are frequent offenders.
- Intrabar changes: A signal can appear mid-candle and vanish before the close. If you traded the flicker, you took a trade the backtest never recorded.
- Delayed alerts: Alerts that arrive seconds or minutes late turn a clean breakout entry into a chase, adding slippage the stats ignore.
- Look-ahead bias: The test uses information that wasn’t available at decision time, such as the day’s closing price to filter a morning trade.
- Survivorship bias: Providers show the strategies or months that worked and quietly retire the ones that didn’t.
- Unrealistic fills: Many backtests assume you get filled at the exact touch of a limit price. In reality, price often tags your level and reverses without filling you.
The fix is disciplined backtesting: require signals to trigger only on a confirmed candle close, add realistic costs, and validate with out-of-sample testing and walk-forward analysis.
If a strategy only works on the data it was built on, it doesn’t work.
From Signal to Executed Trade
What separates a trader who uses signals well from one who gets chopped up?
Mostly the 60 seconds between seeing the signal and clicking the button. A repeatable confirmation process turns that window from impulse into procedure.
A Pre-Entry Confirmation Checklist
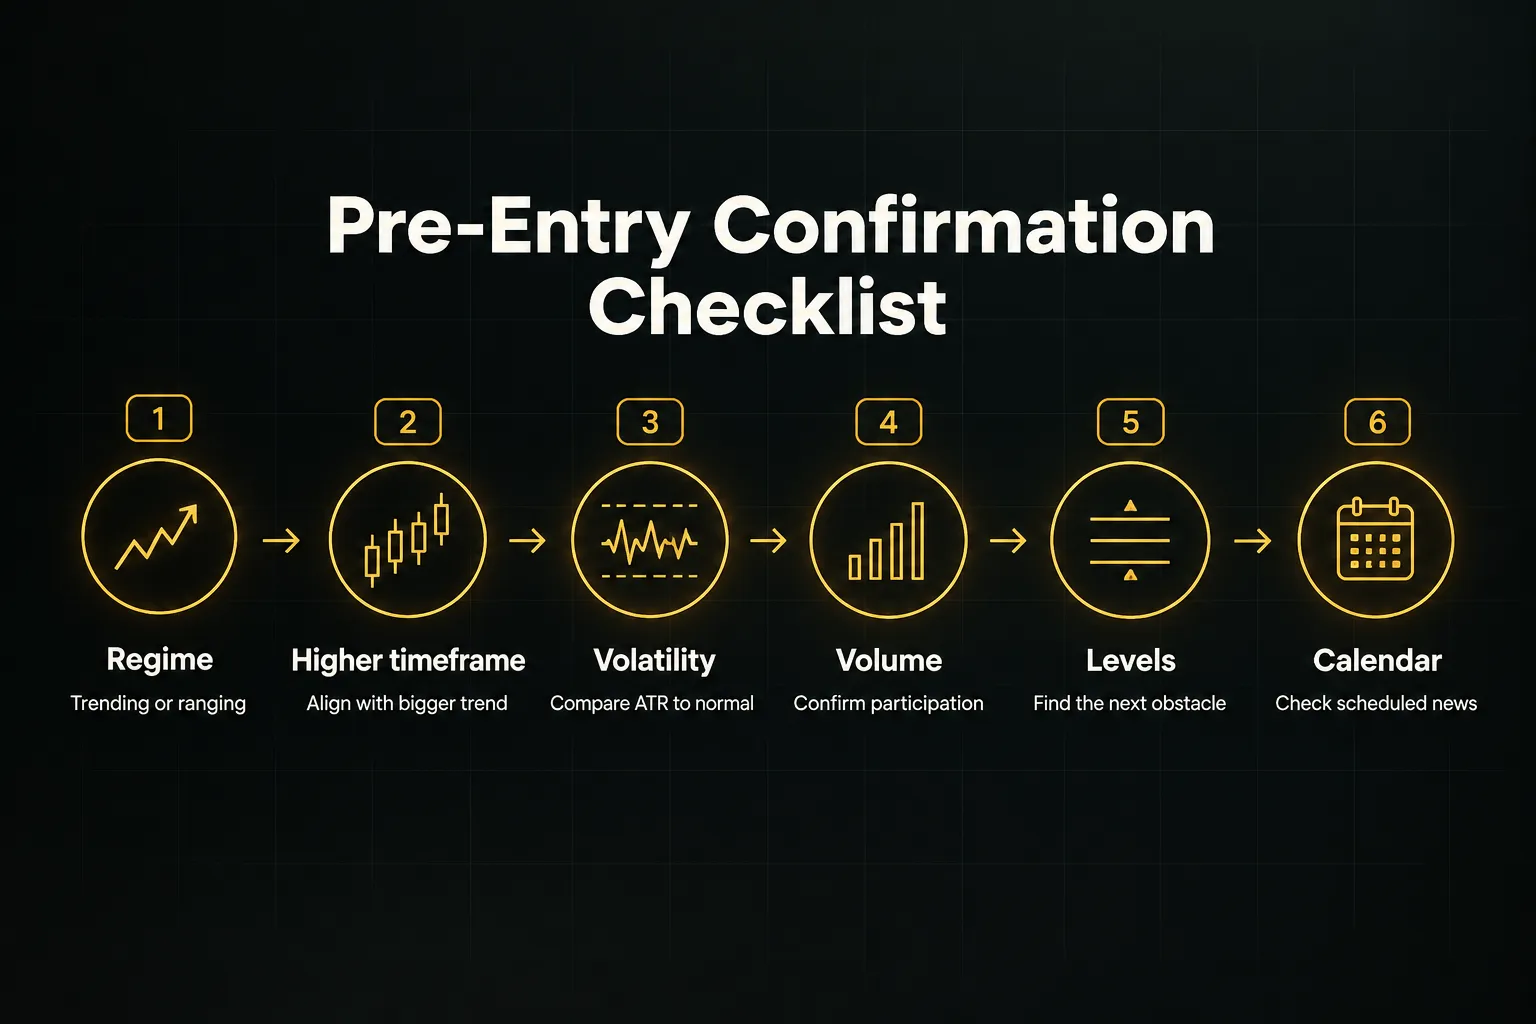
Run this checklist every time, in this order. If a step fails, you either skip the trade or reduce size.
No exceptions for “this one looks really good.”
- Identify the market regime. Decide whether the market is trending, ranging, or in high-volatility expansion. Trend-following signals bleed in ranges, and mean-reversion signals get run over in trends.
- Check the higher-timeframe trend. If you’re trading a 5-minute signal, look at the 60-minute and daily charts. Signals aligned with the higher timeframe tend to have better follow-through.
- Measure volatility. Compare current ATR to its 20-period average. If ATR is twice normal, your standard stop is probably too tight and your size too large.
- Confirm with volume. A breakout on rising volume is far more credible than one on fading volume. Breakout confirmation without volume is just a price poke.
- Check proximity to support and resistance. Buying directly under a prior day high or a major volume node means your target may be blocked. Know where the next obstacle sits.
- Scan the economic calendar. CPI, FOMC decisions, Nonfarm Payrolls, and the weekly EIA crude inventory report can move markets several ATRs in seconds. Check the economic calendar before every session.
Why Contracts Trade Differently
The same RSI signal on ES and CL is not the same trade.
Futures contract specifications change the dollar risk, the noise level, and the hours when signals are reliable. Adapt every signal to its contract with these steps:
- Know the tick size and tick value. ES moves in 0.25-point ticks worth $12.50; NQ in 0.25-point ticks worth $5.00; YM in 1-point ticks worth $5.00; RTY in 0.10-point ticks worth $5.00; CL in $0.01 ticks worth $10.00; GC in $0.10 ticks worth $10.00. Tick size and tick value determine what a “10-tick stop” actually costs you.
- Adjust for relative volatility. NQ and RTY typically swing harder than ES and YM in percentage terms. A stop that’s comfortable on ES may sit inside normal noise on NQ.
- Respect liquidity and trading hours. ES is deep almost around the clock, while RTY and YM thin out noticeably overnight. Signals during the Asian session often produce wider spreads and worse fills.
- Account for news sensitivity. CL reacts violently to Wednesday’s EIA inventory data and OPEC headlines. GC responds sharply to CPI, real yields, and dollar moves. Index futures care most about Fed decisions and major earnings.
- Test on properly adjusted continuous contracts. Futures expire, and raw continuous charts create artificial price gaps at each rollover. Unadjusted data can generate fake signals or distort backtest results, so use back-adjusted series for testing and the front-month contract for live levels.
Separating Signal From Entry
One of the most useful design ideas in signal services is separating which way from where exactly.
PipTrend’s approach offers a clean educational example. Its signals provide a direction, then mark a specific entry level tied to market structure rather than firing a “buy now” at whatever price happens to be printing.
- Establish direction first. The signal states a bias, long or short, based on trend and momentum conditions. This answers “which way” without forcing an immediate entry.
- Wait for a marked structural level. Entry levels are anchored to session highs and lows, VWAP, or supply and demand zones. These are places where other participants are likely watching too, which gives the level meaning.
- Check the multi-timeframe confirmation table. A table shows whether trend readings agree across several timeframes. When the 5-minute, 15-minute, and hourly readings conflict, the setup is weaker, and that’s visible at a glance.
- Require a candle close. Signals only confirm when the candle closes, which prevents the repainting problem described earlier. What you see in history is what you would have seen live.
- Review the published outcomes. PipTrend publishes trade results with verified statements, losses included. That’s the standard to hold any provider to: a full record, not a highlight reel.
You don’t need any particular service to apply this structure.
The principle is what matters… a direction without a defined level is only half a signal.
Risk, Leverage, and Position Size
Futures margins look generous.
That’s precisely the danger.
With E-mini S&P futures around 6,000, one ES contract controls roughly $300,000 of the index, often for an initial margin deposit well under 10% of that value.
Low margin doesn’t reduce risk.
It magnifies how fast a normal market move eats your equity.
Here’s how to keep leverage from making your decisions for you:
- Leverage amplifies losses as much as gains. If you post $20,000 of margin on one ES contract, a 1% index move (about 60 points) equals $3,000, or 15% of that margin. A 1% move against you is an ordinary day, not a crash.
- Leverage and risk are not the same thing. Leverage is how much exposure you control per dollar of margin. Risk is how much you’ll lose if your stop is hit. You can trade a highly leveraged instrument with small risk by sizing correctly and using defined stops.
- Calculate position size from risk, not from margin. The formula is: contracts = (account size × risk %) ÷ (stop distance in ticks × tick value). Margin only tells you the maximum you’re allowed to trade, never how much you should.
- Worked example on ES. A $50,000 account risking 1% has $500 at risk per trade. An 8-point ES stop is 32 ticks × $12.50 = $400 per contract, so you trade 1 contract (500 ÷ 400 = 1.25, always round down). On the Micro E-mini (MES, $1.25 per tick), the same stop costs $40, allowing 12 contracts and much finer control.
- Worked example on NQ. A 30-point NQ stop is 120 ticks × $5.00 = $600 per contract, which exceeds your $500 limit. The answer is zero NQ contracts, or 8 Micro Nasdaq (MNQ) contracts at $60 each. If the math says zero, the trade is too big for the account.
- Place stops at the invalidation level, not an arbitrary percentage. A stop belongs where the trade idea is proven wrong, such as just beyond the swing low, below VWAP, or outside the supply zone. Then size the position to fit that stop, rather than tightening the stop to fit a bigger position.
- Skip valid signals around major news. A technically perfect setup two minutes before FOMC or CPI is a coin flip with extra slippage. Wait for the release and the first reaction to settle.
- Skip when spreads or liquidity are abnormal. Holiday sessions, overnight hours on thinner contracts, and the minutes around rollover can produce wide spreads that turn a 1-tick slippage assumption into 4 or 5.
- Stop when your daily loss limit is hit. If your rule is a 2% or 3% daily maximum loss, the next signal doesn’t exist once you reach it. Revenge trading after a limit breach is how one bad day becomes a bad month.
- Pass on poor risk-to-reward. If the nearest resistance sits only 6 points away and your stop needs 8 points, the trade fails the math. Most disciplined traders require at least 1.5:1 or 2:1 before entering.
Get position sizing right and a losing streak becomes a statistic.
Get it wrong and the same streak ends your trading career.
Futures Signals: Common Questions
What is the most accurate futures trading signal?
No single futures trading signal is the most accurate across all conditions. Accuracy depends on market regime, timeframe, and contract.
A trend-following signal can perform well for months and then fail in a choppy range, so the “best” signal is one matched to current conditions and paired with sound risk management.
Are futures trading signals worth it?
Futures trading signals are worth it when they’re fully specified, verifiable, and used inside a disciplined process. They save analysis time and enforce consistency.
They’re not worth it if you expect them to replace your own risk management or if the provider can’t show a complete, timestamped track record.
What is the best indicator for trading futures?
There is no universally best indicator for trading futures.
VWAP, moving averages, RSI, ATR, and volume profile each answer a different question about trend, momentum, volatility, or value. The strongest approach combines independent indicators rather than stacking several that measure the same thing.
How do you find entry and exit points in futures trading?
You find entry and exit points by anchoring them to market structure.
Entries work best at levels like session highs and lows, VWAP, and supply or demand zones, while stops belong at the invalidation point. Targets typically sit at the next significant level, with position size calculated to fit the stop distance.
Can you make money with trading signals?
Yes, you can make money with trading signals, but only if the signals have positive expectancy after costs and you execute them consistently. Most losses come from poor sizing, skipped stops, and abandoning a system during normal drawdowns.
Expect losing streaks even from a profitable approach.
How do I know if a trading signal is legitimate?
A legitimate trading signal provider shows verifiable trade records with timestamps, including losses. Look for a sample of at least 100 trades across varied conditions, such as trending, ranging, and high-volatility periods.
Testimonials and profit screenshots prove nothing, because they’re easy to cherry-pick.
Also check the data sources behind longer-term signals.
The Commitments of Traders report is released on Friday afternoons with positions as of the prior Tuesday, a three-day lag that makes it useful for swing and position trading but nearly useless intraday. Open interest and volume data likewise suit multi-day analysis better than scalping, since daily open interest figures are typically finalized the following session.
Treat Signals as Tools, Not Oracles
Here’s one concrete action for your next trade. Before you enter, write out all eight signal components: contract, direction, timeframe, entry zone, stop, target, invalidation condition, and expiration. Then run the six-step confirmation checklist.
If you can’t fill in every line, you don’t have a trade yet.
That exercise takes about two minutes.
It will also stop more bad trades than any new indicator you could add to your chart.
Futures trading signals are genuinely useful in 2026, as long as you treat them as structured decision-support inside a repeatable process. They narrow your attention and enforce consistency.
They don’t guarantee profits, and the providers who claim otherwise are telling you something important about themselves.
Context, confirmation, execution, risk.
Get those four right, and the signal becomes the easiest part of the job.
Sources
Risk Disclaimer: Trading involves risk. Past performance doesn't guarantee future results. Only trade with money you can afford to lose. PipTrend is a tool to assist your trading decisions, not financial advice.