On this page
Why Most Trading Signals Mislead You
A green arrow on a chart feels like permission to buy.
It isn’t.
Most beginners lose money on signals that were technically “correct” because the signal told them which way price might move but said nothing about where to get in, where to get out, or how much to risk.
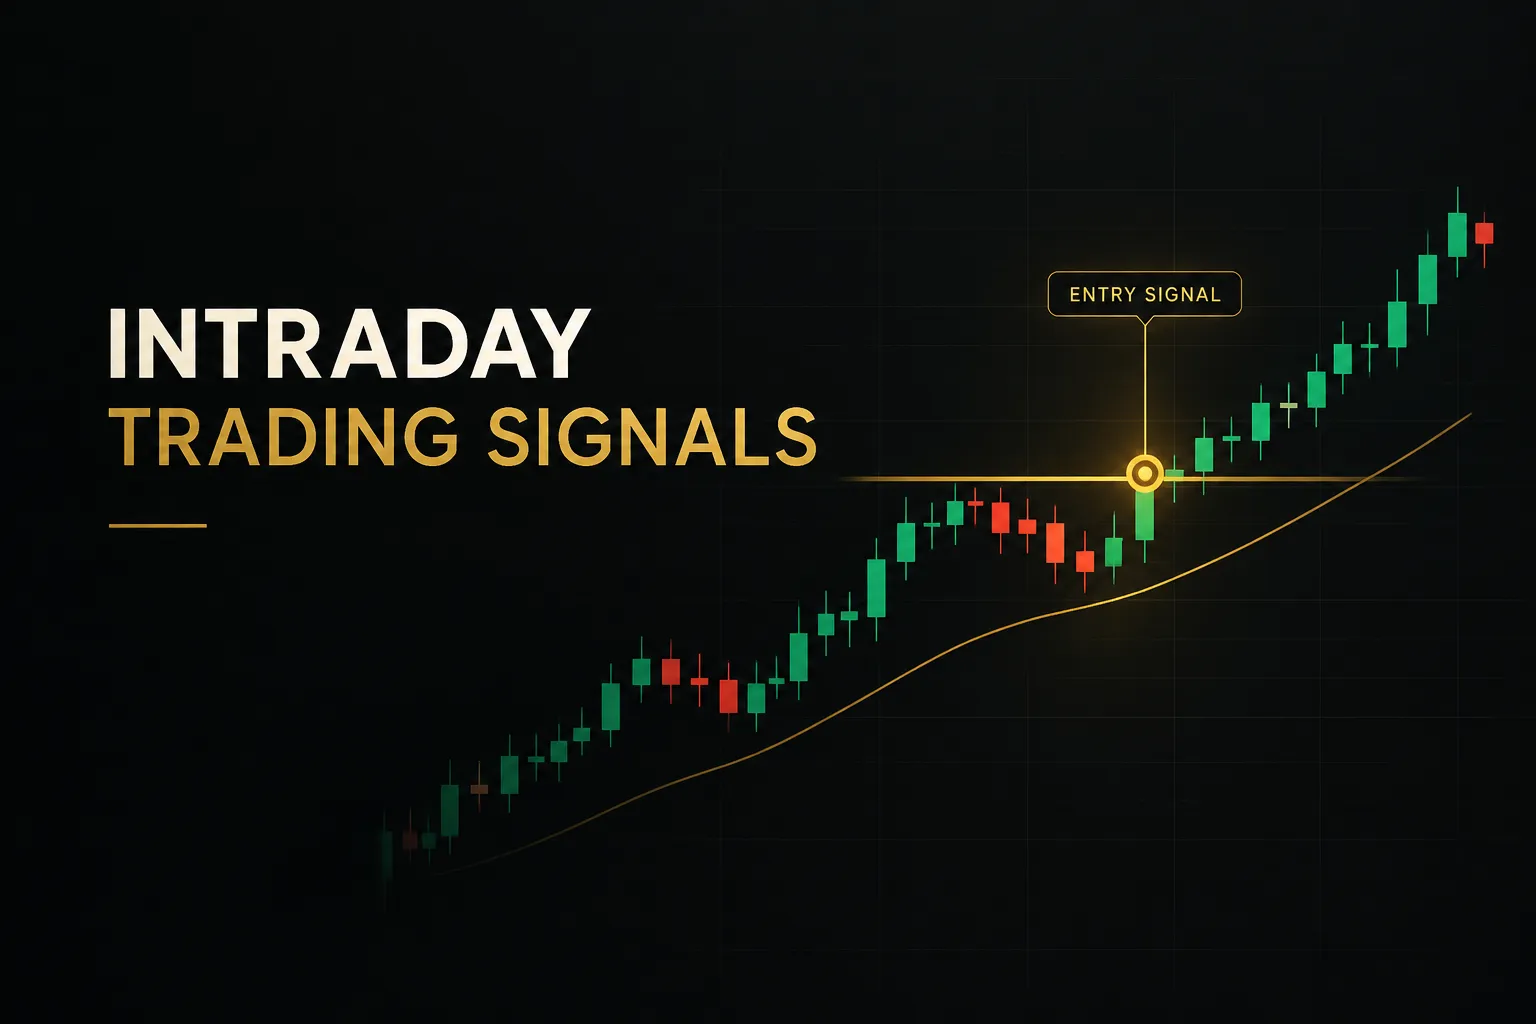
Intraday trading signals are time-stamped alerts (buy, sell, or hold) generated from price, volume, or indicator logic and meant to trigger entries and exits within the same trading session. They come from chart patterns, moving average crossovers, momentum oscillators, or algorithms that combine several inputs at once.
But a raw signal is not a trade plan.
It lacks four things every real trade needs: an entry price, a stop-loss, a profit target, and a position size. Without those, “buy EUR/USD” is closer to a weather forecast than a decision.
A signal tells you direction. Your plan tells you whether the trade is worth taking.
That distinction shapes this entire guide.
Tools like PipTrend deliberately separate the direction signal from the entry level, and that separation is a useful model for anyone learning technical analysis. Instead of treating alerts as instructions, you will learn to treat them as hypotheses that need validation before any capital is on the line.
You will also learn to judge signals by the right metrics. Win rate alone is a trap, and a signal that looks flawless on a historical chart may never have been tradeable in real time.
One expectation to set early.
No signal, indicator, or system works in every market regime. Trending markets reward one approach, choppy ranges reward another, and news-driven sessions can break both.
As of 2026, that hasn’t changed despite better software and faster data feeds.
Trading involves real risk of loss, and financial results are never guaranteed. What you can control is process: how you filter signals, size positions, and verify performance.
That’s where the edge lives.
How Intraday Signals Actually Work
Behind nearly every buy or sell alert sits a surprisingly small set of ingredients. Once you know what they are, you can reverse-engineer almost any signal service and judge whether its logic makes sense for the market you trade.
Anatomy of a Signal
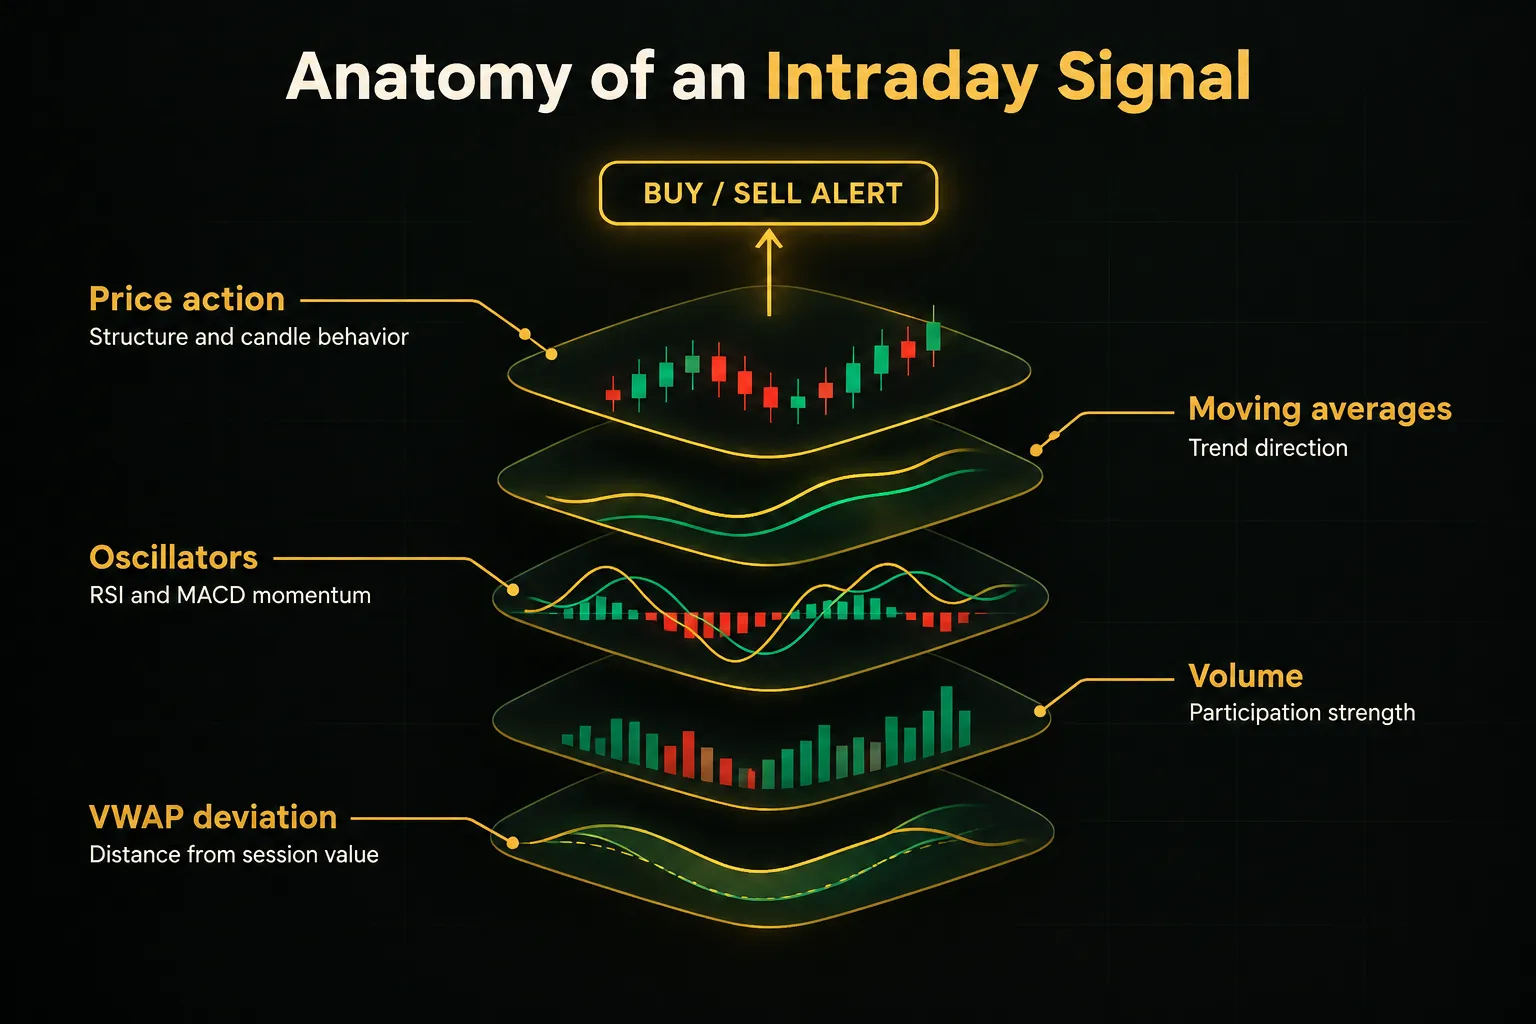
Most intraday signals draw on five inputs.
Price action covers raw candle behavior: higher highs, lower lows, engulfing bars, and breaks of market structure. Moving averages, especially the exponential moving average (EMA), smooth price to reveal trend direction and act as dynamic support and resistance.
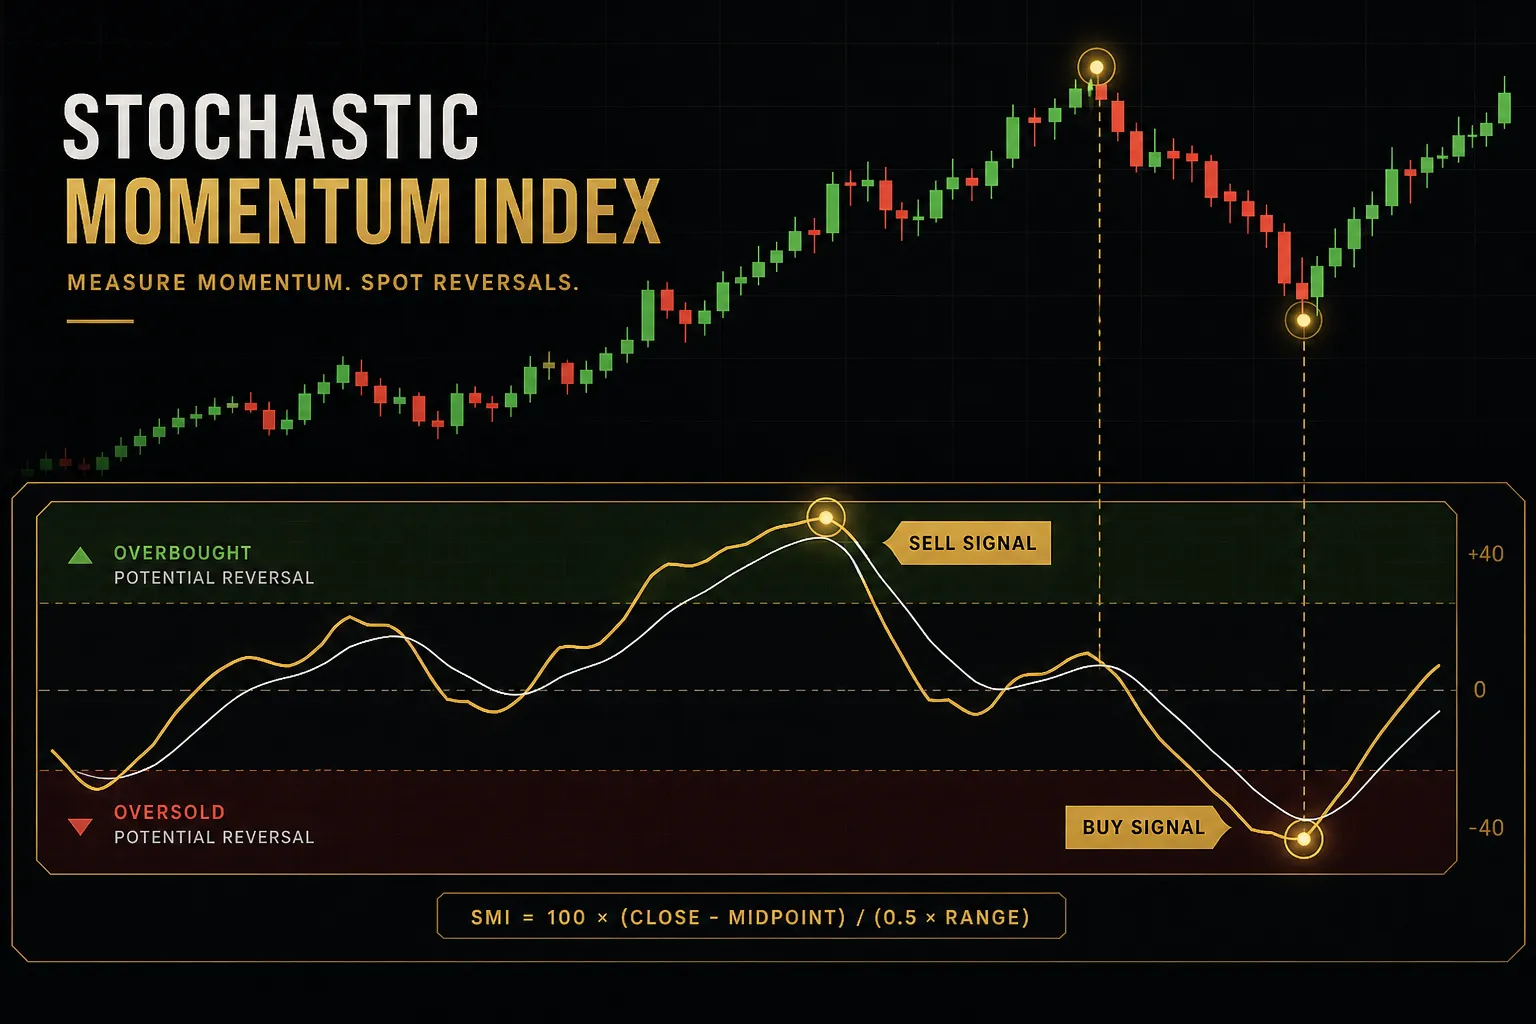
Oscillators such as RSI and MACD measure momentum.
RSI flags when a move may be stretched, while MACD tracks the relationship between two EMAs to show momentum shifts. Volume, and particularly relative volume compared with the same time on previous days, tells you whether a move has participation behind it.
Finally, VWAP deviation measures how far price has drifted from the volume-weighted average price for the session. Institutional traders benchmark against VWAP, so large deviations often attract reversion.
Timing matters as much as inputs.
A candle-close signal only fires once the bar finishes, so the condition is locked in. An intrabar signal fires the moment conditions are met mid-candle, which means it can appear, vanish, and reappear before the bar closes.
That flicker creates false confidence.
You see a buy arrow at 10:03, enter, and by 10:05 the candle closes below the trigger level and the arrow is gone.
The trade you took… no longer exists on the chart.
For beginners, candle-close confirmation is almost always the safer default.
Manual, Rule-Based, or Automated?
Signals come in three broad flavors, and each trades one strength for another.
Manual signals come from a trader reading the chart with discretion. They adapt well to unusual conditions, like a surprise central bank comment, but they are hard to verify because the logic lives in someone’s head.
Consistency depends on the trader’s mood and focus that day.
Rule-based signals use fixed indicator logic, such as “buy when the 9 EMA crosses above the 21 EMA and RSI is above 50.” They are fully transparent and testable.
The limitation is rigidity: the rules fire the same way in a trend or a chop.
Automated signals are rule-based logic executed by a bot. They win on speed and emotional discipline.
But they inherit every flaw in the underlying rules and can compound losses quickly if market conditions shift.
Automated is not inherently better than manual.
Each trades speed for adaptability, or adaptability for consistency. And all three require the same verification steps before you trust them with real money.
Matching Indicators to Market Conditions
Here’s a counterintuitive truth: the same RSI reading of 75 can be a great short signal on Tuesday and a terrible one on Wednesday.
The indicator didn’t change.
The market regime did.
Trending vs Ranging Signals
Every indicator family was designed for a specific type of market.
Trend-following tools (moving averages, ADX, and trend-detection candles) perform when price moves directionally. Oscillators like RSI and the stochastic oscillator shine in ranges, where overbought and oversold readings actually lead to reversals. VWAP and volume profile suit session-based mean reversion, where price tends to return to value.
| Indicator Family | Examples | Best Regime | Typical Signal | Common Failure |
|---|---|---|---|---|
| Trend-following | 9/21 EMA, 50 EMA, ADX above 25 | Trending, expanding volatility | Pullback entry toward EMA in trend direction | Repeated whipsaws in sideways markets |
| Momentum oscillators | RSI (14), stochastic (14,3,3) | Ranging, stable volatility | Reversal from overbought or oversold zone | Stays “overbought” for hours in strong trends |
| Momentum shift | MACD (12,26,9) | Transition from range to trend | Signal line cross or histogram flip | Lags badly on 1-minute charts |
| Session value | VWAP, volume profile | Rotational, mean-reverting sessions | Fade extended moves back to VWAP | Fails on strong trend days that never revisit VWAP |
| Volatility | ATR (14), Bollinger Band width | All regimes (as a filter) | Sizing stops and spotting volatility expansion | Gives no directional information on its own |
Stacking indicators is where many beginners go wrong. RSI and the stochastic oscillator both measure momentum from recent price, so when both flash “oversold,” you haven’t gotten two confirmations.
You’ve gotten the same message twice.
Indicator redundancy adds noise, not confidence.
Real confirmation comes from combining different types of information: one directional tool, one momentum or volume read, and one structural level such as support and resistance.
Time Frames and Asset Differences
For intraday work, most traders time entries on the 1-minute to 15-minute charts and set directional bias on a higher time frame, often the 1-hour or 4-hour.
This is the core of multi-time-frame analysis.
Lower time frames need tighter confirmation rules.
A 1-minute chart prints 390 candles in a single US stock session, and many of those will generate signals that are pure noise. Requiring a candle close, above-average relative volume, and higher-time-frame agreement cuts that noise sharply.
Asset class changes the rules too.
A signal on a crypto chart at 3 a.m. means something very different from the same pattern on a stock at the opening bell.
| Asset Class | Trading Hours | Typical Leverage | Spread Behavior | Key Liquidity Window | Signal Interpretation Tip |
|---|---|---|---|---|---|
| US stocks | 9:30 a.m. to 4:00 p.m. ET (plus extended hours) | Up to 4:1 intraday for pattern day traders | Tight in large caps, wide in small caps | First and last 60 minutes | Treat signals in the midday lull with extra caution |
| Forex | 24 hours, 5 days a week | Up to 30:1 (EU retail), 50:1 (US majors) | Widens sharply around rollover and news | London and New York overlap | Asian-session signals on EUR pairs often lack follow-through |
| Futures | Nearly 24 hours with a daily break | Set by exchange margin | Usually one tick in liquid contracts | Cash session open for index futures | Overnight signals trade on thinner volume |
| Crypto | 24/7 | Varies widely by exchange and region | Can gap during low-liquidity hours | Overlaps with US equity hours | No “overnight” close, so define your own session |
Overnight exposure is the other hidden variable.
Stock day traders flatten before the close to avoid gaps, while forex and crypto traders must choose their own session boundaries. Your signal rules should match whichever structure you trade.
Turning a Signal Into a Trade
What separates a gamble from a trade?
Five written decisions made before you click buy.
A signal supplies at most one of them.
The Trade Plan Checklist
Every complete trade plan answers five questions.
If any one is blank, you don’t have a trade yet.
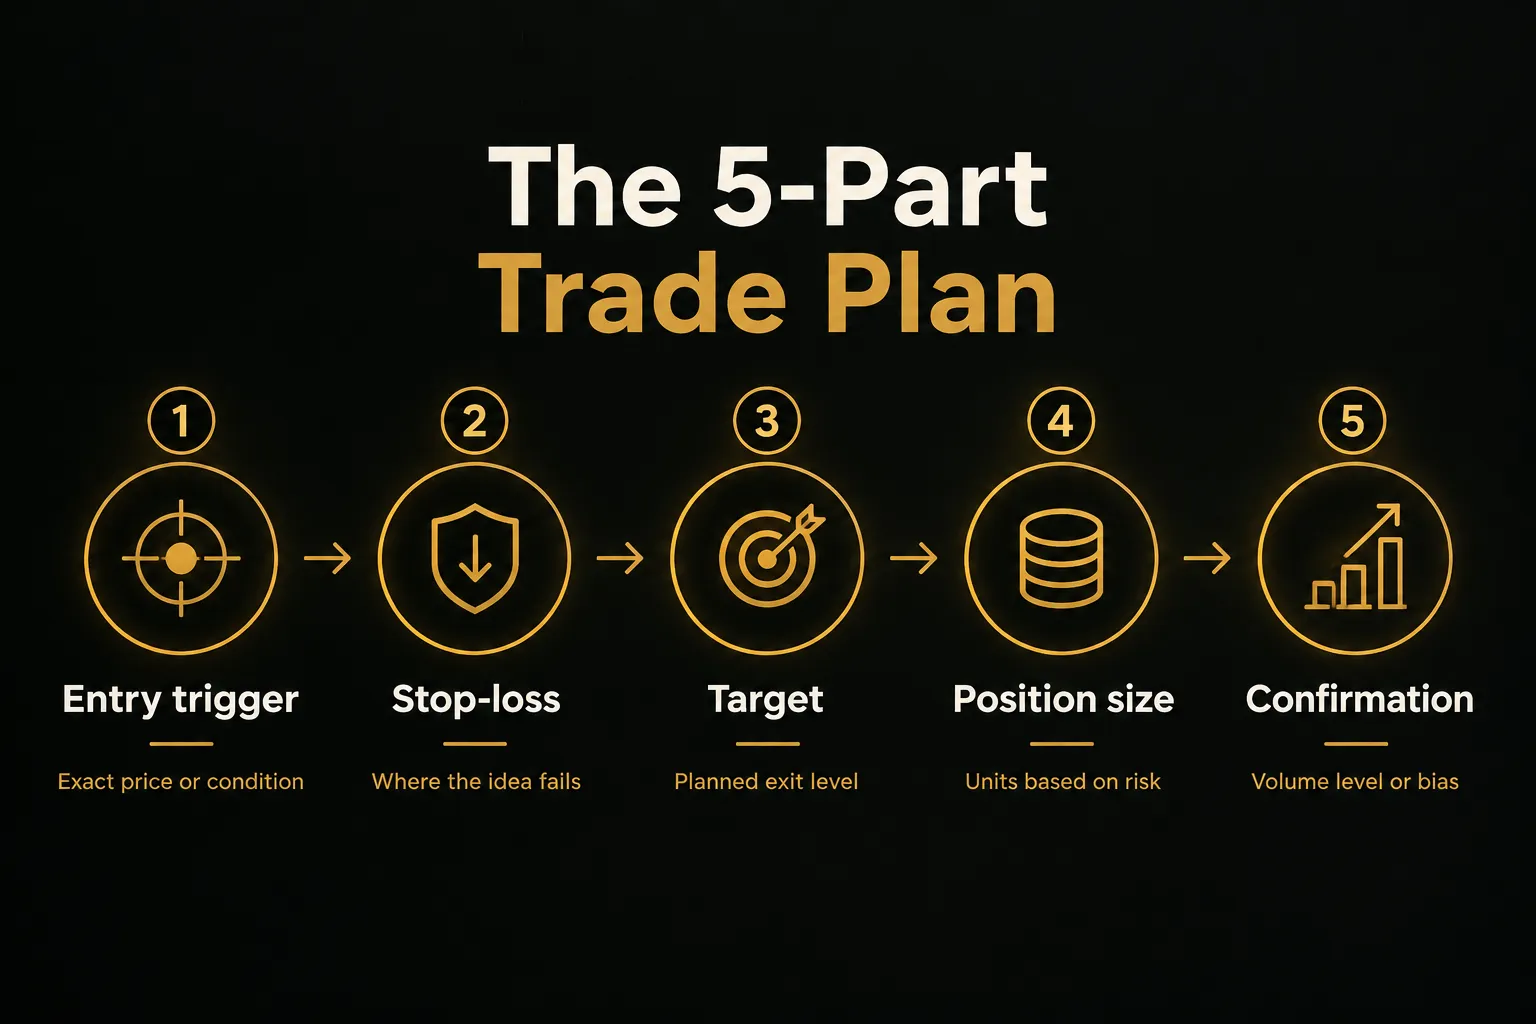
- Define the entry trigger. Specify the exact price or condition, such as “candle close above the session high at 1.0850,” not just “buy when the signal fires.”
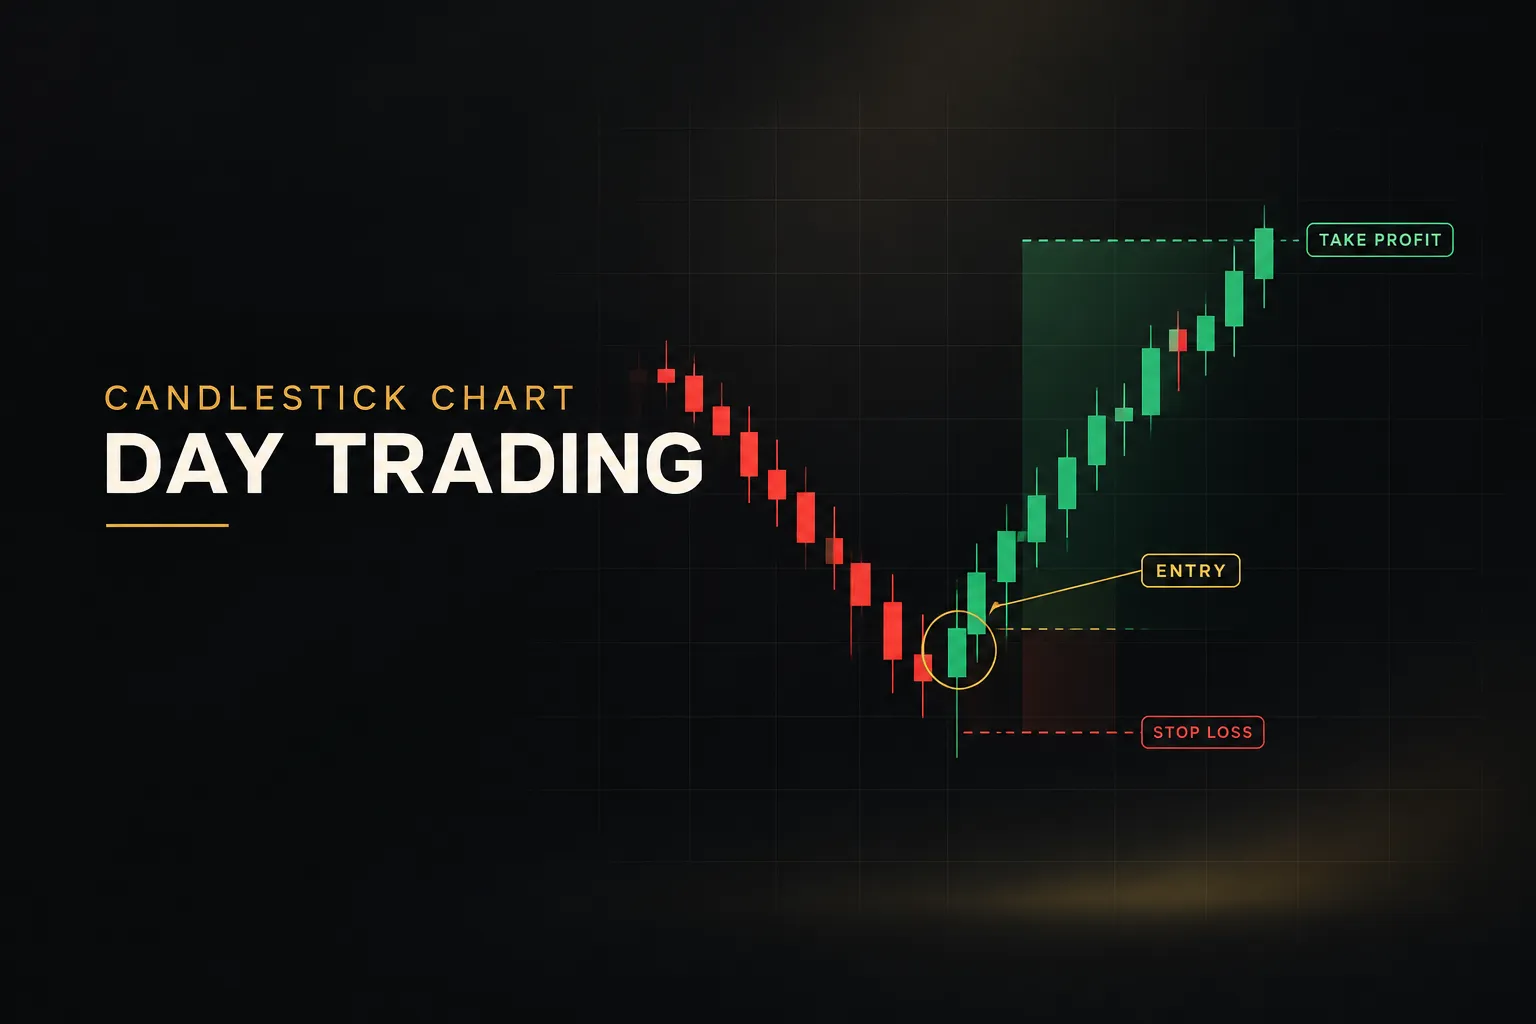
- Set the invalidation point. Place your stop-loss where the trade idea is proven wrong, usually beyond a swing low, a key level, or a multiple of ATR. Stop-loss placement should reflect market structure, not a round number you’re comfortable losing.
- Choose a target. Pick the next logical level, such as prior day high, VWAP, or a supply zone, and check that the risk-to-reward ratio is at least 1:1.5 before entering.
- Calculate position size. Size the trade so that hitting your stop costs a fixed percentage of your account, typically 0.5% to 1% for beginners.
- Require a confirmation condition. Add one independent filter: a volume spike, proximity to support or resistance, or agreement with the higher-time-frame bias.
- Filter out false breakouts. Before entering on a breakout, check four things: relative volume above 1.5x average, a candle close beyond the level (not just a wick), enough room before the next opposing level, and alignment across at least two time frames.
- Write it down before the trade. A plan formed after entry is a rationalization. Log all five components in a journal or spreadsheet before you execute.
PipTrend offers a practical illustration of this separation.
Its color-coded candles indicate direction, but entries come from separately marked session highs and lows, VWAP, or supply and demand zones. Exits are guided by a multi-timeframe table showing whether higher time frames agree.
The value here isn’t a promise of profit.
No tool can offer that.
The value is structural: direction, entry, and exit are three separate decisions, and treating them separately forces discipline that a single “buy” arrow never will.
Stop-Loss and Position Sizing
Position sizing is where most accounts are saved or destroyed.
The math is simple, and it should never be skipped.
- Decide your risk per trade. On a $10,000 forex account, risking 1% means you can lose $100 on this trade.
- Measure the distance to invalidation. Say the signal is long EUR/USD, entry is 1.0850, and the stop sits below the session low at 1.0830. That’s 20 pips of risk.
- Find the value per pip. On a standard lot of EUR/USD, one pip is worth roughly $10, so 20 pips equals $200 per standard lot.
- Divide risk by risk-per-unit. $100 divided by $200 equals 0.5 lots (five mini lots). If price hits your stop, you lose $100, exactly as planned.
- Apply the same logic to stocks. On a $25,000 account risking 1% ($250), with entry at $42.50 and stop at $41.90, the risk per share is $0.60. That gives $250 divided by $0.60, or 416 shares, for a position value of about $17,680.
- Adjust for volatility. If ATR doubles, your stop distance usually widens too, so position size shrinks automatically. Same dollar risk, fewer units.
Notice what this does.
A wider stop never means more risk; it means a smaller position. That single habit prevents the oversized losses that wipe out beginners in their first few months.
Why Signals Fail in Practice
A signal can be logically sound and still lose money consistently. The gap between theory and execution is where most strategies quietly die.
Signals underperform most in three conditions.
Sideways markets trigger trend signals that immediately reverse. Low-liquidity periods, like the midday stock lull or the late Asian forex session, produce moves with no follow-through. And news-driven sessions can override every technical input in seconds, which is why checking the economic news calendar before each session is non-negotiable.
Then there’s execution quality.
Spread, slippage, and latency each chip away at theoretical entries. A scalping signal targeting 5 pips with a 1-pip spread and 1 pip of average slippage has already given up 40% of its target before the trade starts.
False Breakouts and Confirmation
Breakouts are the most popular intraday signal and also the most commonly faked. Price pokes above resistance, triggers buy stops and alerts, then reverses back into the range, trapping everyone who chased.
Breakout confirmation reduces this trap.
Wait for a candle close beyond the level, check that relative volume is elevated, and confirm the higher time frame supports trend continuation. Many traders prefer a retest: let the breakout happen, then take a pullback entry when price returns to the broken level and holds.
You will miss some moves this way.
That’s the cost of filtering out a large share of traps.
Repainting and Hindsight Bias
Signal repainting happens when an indicator changes its past signals after new data arrives. An arrow that appeared at a swing low looks perfect on the historical chart, but in real time it may have shown up three candles late, or appeared and disappeared several times.
Delayed confirmation is a related problem.
Some indicators, such as zigzag or fractal-based tools, only confirm a pivot after several bars have passed. The chart shows a flawless entry at the exact low, yet nobody could have traded it live.
If a signal looks too perfect on a historical chart, assume it repaints until you prove otherwise.
The fix is simple.
Watch the indicator in real time on a live or replay chart for at least a week, and screenshot each signal as it appears. Compare those screenshots to the final chart.
If they differ, the historical record is fiction.
Backtesting Without Fooling Yourself
Good backtesting follows four rules.
First, use a sufficient sample, at least 100 trades and ideally 200 or more spread across trending, ranging, and volatile periods. Second, reserve out-of-sample data (for example, build rules on 70% of your history and test on the untouched 30%).
Third, include realistic transaction costs and slippage on every trade. Fourth, avoid look-ahead bias, which occurs when your rules use information that wasn’t available at the time, like a daily close to trigger a morning entry.
After backtesting, run a period of forward testing on a demo or small live account before scaling up.
Then judge results by the right numbers.
Win rate alone misleads.
Trade expectancy is the average amount you make per trade: (win rate × average win) minus (loss rate × average loss).
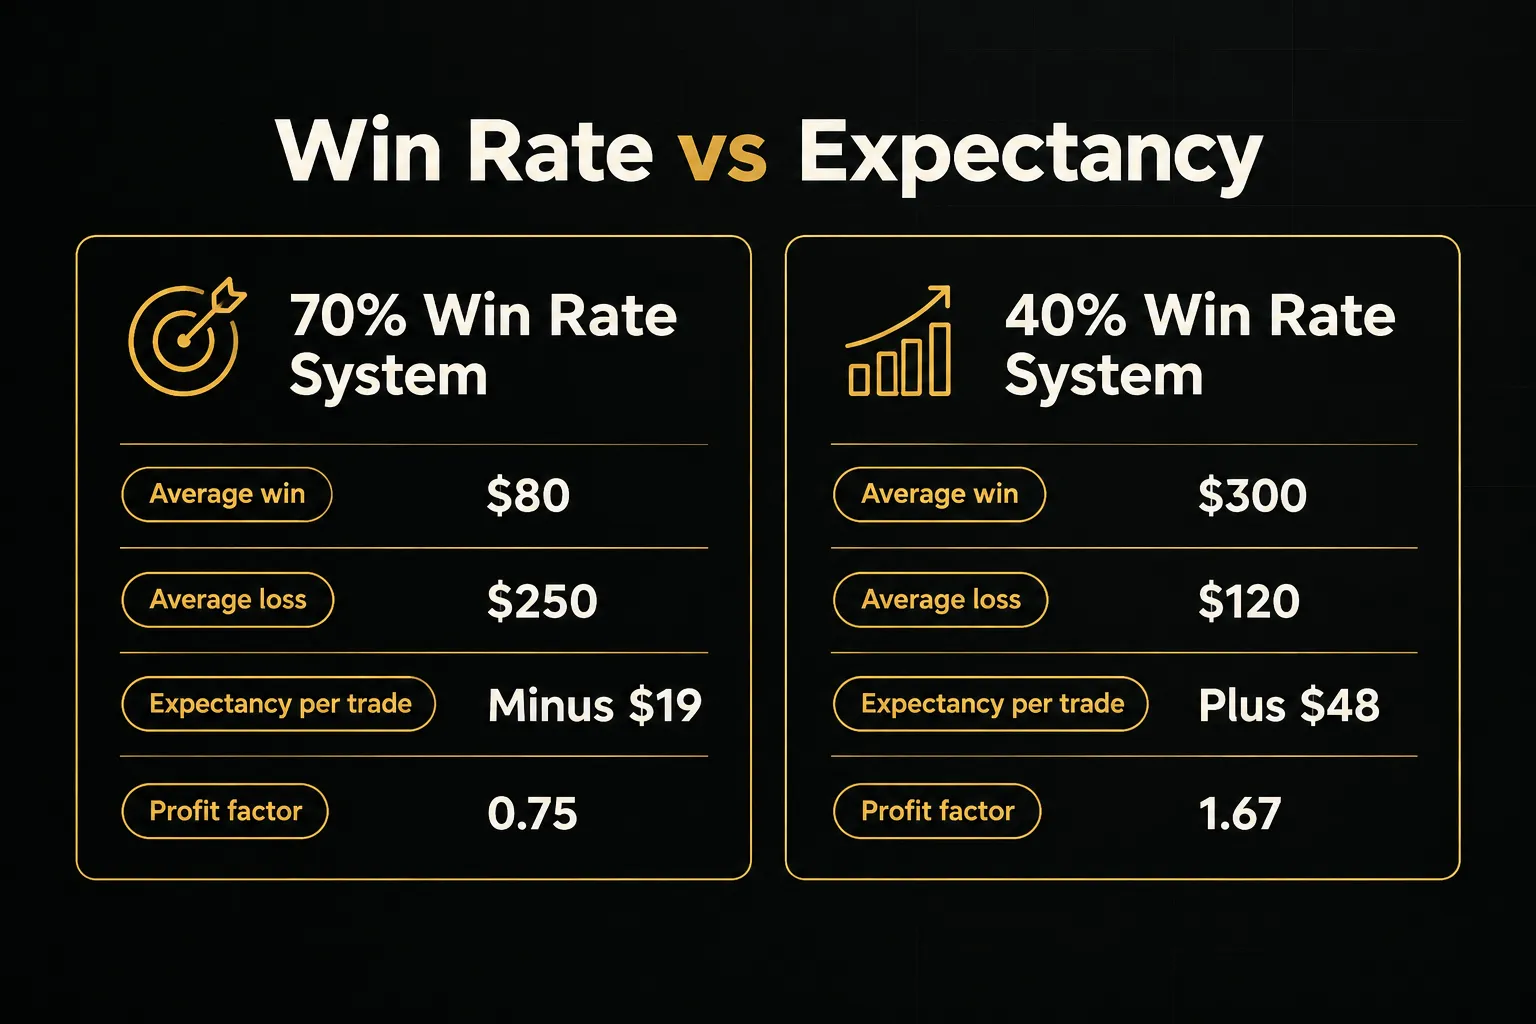
The 40% system wins: 0.40 × $300 minus 0.60 × $120 equals +$48 per trade. The 70% system, with average wins of $80 and losses of $250, loses $19 per trade despite feeling great most days.
Profit factor (gross profits divided by gross losses) should sit above 1.3 after costs, and maximum drawdown tells you the deepest peak-to-trough loss you must be able to stomach.
Finally, the psychological risks.
Chasing alerts after the move has already happened, revenge trading after a loss, and oversizing after a winning streak all destroy positive expectancy.
A good system traded emotionally becomes a bad system.
Intraday Signal FAQs
What is the most accurate indicator for intraday trading?
No single indicator is universally the most accurate for intraday trading. Accuracy depends on matching the tool to the current regime: EMAs and ADX in trends, RSI or stochastics in ranges, and VWAP in rotational sessions.
Whatever you choose, confirm it with price action and market structure. An indicator reading that contradicts clear structure is usually the one that’s wrong.
Which indicator gives buy and sell signals?
Both trend-following overlays and momentum oscillators generate buy and sell signals, but they answer different questions.
Moving average crossovers and trend-detection candles tell you direction. RSI, stochastics, and MACD tell you whether momentum is building or exhausting.
Using one of each, rather than two of the same type, gives you genuinely independent information.
How do you identify intraday trading opportunities?
You identify intraday trading opportunities by combining higher-time-frame bias, session liquidity levels, and volume or volatility filters. Start with the 1-hour or 4-hour trend, mark the prior day’s high and low, the session open, and VWAP, then wait for price to react at those levels with above-average relative volume.
Watching one indicator alone rarely surfaces quality setups.
Levels plus context do.
What is the best strategy for intraday trading?
A realistic intraday strategy pairs one directional signal with one confirmation layer and predefined risk rules. For example: trade in the direction of the 21 EMA on the 15-minute chart, enter only at a key level with relative volume above 1.5x, and risk no more than 1% per trade.
Simple strategies are easier to test, easier to follow under pressure, and easier to diagnose when something stops working.
Are trading signals worth it?
Trading signals are worth it only when they are verified with transparent, timestamped track records that include losses.
Cherry-picked screenshots of winning trades prove nothing.
Ask any provider for a full trade log with entry times, exits, and drawdowns. If they won’t share one, treat the service as marketing rather than analysis.
How do you confirm a trade signal?
You confirm a trade signal with a candle close beyond a key level, supporting volume, and alignment across at least two time frames. A wick through resistance on low volume against the higher-time-frame trend is not confirmation.
It’s a warning.
Build these three checks into your written plan so confirmation becomes automatic rather than a judgment call made mid-trade.
The One Rule That Matters Most
Signals don’t make money.
Plans do.
A signal only tells you direction or momentum.
Your actual edge comes from everything you build around it: the entry level, the stop-loss placement, the position sizing, and the confirmation filter that keeps you out of low-quality setups. Two traders can follow the identical signal and get opposite results based on those decisions alone.
So here’s one concrete action for tonight.
Pick a single instrument, whether that’s EUR/USD, the S&P 500 E-mini, or one liquid stock. Before the next session opens, write out the five-part trade plan template: entry trigger, stop-loss, target, position size, and confirmation condition.
Then paper trade it.
Log at least 20 setups with screenshots, including every loss, before a single real dollar goes on the line. You’ll learn more from those 20 honest entries than from any new indicator.
Because the traders who last aren’t the ones with the most alerts or the fanciest dashboards. They’re the ones who verify everything, follow their rules consistently, and let the math work over hundreds of trades.
That’s the whole game.
Sources
Risk Disclaimer: Trading involves risk. Past performance doesn't guarantee future results. Only trade with money you can afford to lose. PipTrend is a tool to assist your trading decisions, not financial advice.