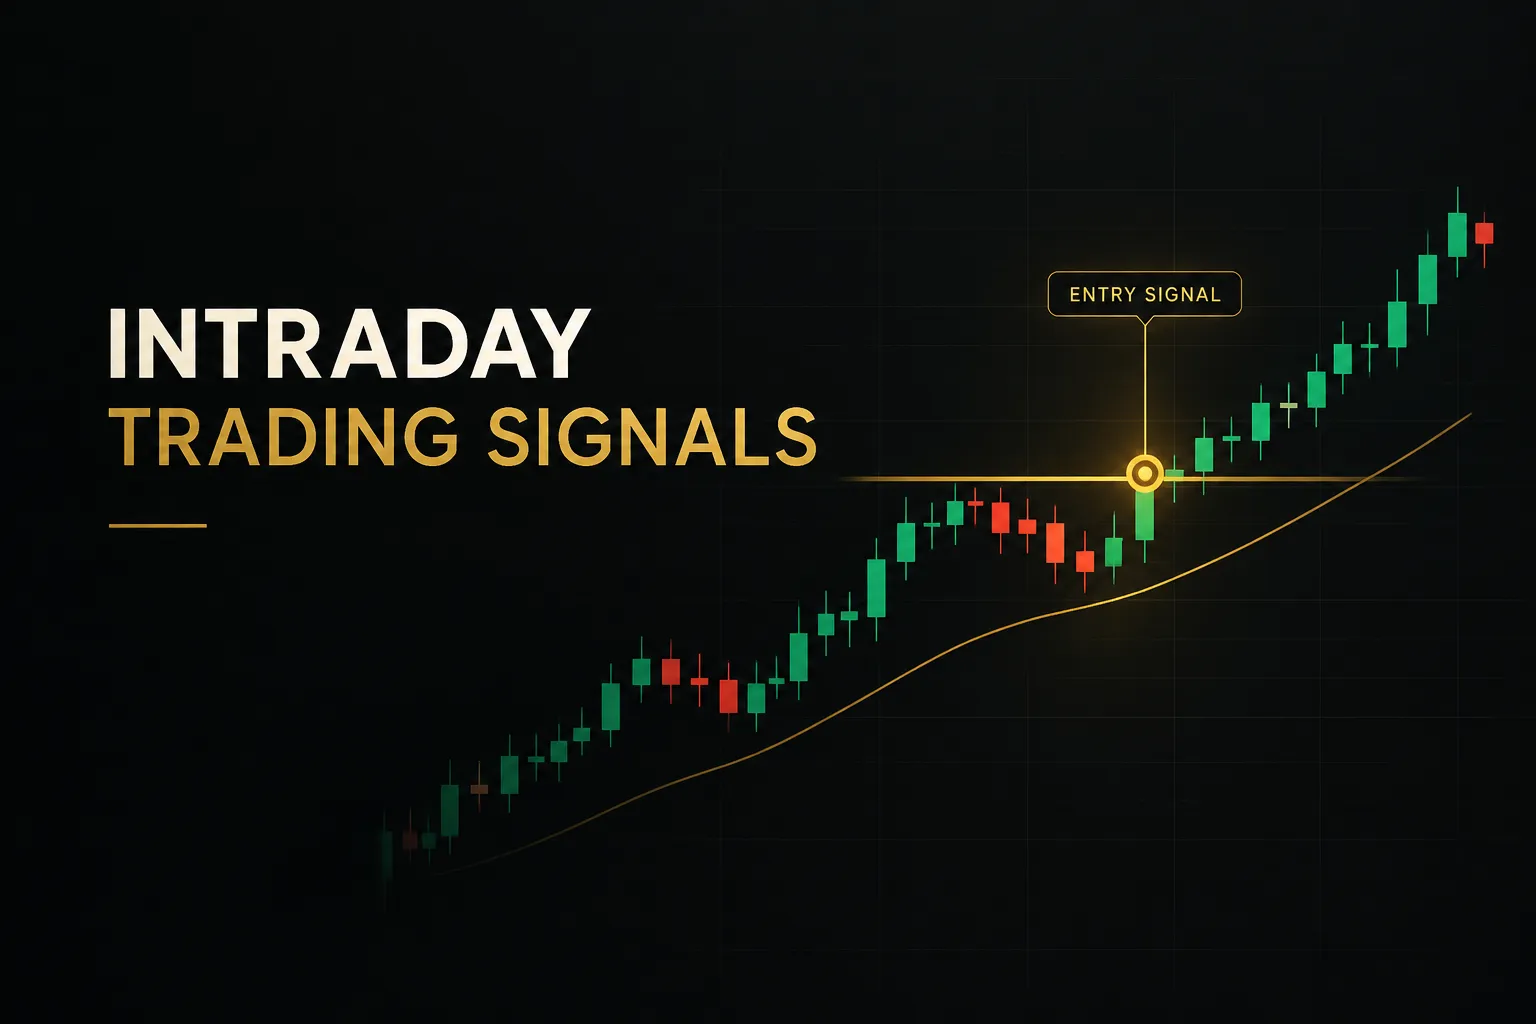
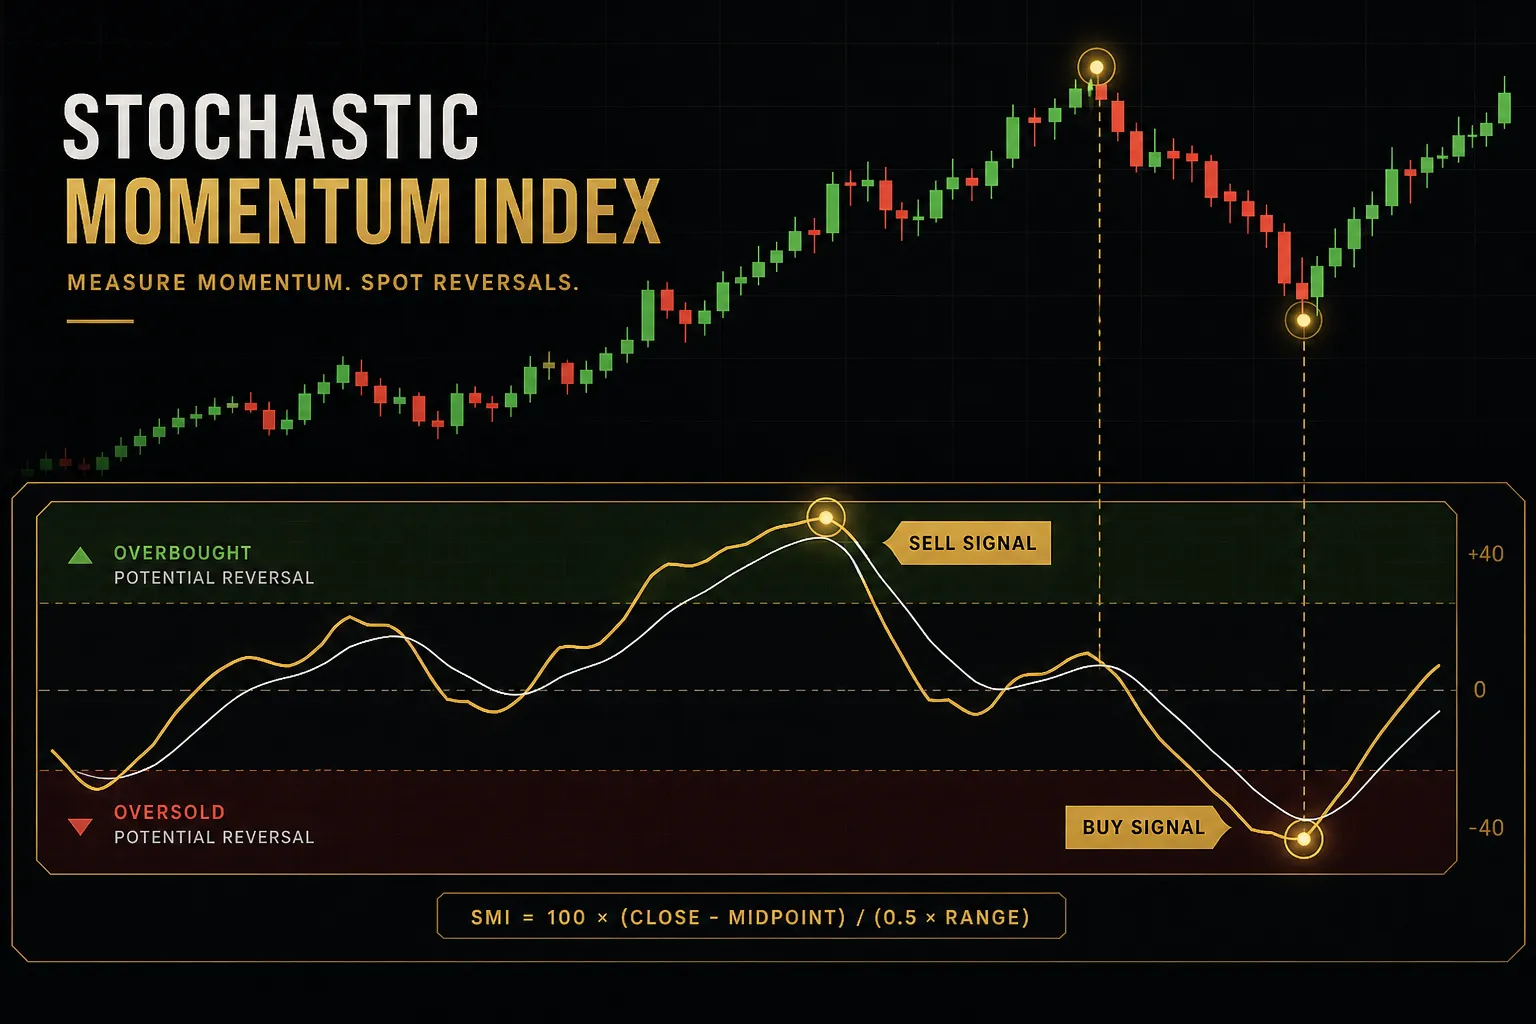
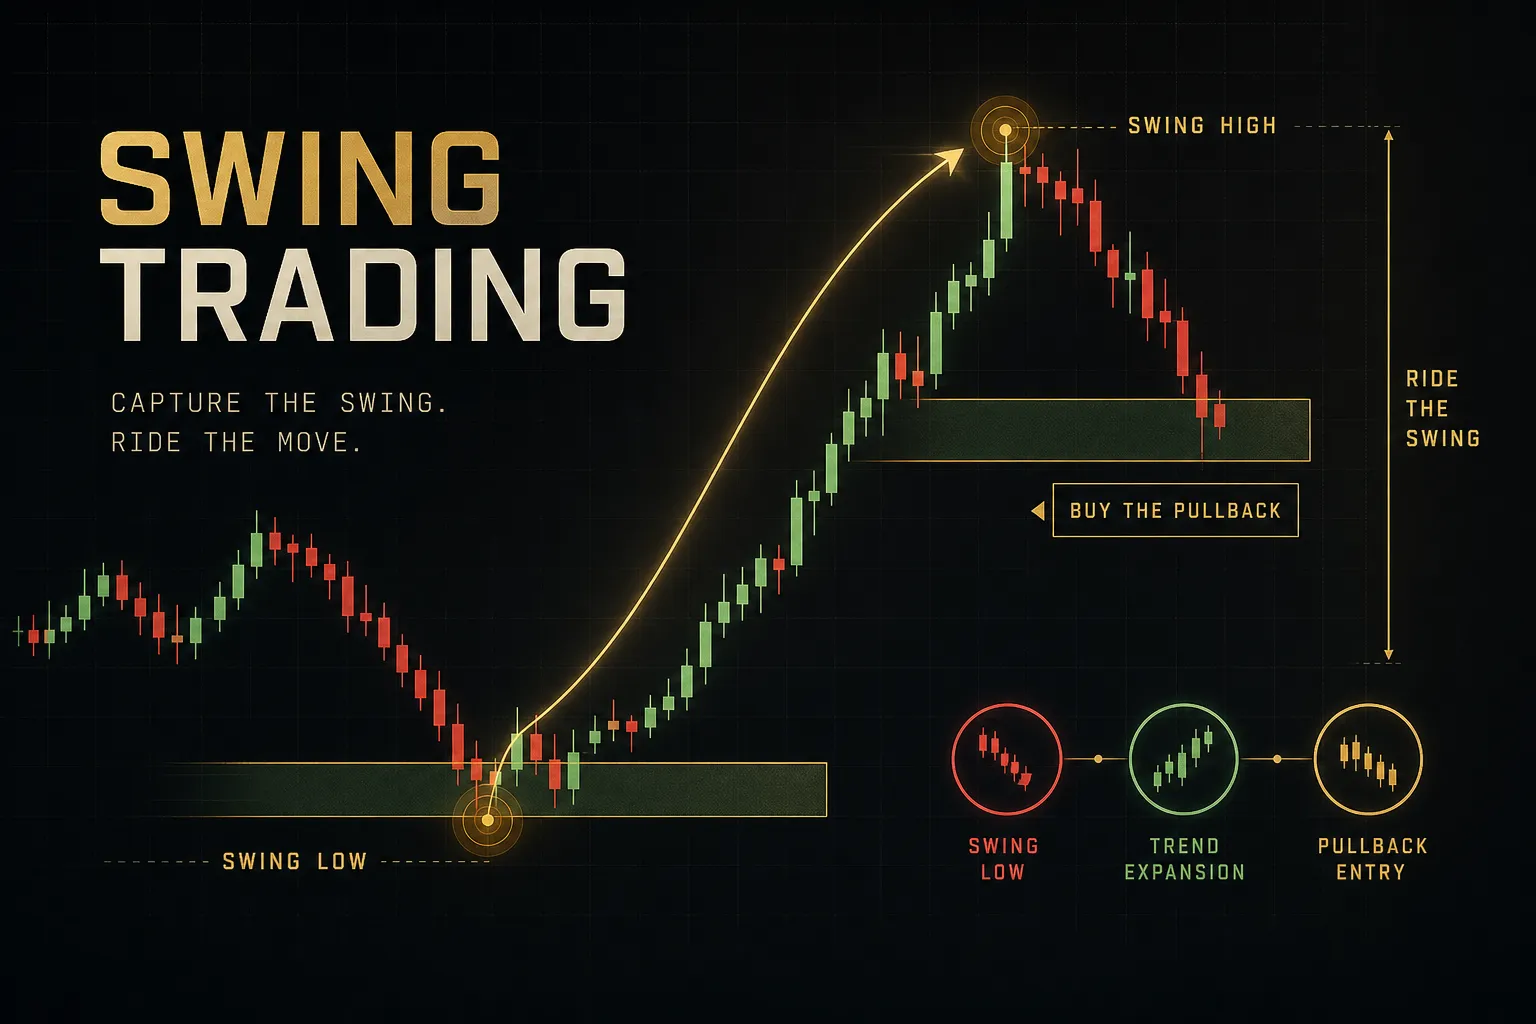
Candlestick Charts for Day Trading: A Decision Framework
On this page
Why Candlestick Patterns Alone Won’t Save Your Trades
A hammer printing at support looks like a gift. The same hammer printing in the middle of a choppy range is a coin flip dressed up as a signal.
Most beginners can’t tell the difference, and it costs them.
The typical guide to candlestick chart day trading shows a gallery of perfect shapes: the textbook engulfing bar, the flawless doji, the three-candle morning star. What those guides rarely show is context. They skip where the pattern formed, which timeframe it appeared on, what confirmed it, and what would prove it wrong.
So traders do the natural thing. They memorize names, scan for shapes, and enter the moment something looks familiar.
Then they wonder why a “reliable” pattern fails four times in a row.
This guide replaces memorization with a decision framework built on six layers:
Anatomy (what a single candle actually tells you), context (where the pattern sits in market structure), timeframe behavior (how the same shape changes meaning on a 1-minute versus a 15-minute chart), confirmation (what has to happen after the pattern), risk (where you’re wrong and what you stand to gain), and testing (proving the idea works before money is on the line).
One principle runs through every section, so it’s worth stating plainly up front.
A candlestick is a clue, not a signal, until it’s confirmed by structure and volume.
Keep that sentence in mind. Everything that follows is just a more detailed version of it.
Reading the Anatomy of a Candle
Every candle is a four-number summary of a fight. Buyers and sellers traded for a set period, and the candle records where that fight started, how far each side pushed, and who was standing when time ran out.
Read it that way and patterns stop being shapes.
They become stories.
Body, Wick, and What They Reveal
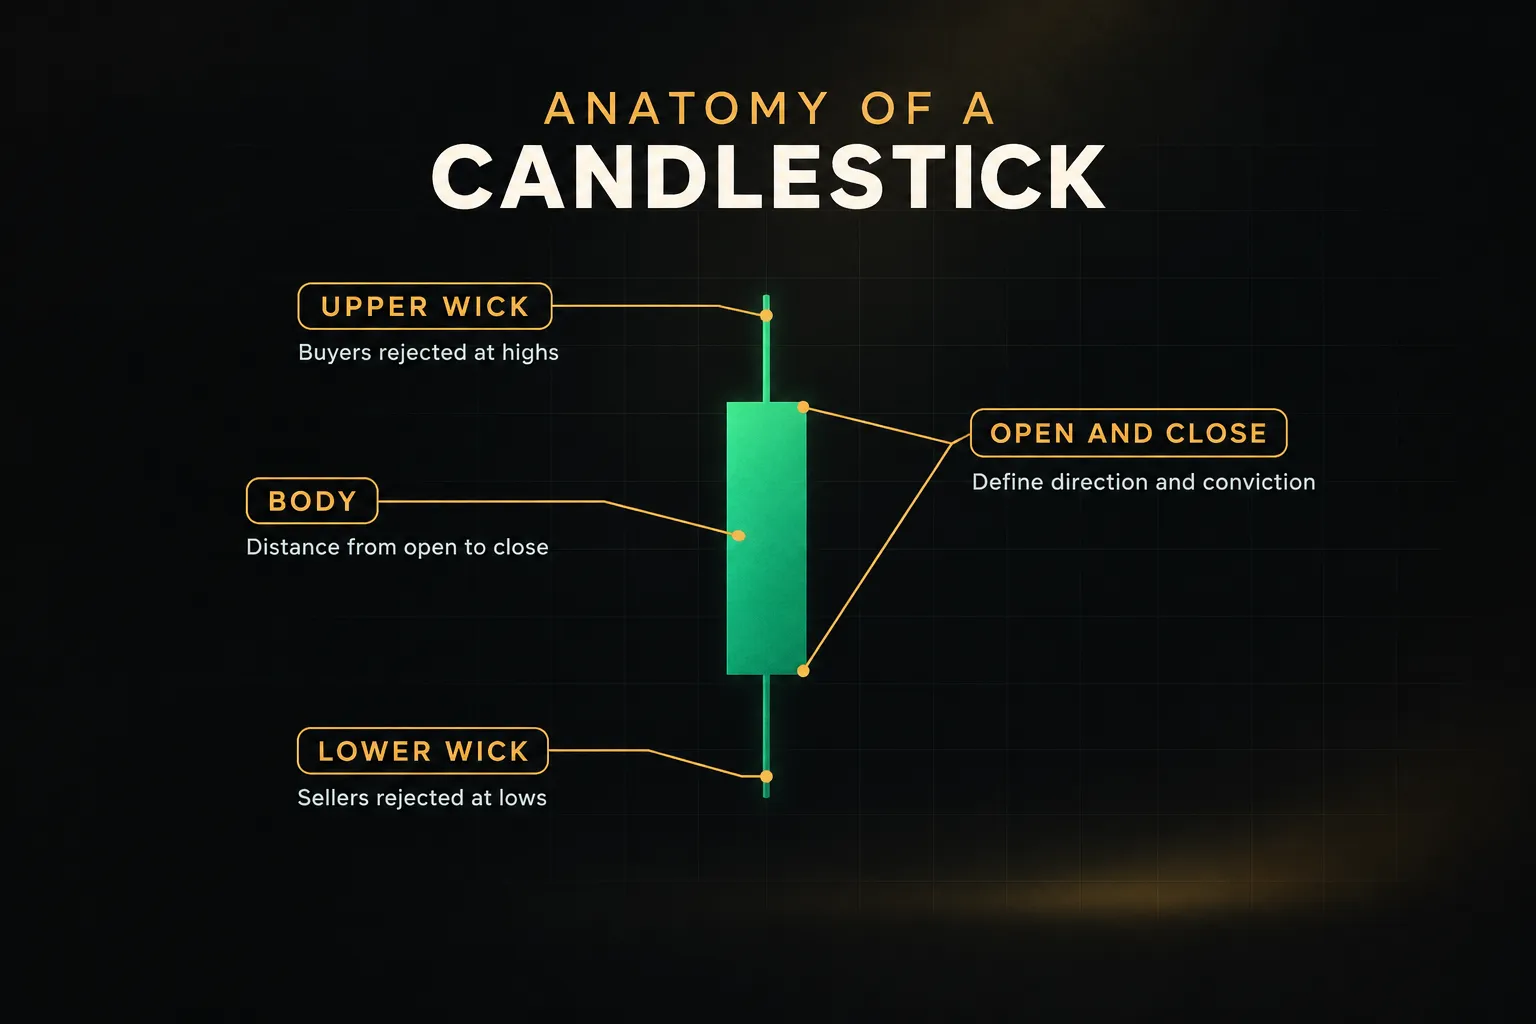
Each candle is built from open, high, low, close (OHLC) data. The open is the first traded price of the period, the close is the last, and the high and low mark the extremes reached in between.
The rectangle between open and close is the body. The thin lines above and below are the wicks, sometimes called shadows.
Color tells you direction.
Bullish and bearish candles differ only in whether price closed above the open (bullish, usually green or white) or below it (bearish, usually red or black).
But direction is the least interesting part.
The real information lives in the relationship between the candlestick body and wick.
A long body with small wicks signals conviction: one side controlled the entire period and closed near the extreme. A small body with long wicks signals indecision or rejection, because price traveled far and then got pushed back.
Think of wicks as footprints of failed attempts.
A long upper wick means buyers drove price up, but sellers pushed it back down from the highs before the close. A long lower wick means the opposite: sellers pressed price lower, and buyers absorbed the selling and drove it back up.
Here’s a quick way to read conviction.
If the body makes up more than roughly 70% of the candle’s total range, one side dominated. If the body is under 25% of the range, the market is either undecided or actively rejecting a price level.
Location matters just as much.
A long lower wick at a known support level suggests buyers are defending that zone. The same wick in the middle of nowhere tells you very little.
Completed vs Forming Candles
Here’s a mistake that burns almost every new trader at least once. You see a beautiful hammer forming on the 5-minute chart, with a long lower wick and a small body near the top.
You buy.
Then, in the last 90 seconds of the bar, sellers step in and the candle closes as a full red bar at the lows.
That hammer never existed.
It was an intrabar illusion, a candle still forming whose shape could change completely before the close.
A forming candle is a live negotiation. Until the period ends, the high, low, and close are all provisional.
A shooting star can become a bullish marubozu. A doji can become an engulfing bar.
And acting early means acting on data that doesn’t yet exist.
The fix is simple, if a little uncomfortable.
Wait for the candle to close on your chosen timeframe before treating any pattern as valid. If you trade the 5-minute chart, the pattern is real only when the 5-minute bar is finished.
Yes, waiting sometimes means a slightly worse entry price. That cost is small compared with repeatedly entering setups that dissolve before they form.
Patterns That Matter (and Where They Occur)
There are over 100 named candlestick patterns.
You need maybe five.
The rest are either rare, redundant, or so dependent on context that the name adds nothing.
What separates a useful pattern from a useless one isn’t the shape.
It’s the location.
Every pattern below carries meaning only at support and resistance, at the edges of a range, or at exhaustion points after an extended trend move. In the middle of a range, they’re mostly noise.
The Few Patterns Worth Learning
These are the patterns that consistently show up in serious price action trading, along with the specific context each one needs to mean anything.
- Hammer and shooting star: A hammer has a small body near the top and a lower wick at least twice the body’s length, signaling that sellers were rejected. A shooting star is the inverse, with a long upper wick showing buyers were rejected. Look for hammers at support after a decline and shooting stars at resistance after a rally.
- Bullish and bearish engulfing: A two-candle pattern where the second body completely covers the first body in the opposite direction. It shows a sharp shift in control within a single bar. Engulfing patterns carry the most weight when they reclaim a key level, such as a bullish engulfing bar that closes back above broken support.
- Doji: The open and close are nearly identical, leaving a tiny or nonexistent body. A doji alone signals indecision, not reversal. After a strong trend leg into a major level, though, it can mark the moment momentum stalled.
- Morning star and evening star: Three-candle reversal patterns. A morning star shows a strong bearish candle, a small indecision candle, then a strong bullish candle closing well into the first candle’s body. The evening star mirrors this at tops, and both need a clear prior trend to reverse.
- Inside bar: A candle whose entire range sits within the previous candle’s range. It represents compression, and the breakout direction often sets the next move. Inside bars work well as confirmation tools after one of the reversal patterns above.
For beginners, the practical advice is blunt: learn four to six patterns deeply rather than memorizing a full glossary. Knowing exactly how a bearish engulfing bar behaves at the session high on your market beats vaguely recognizing 40 exotic formations.
Same Shape, Different Timeframe
A hammer on the 1-minute chart and a hammer on the 1-hour chart share a name and nothing else. The lower the timeframe, the less information each candle contains and the more easily it gets distorted.
- 1-minute chart: Each bar reflects just 60 seconds of trading, often on thin volume. The bid-ask spread alone can create wicks that look meaningful but reflect nothing more than a few market orders. False pattern completions are frequent, and they spike during low-liquidity periods.
- 5-minute chart: The most popular intraday timeframe for good reason. Bars contain enough volume to filter out much of the spread noise while still giving timely entries. Patterns here remain vulnerable to sudden news spikes.
- 15-minute chart: Noise drops noticeably, and patterns at key levels tend to hold more often. The tradeoff is speed, since you’ll wait longer for confirmation and your stops will be wider in dollar terms.
- 1-hour chart: Too slow for most day-trade entries, but extremely useful for establishing higher-timeframe bias. A bullish engulfing bar on the hourly at support gives meaningful direction for trades taken on lower timeframes.
So are patterns more reliable on 5-minute or 15-minute charts? The honest answer is that higher timeframes filter more noise, but they cost you entry speed and require wider stops.
A 5-minute pattern gets you in earlier with a tighter stop and a higher chance of being shaken out. A 15-minute pattern is cleaner but slower.
Neither wins universally.
Your choice should depend on the instrument’s volatility (measured by average true range), your account size, and how much screen time you have.
When a Bullish Setup Turns Bearish
Failed patterns aren’t random noise. Often they’re the next signal, and a very good one.
Here’s how that plays out in practice:
- A stock sells off into a support zone around $50.20 and prints a textbook hammer, with its low at $49.80 and a close near $50.35.
- Pattern-focused traders buy the next candle, placing stops just below the hammer’s low at $49.75.
- Two bars later, sellers push price through $49.80 on a clear volume spike. The hammer’s entire premise (buyers defending support) is now invalidated.
- Every stop sitting below $49.80 triggers at once. Those forced sell orders add fuel, and price drops quickly to $49.10.
What looked like a reversal became a bearish continuation.
The failure told you something concrete: buyers tried, lost, and are now trapped. Experienced traders watch for exactly this sequence, because a broken pattern often produces a sharper move than a successful one.
The lesson is to define what would invalidate a setup before you enter. That same invalidation level can become your trigger in the opposite direction.
Turning a Pattern Into a Complete Setup
A pattern is an observation.
A setup is a plan.
The difference is a set of objective rules that tell you exactly when to get in, where you’re wrong, and where you’ll take profit, before emotion has any say.
Confirmation Candle and Entry Trigger
Most beginners enter on the pattern candle itself.
That’s one step too early.
The pattern shows a possible shift, and the confirmation proves the shift is actually happening.
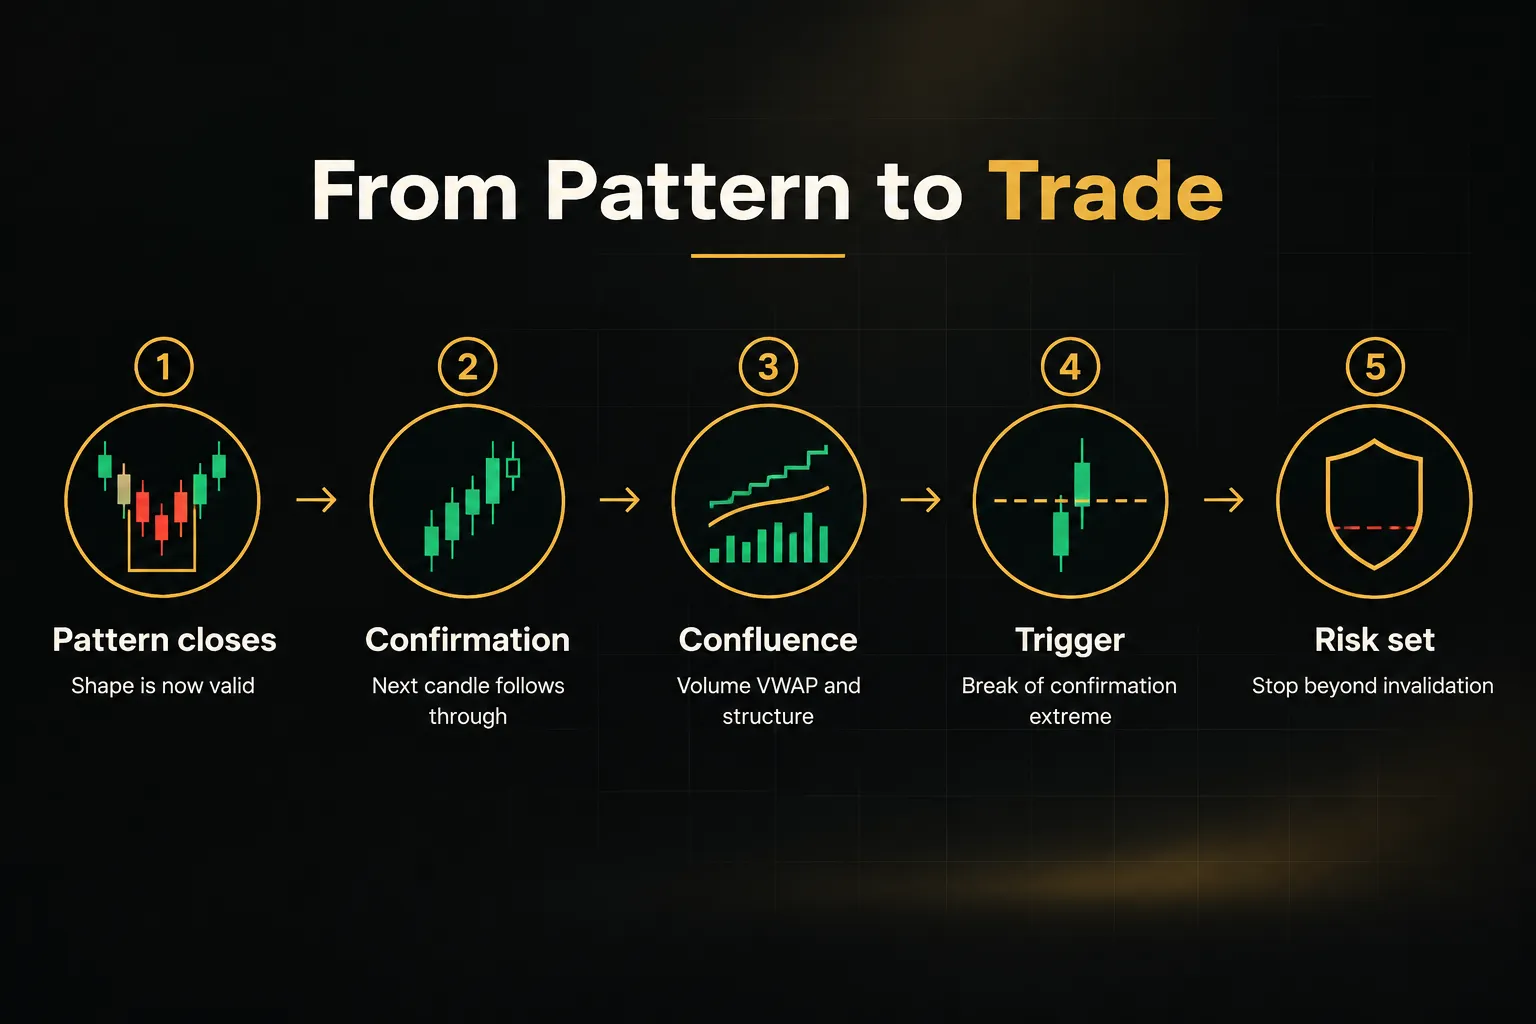
- Wait for the pattern candle to close. As covered earlier, a forming candle can change shape completely, so the pattern only counts once the bar is finished.
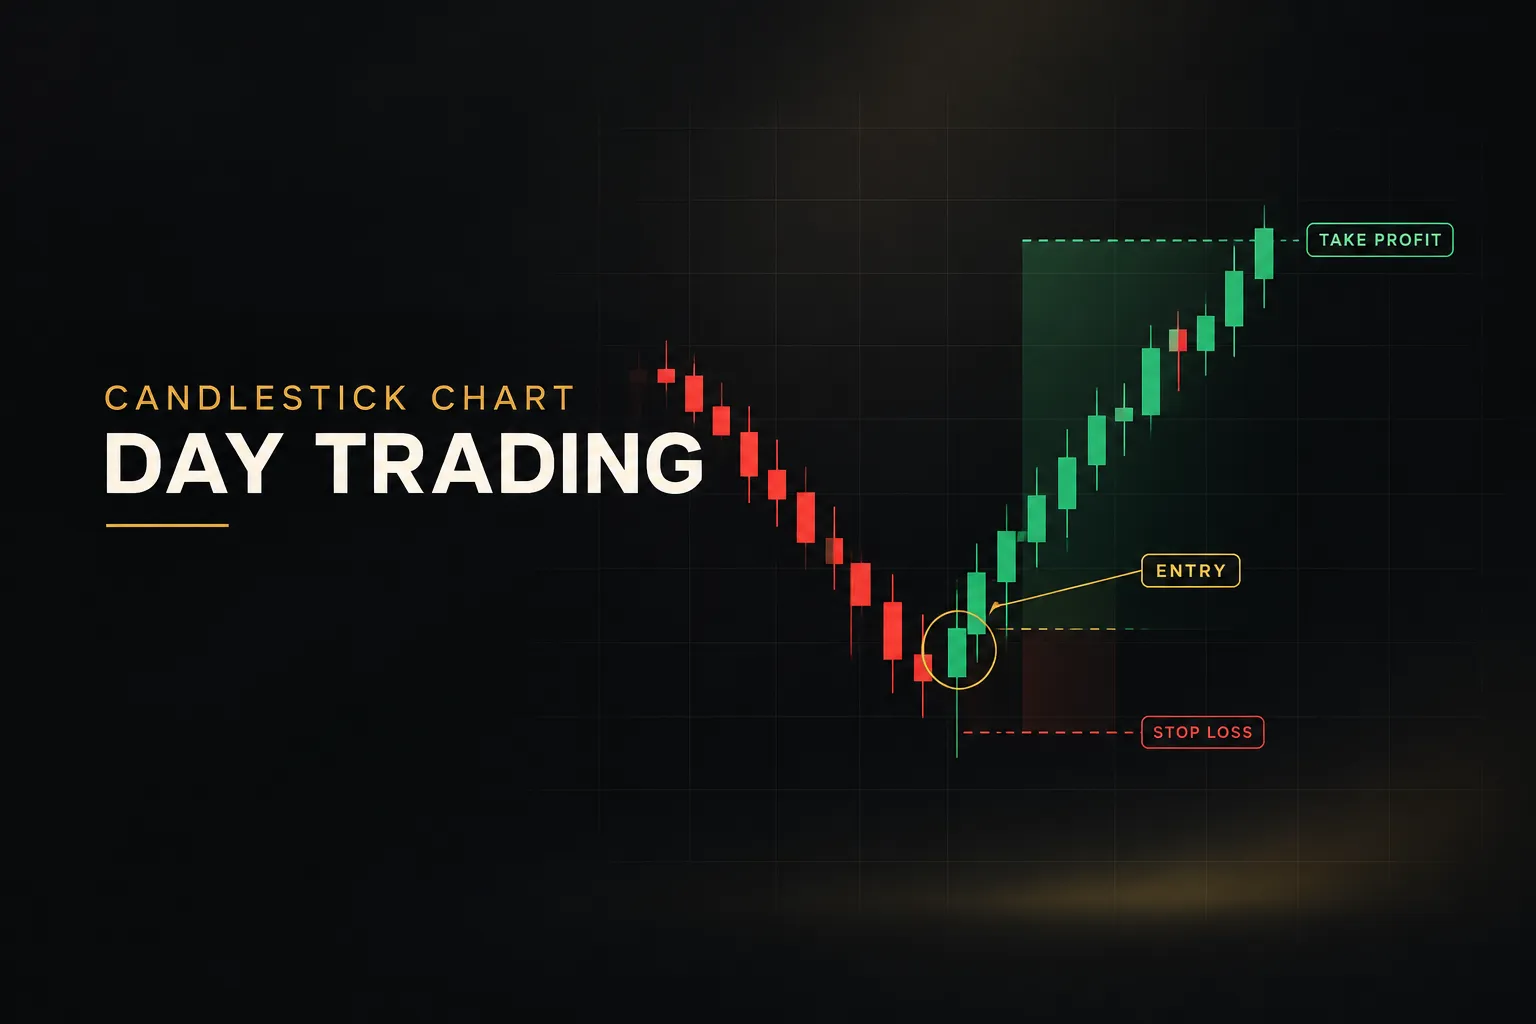
- Watch the next candle (the confirmation candle). For a bullish pattern, you want this candle to show follow-through, ideally closing above the pattern’s high. For a bearish pattern, you want a close below the pattern’s low.
- Set an objective entry trigger. Enter on a break of the confirmation candle’s high (for longs) or low (for shorts). This removes guesswork and ensures price is actively moving in your direction when you enter.
- Cancel if the trigger doesn’t fire within a set window. If price doesn’t break the trigger level within two or three bars, the momentum likely isn’t there, and you move on.
Stop-Loss, Targets, and Invalidation
Where does the trade stop making sense? Answer that first, and the stop placement follows naturally.
- Place the stop beyond the pattern’s invalidation point. For a hammer, that’s just below the lower wick. For a bearish engulfing bar, it’s just above the high of the engulfing candle. Add a small buffer, often 10% to 20% of the average true range, so ordinary noise doesn’t knock you out.
- Measure your risk in price terms. The distance from entry to stop defines one unit of risk (1R). Every target is then measured in multiples of that unit.
- Set targets using structure or a fixed ratio. Structure-based targets use the nearest prior swing high or low, VWAP, or the session extreme. Ratio-based targets use a fixed reward-to-risk, such as 2R, meaning you aim to make twice what you’re risking.
- Skip trades where the nearest target is under 1.5R. If resistance sits just above your long entry, the math doesn’t justify the trade no matter how clean the pattern looks.
Confirming With Volume, VWAP, and Structure
Two patterns can look identical and have completely different odds. What separates the real setup from the lookalike is confluence: multiple independent factors pointing the same way.
- Check volume confirmation. A reversal pattern on volume at least 1.5 to 2 times the recent average shows real participation. The same pattern on shrinking volume suggests nobody cares, and those are the setups that fail quietly.
- Note the price’s position relative to VWAP. The volume-weighted average price acts as an intraday fair-value line that institutions watch closely. Bullish patterns above VWAP, or reclaiming it, carry more weight than bullish patterns sitting well below it.
- Confirm the location in market structure. Is the pattern at the session high or low, a prior day’s level, or a clear supply or demand zone? Patterns at these levels have a reason to work, while patterns in empty space do not.
- Check higher-timeframe alignment. A bullish 5-minute pattern inside a 1-hour uptrend has the wind at its back. The same pattern against the hourly trend is fighting the current.
- Factor in time of day. Patterns during the opening range (roughly 9:30 to 10:00 a.m. ET for US equities) form amid heavy volatility and frequent fakeouts. Lunchtime consolidation (around 11:30 a.m. to 1:30 p.m. ET) brings thin volume and unreliable signals. Power hour (3:00 to 4:00 p.m. ET) often restores momentum and gives patterns more weight again.
Tracking all of this across several charts gets tedious fast. Tools like PipTrend offer a structured way to handle it: its multi-timeframe table shows directional alignment at a glance, while marked entry levels such as session highs and lows, VWAP, and supply and demand zones show where a trade would actually make sense.
The useful part is the separation.
Direction signals tell you which way to lean, and entry levels tell you where to act. That reinforces the confirmation-before-entry principle rather than replacing it.
A tool like this speeds up context-reading.
It doesn’t do the thinking for you.
Testing, Expectancy, and Risk Reality
Here’s an uncomfortable truth: most traders never find out whether their strategy works. They trade it live, remember the wins vividly, rationalize the losses, and draw conclusions from a sample of maybe a dozen trades.
That isn’t evidence.
It’s anecdote.
Backtesting Without Fooling Yourself
A backtest is only as honest as its rules.
Write your rules down before you look at a single chart: which pattern, which timeframe, what counts as confirmation, where the entry, stop, and target go. If a rule can’t be written precisely, it can’t be tested.
Next, use bar replay or tick data rather than scrolling through static historical charts. Most modern charting platforms offer a replay mode that reveals candles one at a time.
That matters because static charts let your eye see what happened next, which quietly corrupts every decision.
This is called look-ahead bias, and it’s the most common way traders fool themselves.
The rule is simple.
Only use information available at the close of the current candle. If you wouldn’t have known it in real time, it doesn’t count.
Log every trade.
Every single one, especially the ugly losers you’re tempted to explain away as “not a real setup.”
Record the date, time, entry, stop, target, outcome in R-multiples, and a note on context. After 50 to 100 trades, patterns in your own results start to emerge.
Win Rate Isn’t Expectancy
Traders obsess over win rate.
It’s the wrong number.
What actually determines profitability is expectancy, the average amount you make or lose per trade over many trades.
The formula: Expectancy = (Win rate × Average win) − (Loss rate × Average loss).
Take a strategy that wins only 40% of the time, with an average win of $300 and an average loss of $100. Expectancy is (0.40 × $300) − (0.60 × $100) = $120 − $60 = +$60 per trade.
You lose more often than you win and still make money.
Now flip it.
A strategy wins 80% of the time, but the average win is $50 and the average loss is $250 (a classic result of moving stops or holding losers). Expectancy is (0.80 × $50) − (0.20 × $250) = $40 − $50 = −$10 per trade.
Feels great.
Loses money.
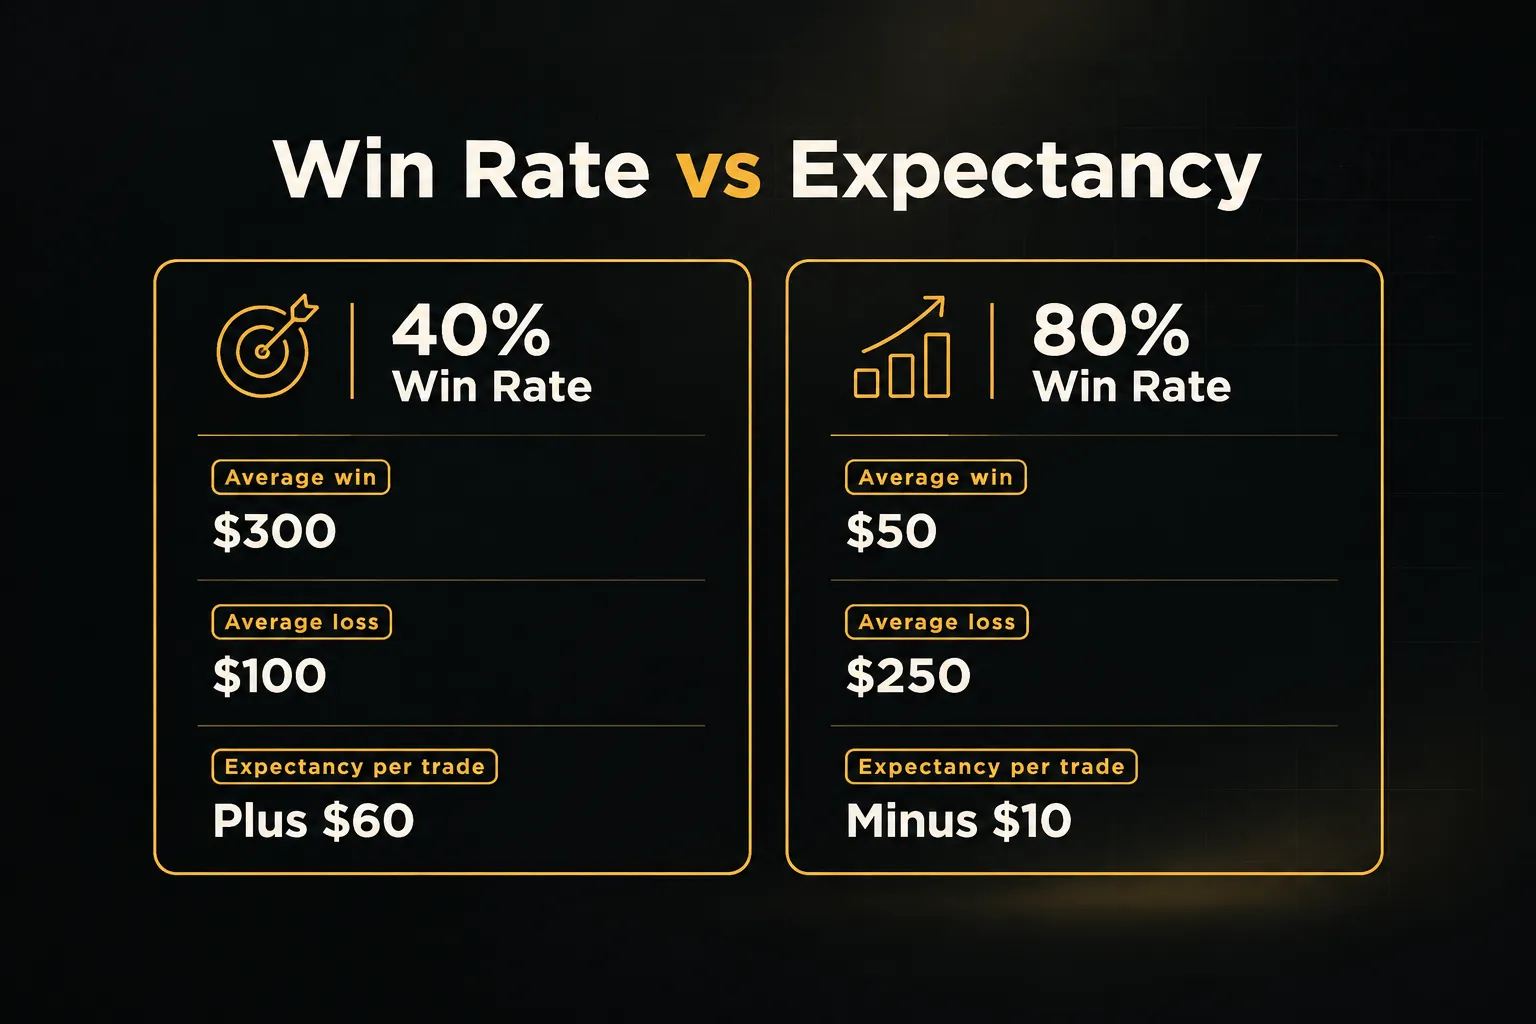
This is why candlestick patterns work statistically, not individually.
Any single pattern can fail. A well-defined setup with positive expectancy, executed consistently, is what produces results over hundreds of trades.
Rules Every Day Trader Should Check
Even a positive-expectancy strategy can bleed out through friction and poor discipline. Three risks deserve particular attention.
Spread and slippage matter more intraday than most traders realize. If your average target is $0.30 and you lose $0.04 on each side to spread and slippage, that’s more than 25% of your gross profit gone.
Always include realistic costs in your backtests.
Overtrading is the second killer.
Taking every pattern you see, rather than only the ones with full confluence, dilutes your edge with low-probability trades. Fewer, better setups almost always beat more, weaker ones.
News-driven volatility can erase technical levels in seconds.
Earnings releases, CPI prints, and Federal Reserve announcements routinely blow through support and resistance that held for weeks. Check the economic calendar each morning and consider standing aside around major releases.
Finally, a regulatory note for US-based traders.
The FINRA pattern day trader rule has historically required $25,000 in minimum account equity for margin accounts making four or more day trades within five business days. FINRA has been reviewing and proposing changes to these requirements, so as of 2026, confirm the current pattern-day-trader and margin rules directly with your broker instead of relying on figures you read online.
Common Questions About Candlestick Day Trading
What is the best candlestick pattern for day trading?
No single pattern is best; the engulfing pattern at a key level is among the most practical for day traders. It shows a clear shift in control within one bar and offers an obvious invalidation point.
But any pattern’s value depends on location, volume confirmation, and higher-timeframe alignment far more than on its shape.
Do candlestick patterns actually work for day trading?
Yes, candlestick patterns work when traded as part of a complete setup with defined risk.
They work statistically across many trades, not on a single-trade basis. A pattern at support with volume and structure behind it tilts the odds, and positive expectancy comes from repeating that edge with consistent stops and targets.
What is the most accurate time frame for day trading?
There is no universally most accurate timeframe, but the 5-minute and 15-minute charts offer the best balance for most day traders.
The 5-minute chart gives faster entries with more noise, while the 15-minute chart filters noise at the cost of speed and wider stops. Many traders use the 1-hour chart for bias and a lower timeframe for entries.
How do you know when to enter a trade using candlesticks?
You enter when price breaks the high or low of the confirmation candle after the pattern has closed.
Never enter on a forming candle, since its shape can reverse before the close. Confirm that the setup has confluence from volume, VWAP position, and market structure before taking the trigger.
What are the 3 most important candlestick patterns?
The three most important patterns for day traders are the engulfing pattern, the hammer and shooting star pair, and the doji. Together they cover momentum shifts, price rejection, and indecision, which are the core behaviors behind most other named patterns.
Master these three at key levels before adding more.
Can I use candlestick patterns without indicators?
Yes, you can trade candlestick patterns without any indicators.
Pure price action traders read context directly from structure, swing points, and volume. That said, tools that display VWAP, multi-timeframe alignment, and key levels can speed up context-reading considerably, which helps when you’re monitoring several charts at once.
One Chart, One Rule Set, Starting Today
Everything in this guide can feel like a lot. Anatomy, context, timeframes, confirmation, expectancy… it’s tempting to try applying all of it at once across five charts and a dozen patterns.
Don’t.
Start with one decision.
Pick one pattern and one timeframe. Maybe it’s a bullish engulfing bar at the session low on the 5-minute chart. Maybe it’s a shooting star at the prior day’s high on the 15-minute chart.
Choose one and ignore everything else for now.
Then write your exact rule on paper. What confirms the pattern? Where is your entry trigger? Where is your stop, and why? What’s your target, and is it at least 1.5R away?
If you can’t answer each question in a single sentence, the rule isn’t ready.
Now paper-trade or backtest 20 occurrences of that exact setup before risking real capital.
Log every result in R-multiples.
Twenty trades won’t prove an edge, but they will show you whether your rules are clear and whether the setup behaves the way you expected.
And carry one mindset shift forward from here.
A candlestick is one input in a decision. It is never the decision itself.
Traders who internalize that stop chasing shapes.
They start reading the market.
Sources
- FINRA: Frequent Intraday Trading: Understanding the Basics - Syndication
- Investor.gov: Thinking of Day Trading? Know the Risks.
- ScienceDirect: Candlestick patterns work statistically
- ScienceDirect: Candlestick technical trading strategies: Can they create value for investors?
- Wikipedia: Candlestick chart
Risk Disclaimer: Trading involves risk. Past performance doesn't guarantee future results. Only trade with money you can afford to lose. PipTrend is a tool to assist your trading decisions, not financial advice.