A Trader's Guide to Reading Volume Indicators
On this page
Why Volume Deserves a Second Look
Two identical volume spikes. Same size bar, same ticker, same session.
One marks the beginning of a three-week rally. The other marks the exact top.
Nothing about the bar itself tells you which is which.
Location does.
What happened in the ten sessions before it does. And that gap between “big volume bar” and “meaningful information” is where most traders lose the plot.
A volume indicator measures how much of an asset changed hands during a given period: shares for equities, contracts for futures, coins or lots for crypto and FX. At its simplest, that’s the histogram sitting under your price chart, one bar per candle.
Those are raw volume bars, and they are data, not analysis.
Analytical volume tools are a different species.
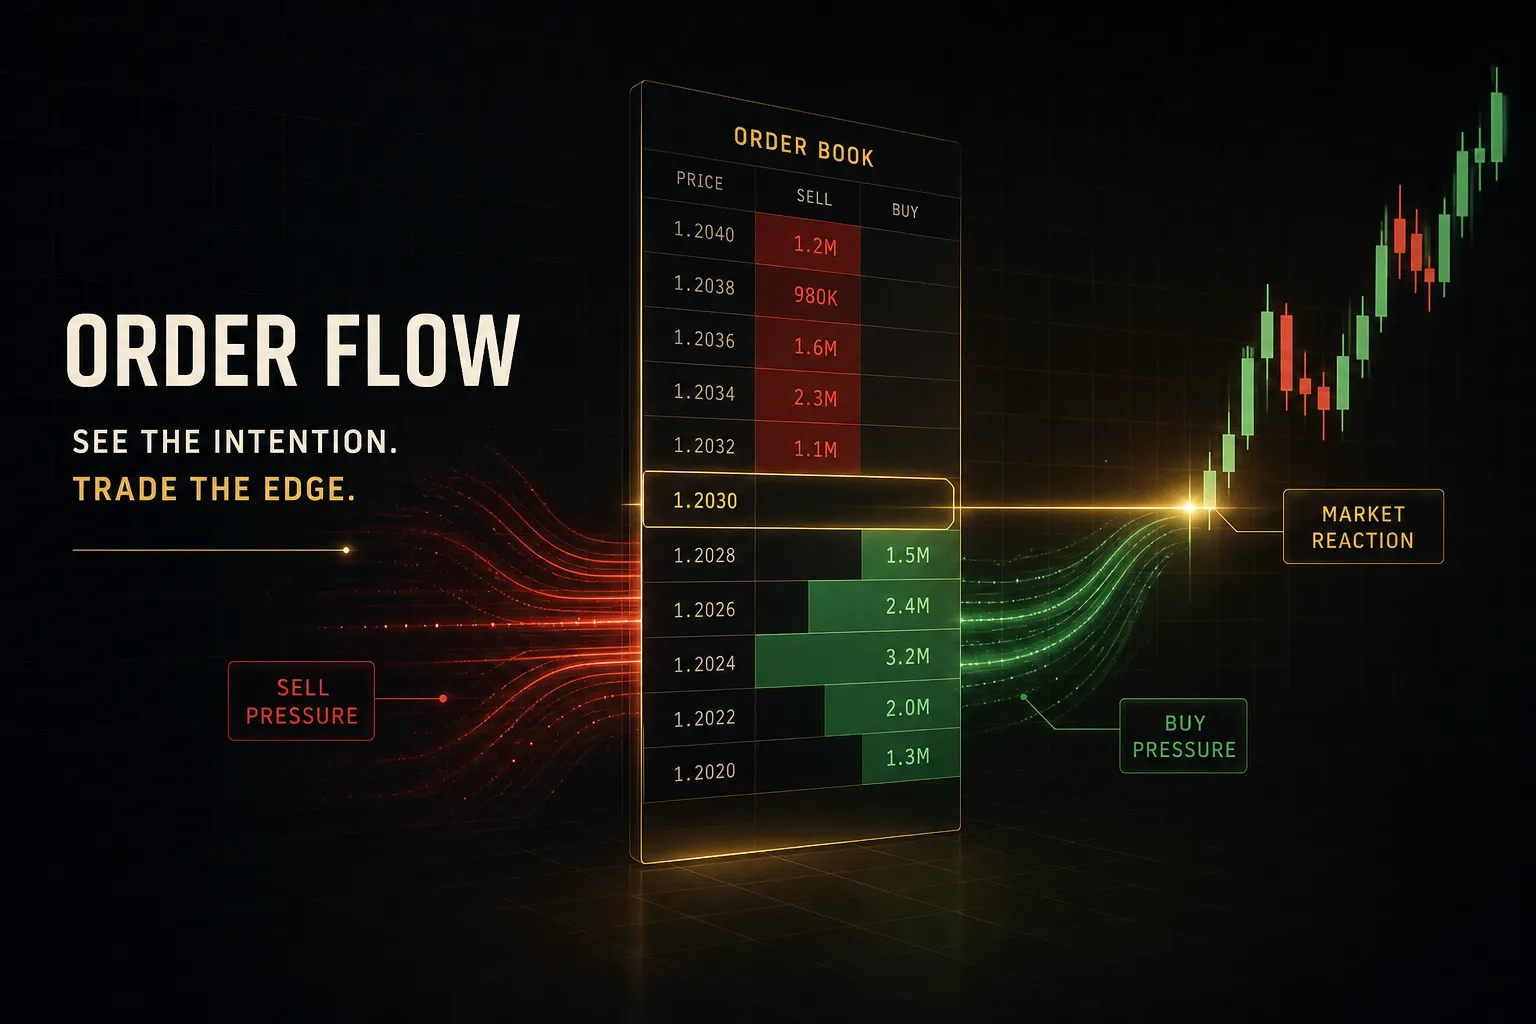
On-Balance Volume, Chaikin Money Flow, the Money Flow Index, volume-weighted average price, and volume profile all take that raw participation number and transform it into something interpretable. They answer questions raw volume cannot: is money accumulating or leaving? Where did the market actually agree on price? Is today’s buying pressure stronger than yesterday’s?
Raw volume tells you how many people showed up. Volume indicators try to tell you what they were doing there.
This guide covers four things.
First, what “volume” actually means in stocks, futures, crypto, and forex, because the number is not comparable across those markets. Second, the four price-volume combinations that form the basis of every volume read.
Third, the main indicators and the specific question each one answers. And fourth, how to slot volume into a trading process as one confirmation input rather than a standalone trigger.
Volume is excellent supporting evidence.
It’s a terrible lone witness.
What Counts as Volume, Market by Market
Here’s a mistake that quietly ruins analysis: a trader learns to read volume on US equities, gets good at it, then applies the exact same rules to a crypto pair or a forex chart. The framework transfers.
The data quality does not.
Every market reports volume differently, and some barely report it at all.
Stocks, Futures, and Crypto Data
These three give you real transaction counts, but with meaningfully different reliability. Understanding the reporting mechanism behind each one changes how much weight you should give the number.
- Stock exchange volume is the gold standard. Exchange-listed equities report through a consolidated tape, meaning nearly every share traded during regular hours gets counted in one centralized record. When you see 4.2 million shares on a daily bar, that number reflects genuine, verifiable market participation across the whole market, not one venue’s slice of it. Dark pool and off-exchange activity does get reported with a delay, which is a real caveat, but the core data is as complete as trading volume gets.
- Futures volume counts contracts, and contracts expire. Each bar shows how many contracts changed hands, which is clean data from a single centralized exchange. The complication is the rollover cycle: as the front-month contract approaches expiration, volume drains out of it and floods into the next month. Compare a rollover week to a normal week and you’ll see distortions that have nothing to do with market conviction.
- Futures traders should read volume alongside open interest. Volume tells you how many contracts traded; open interest tells you how many remain open. Rising price with rising volume and rising open interest suggests new money entering a trend. Rising price with falling open interest often means short covering, which is a very different story.
- Crypto volume is fragmented across exchanges. There is no consolidated tape in crypto. Binance, Coinbase, Kraken, and a hundred others each report their own volume, so the “true” figure for an asset depends entirely on which venues your data feed aggregates. Two charting platforms can show wildly different volume for the same coin on the same day.
- Crypto also splits volume into base and quote currency. On a BTC/USDT pair, base volume counts bitcoin traded while quote volume counts the USDT value traded. A 500 BTC session at $40,000 and a 500 BTC session at $80,000 look identical in base volume and doubled in quote volume. Know which one your chart displays before you compare periods.
- Thin altcoin books distort everything. On low-liquidity pairs, a single large order can produce a volume spike that looks like institutional accumulation and is actually one wallet. Wash trading on less regulated venues compounds the problem. The rule of thumb: the smaller the market cap, the less you should trust the volume signal.
Why Forex Volume Is Different
Spot forex has no central exchange.
None.
It’s a decentralized over-the-counter market where trades happen bilaterally between banks, brokers, funds, and retail platforms, with no obligation to report to a shared tape.
So what is that histogram on your MT4 or TradingView forex chart?
It’s tick volume: a count of how many times the price changed during the period, not how much currency was traded. If EUR/USD ticked 1,847 times in an hour, the bar reads 1,847.
That figure comes from your broker’s feed alone, which is a fraction of a market turning over roughly $7.5 trillion a day.
Tick volume is still useful, with one hard constraint. Academic studies have found tick volume correlates strongly with actual traded volume, often above 0.85 on major pairs, because activity and price change move together.
Use it to compare relative activity within the same feed: is this London session busier than the last five?
Fine.
Just never treat it as a measure of global spot-FX turnover, and never compare tick volume across two different brokers.
CME currency futures are the workaround.
They trade on a centralized exchange with genuine reported volume and open interest, which many FX traders use as a proxy for institutional positioning in the underlying spot market.
Reading Price and Volume Together
Volume in isolation means nothing.
A 3x average volume bar is neither bullish nor bearish until you know what price did during that bar and where on the chart it happened.
The price-volume relationship reduces to four combinations. Learn these and you have the foundation for every volume-based technique that follows.
The Four Price-Volume Combinations
Each combination describes the balance between participation and direction. Read them as descriptions of conviction, not as buy and sell signals.
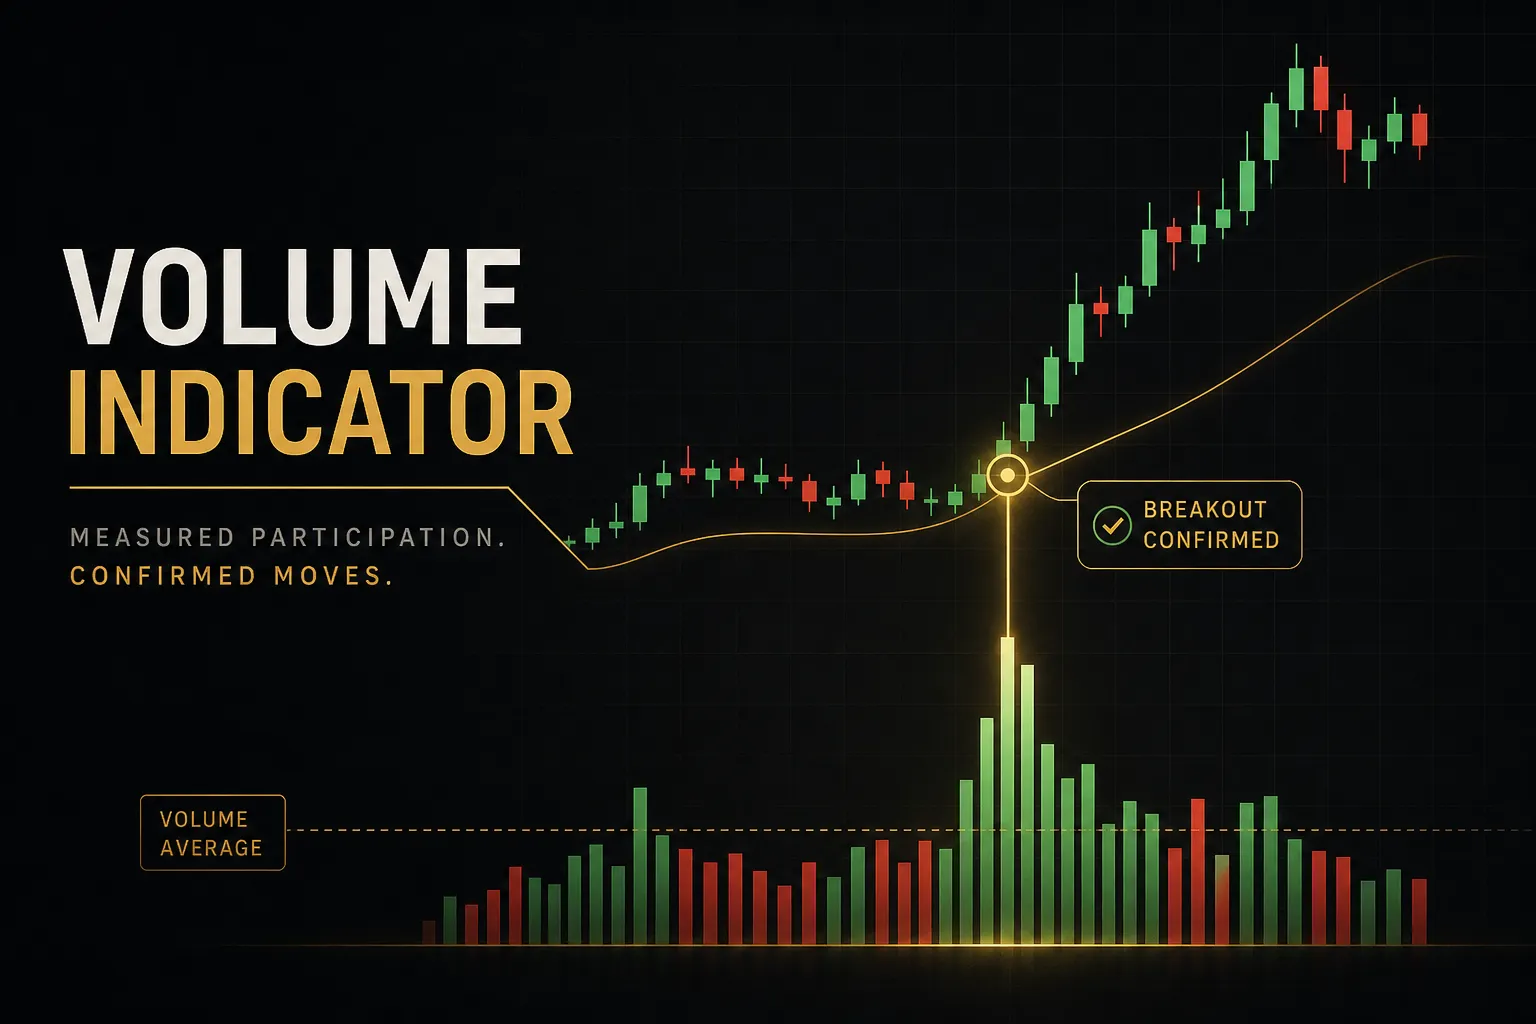
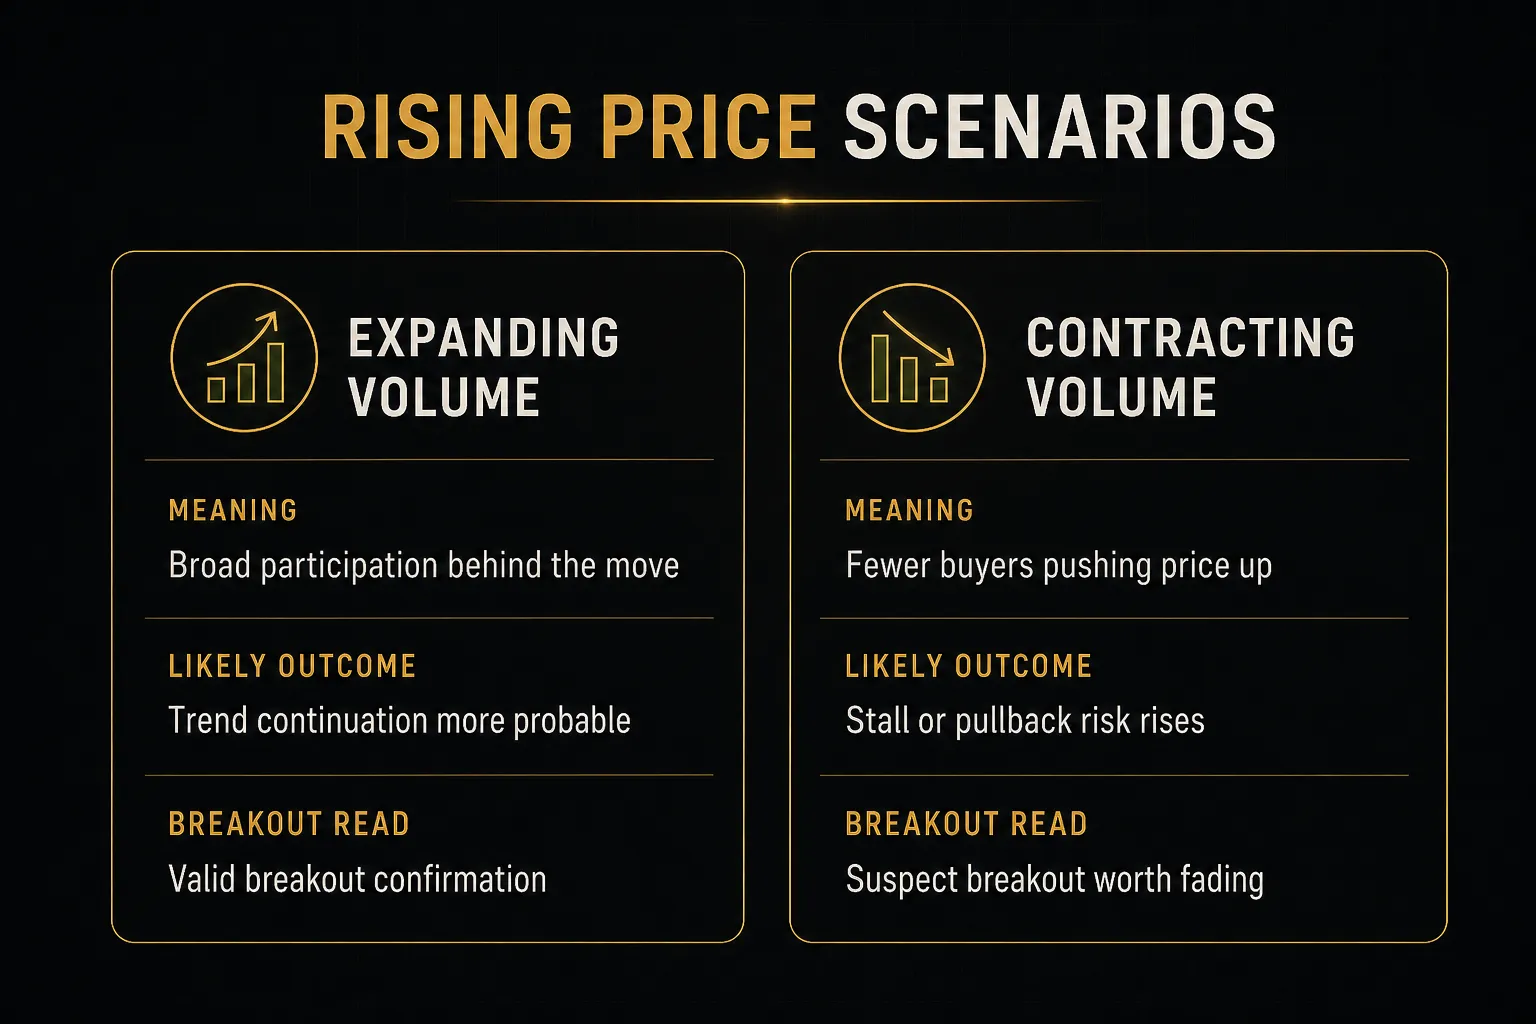
- Rising price, expanding volume: healthy and confirmed. More participants are joining as price advances, which means the move has broad support rather than a handful of buyers pushing a thin book. This is the textbook profile of a genuine uptrend, and it’s what you want to see on breakouts above resistance.
- Rising price, contracting volume: caution. Price keeps climbing but fewer people are participating, so the advance is running on diminishing fuel. It doesn’t mean an immediate reversal, plenty of trends drift higher on light volume for weeks, but it flags that the buying pressure behind the move is thinning.
- Falling price, expanding volume: strong selling or capitulation. Heavy participation on the way down signals real selling pressure, often institutional distribution. The nuance: after an extended decline, a massive volume down-bar can mark capitulation, the point where the last weak holders finally exit and the selling exhausts itself.
- Falling price, contracting volume: low conviction decline. Price drifts lower but almost nobody is trading it, which typically indicates a lack of buyers rather than aggressive selling. These pullbacks inside an uptrend are often healthy, and a return of volume on the next up-leg tends to confirm the trend is intact.
Divergence Is a Warning, Not a Signal
Volume-price divergence occurs when price and a volume-based indicator move in opposite directions.
Price grinds to a higher high while On-Balance Volume makes a lower high. Or price breaks to a new low while the Money Flow Index turns up.
Divergence is genuinely valuable because it flags weakening participation before price confirms it. The catch is that it flags weakness early, and “early” can mean two bars or two months.
Trading divergence on its own is a well-documented way to get run over by a trend that simply keeps going.
It needs confirmation: a break of a defined support level, a shift in momentum structure, a lower high forming on price itself. Add a pre-defined invalidation level before you act, otherwise you’re holding a thesis with no exit.
One more trap, and it’s a common one. Timeframe mismatch destroys volume analysis quietly.
Comparing an incomplete session’s volume to a full historical session is meaningless. At 10:15am, a daily bar showing 1.1 million shares against a 4-million average is not “low volume.”
It’s four hours of data compared to twenty.
Similarly, reading daily volume context to justify a five-minute entry mixes two entirely different resolutions of the same market. Use multi-timeframe analysis deliberately, with each timeframe answering its own question.
Which Volume Indicator Answers What
Traders often stack four volume tools on one chart and call it confirmation.
It isn’t.
It’s the same information counted four times.
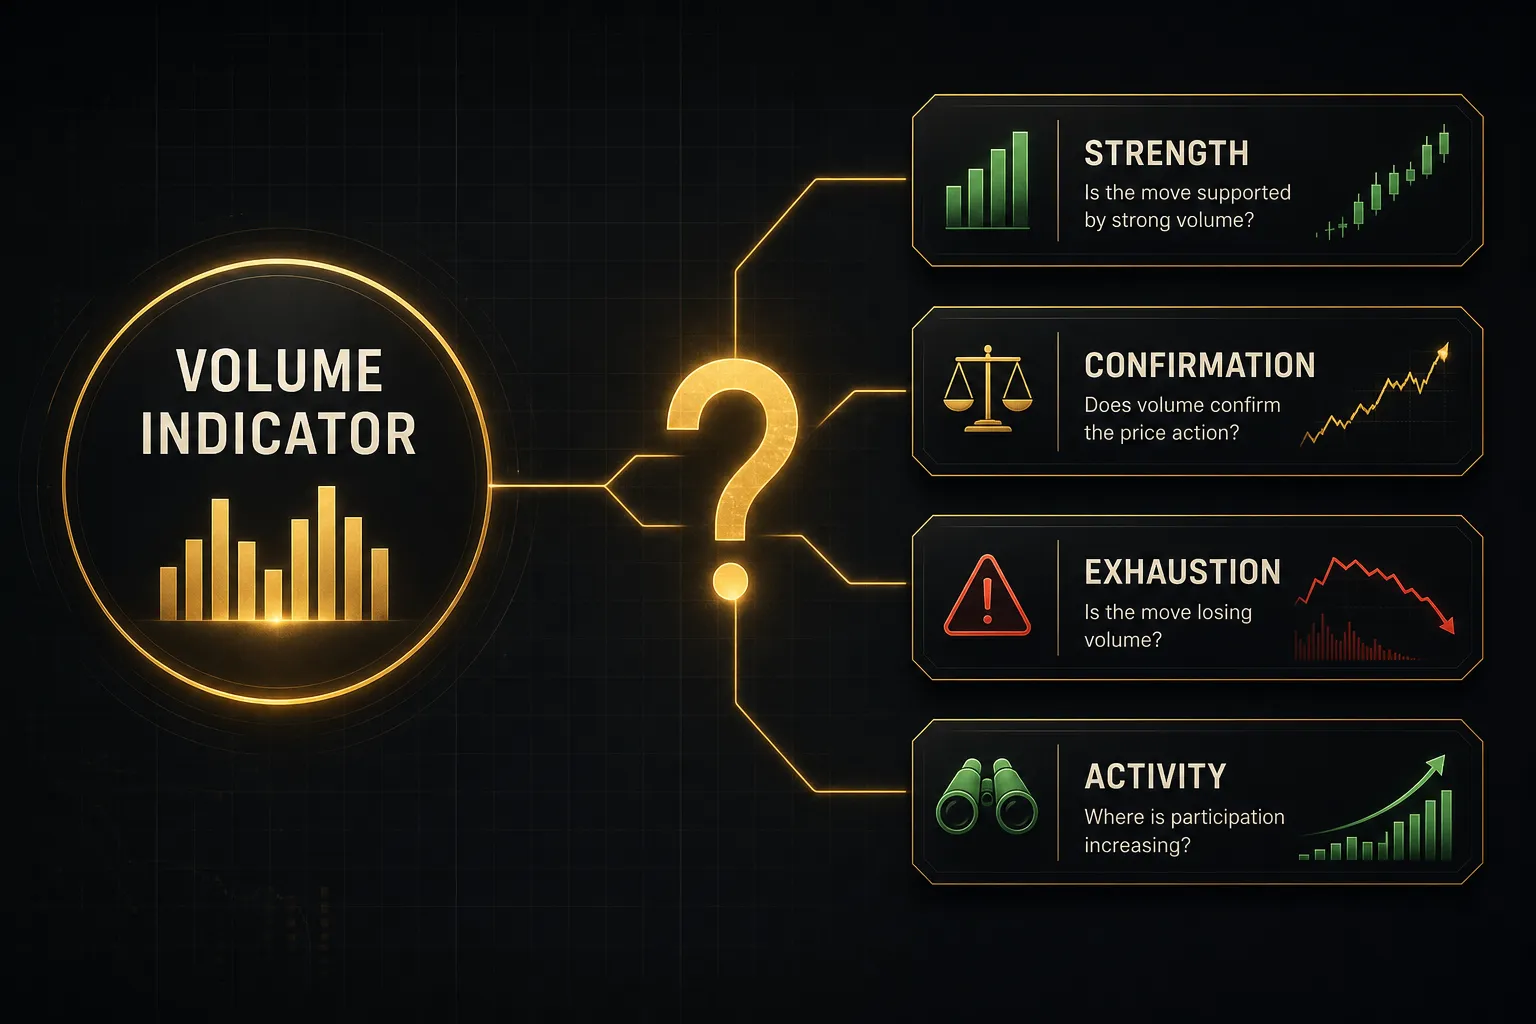
Each of the major volume indicators was built to answer a specific question. Pick based on the question you actually have.
| Indicator | What it measures | Question it answers | Best use case |
|---|---|---|---|
| On-Balance Volume (OBV) | Running cumulative total, adding volume on up-closes and subtracting on down-closes | Is volume flowing into or out of this asset over time? | Spotting accumulation or distribution before price confirms; trendline breaks on the OBV line itself |
| Volume-Weighted Average Price (VWAP) | Average price paid across the session, weighted by volume at each level | Are buyers or sellers in control relative to the session’s fair value? | Intraday trend bias, institutional-style entries, judging whether a pullback is a discount or a breakdown |
| Chaikin Money Flow (CMF) | Where each close sits within its bar’s range, weighted by volume, summed over 20-21 periods | Is money net flowing in or out over the recent window? | Confirming trend strength; readings above +0.20 or below -0.20 indicate meaningful pressure |
| Money Flow Index (MFI) | Volume-weighted RSI using typical price, bounded 0 to 100 over 14 periods | Is this move overbought or oversold with volume accounted for? | Divergence hunting at extremes; readings above 80 or below 20 flag stretched conditions |
| Volume Profile | Volume distributed across price levels rather than across time | Where did the market actually accept and reject price? | Locating the point of control and value area as structural support and resistance |
| Accumulation/Distribution Line | Cumulative money flow volume, similar to OBV but weighted by close position in range | Is the trend supported by underlying flow? | Longer-horizon confirmation on daily and weekly charts |
A few things worth understanding beyond the table.
OBV’s absolute number is irrelevant. Because it’s cumulative from an arbitrary starting point, an OBV of 14 million versus 140 million tells you nothing.
Only three things matter: its direction, whether it breaks trendlines drawn on the OBV line, and whether it agrees or disagrees with price.
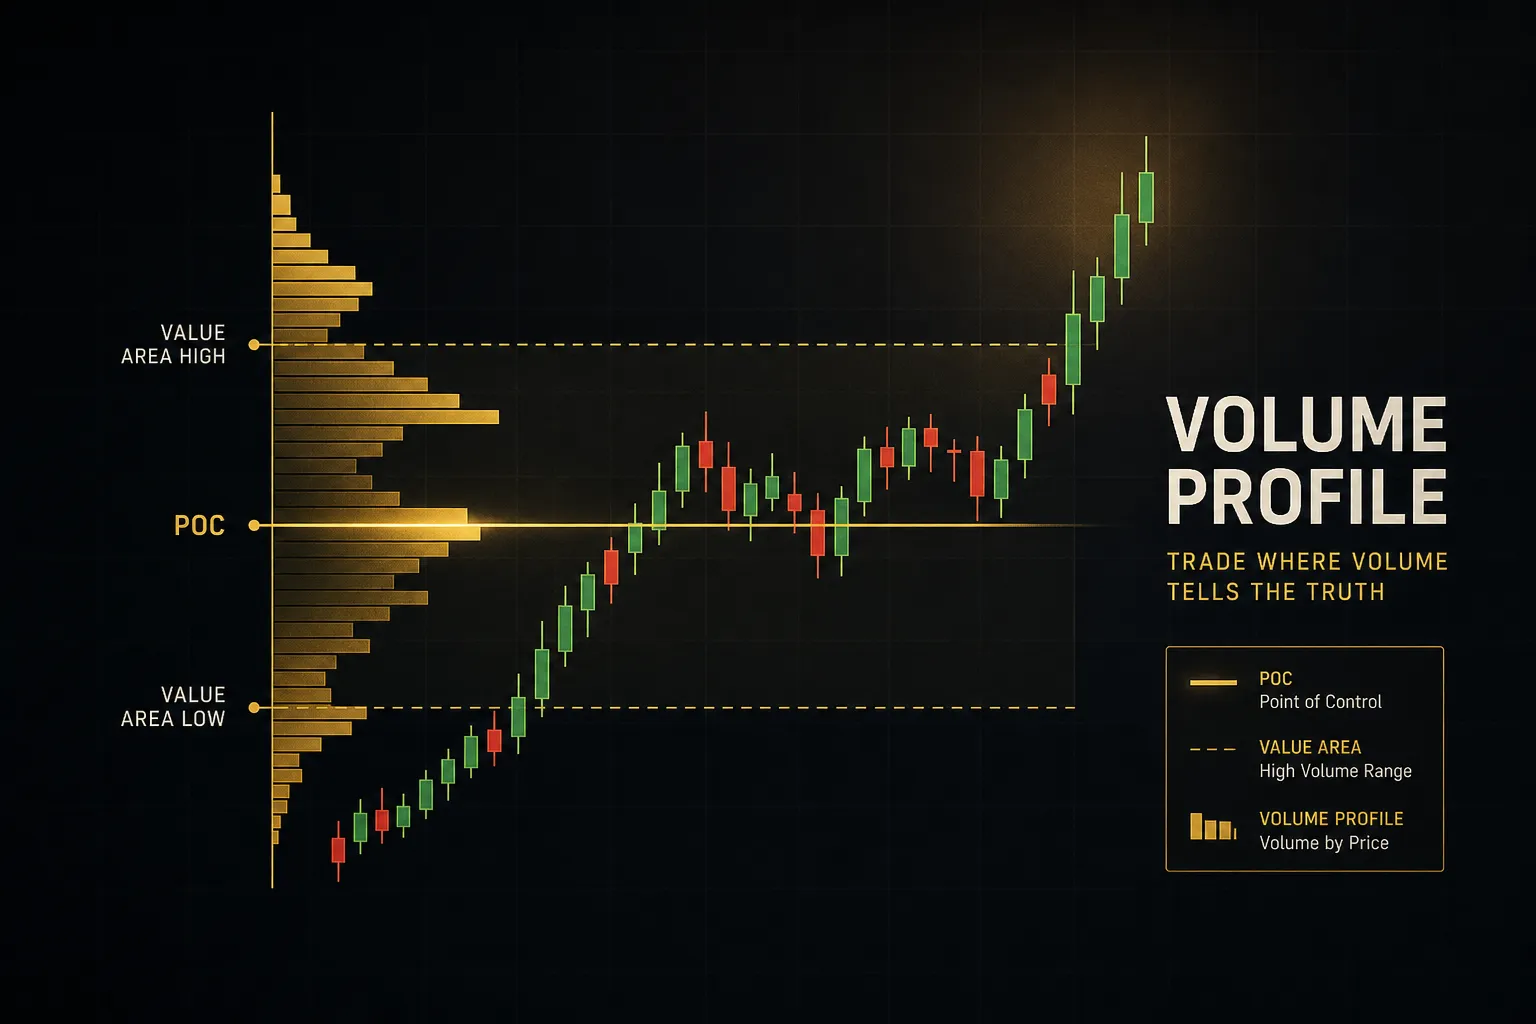
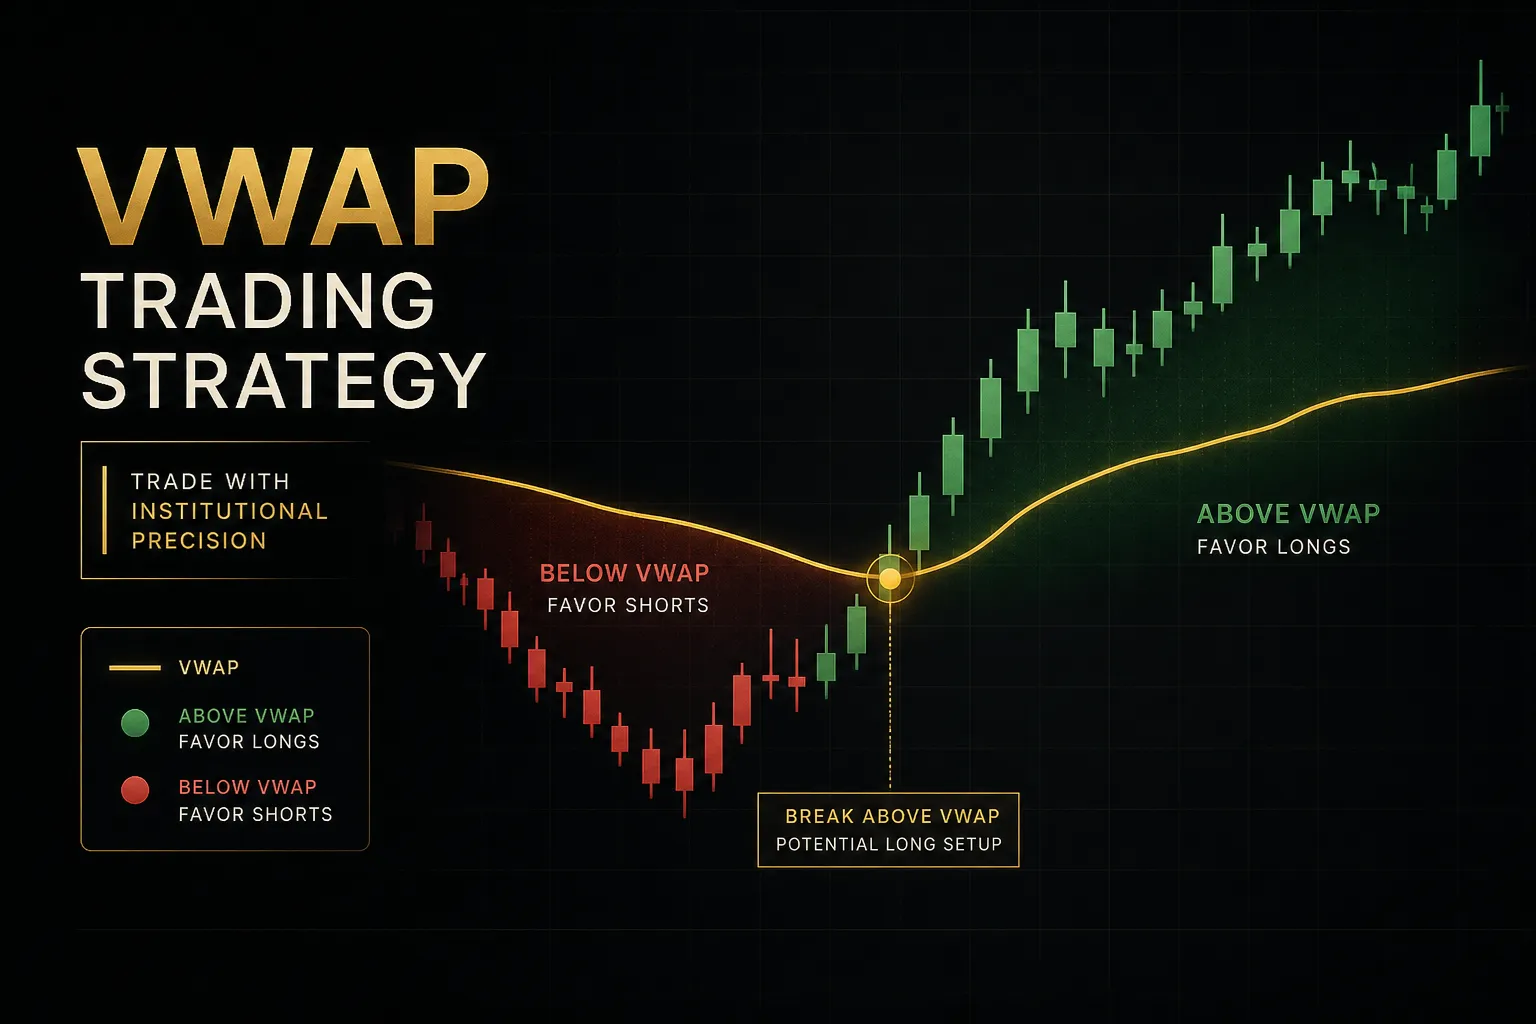
VWAP and volume profile are not interchangeable. VWAP is a single line describing the session’s volume-weighted average, resetting daily and functioning as a dynamic reference for intraday bias.
Volume profile is reactive and horizontal, showing you the point of control (the price with the most volume traded) and the value area (typically the range containing 70% of session volume).
One gives you a moving benchmark; the other gives you fixed structural levels.
CMF and MFI are close cousins. Both are money-flow oscillators combining price location within the range with volume.
Running them side by side does not double your confidence, it just gives you two versions of the same conclusion.
If you want independent confirmation, pair one money-flow tool with something structurally different: a trend filter, a volatility measure, or price structure itself.
A volume oscillator (the difference between a fast and slow volume moving average) or a volume-weighted moving average can substitute where you want smoothed participation trends rather than money-flow direction.
Using Volume Without Getting Fooled
Most false breakout losses share a signature: a trader saw a big volume bar, assumed conviction, and entered without checking anything else.
The bar was real.
The context wasn’t there.
What follows is a repeatable process, plus the situations that make raw volume lie to you.
A Breakout Validation Checklist
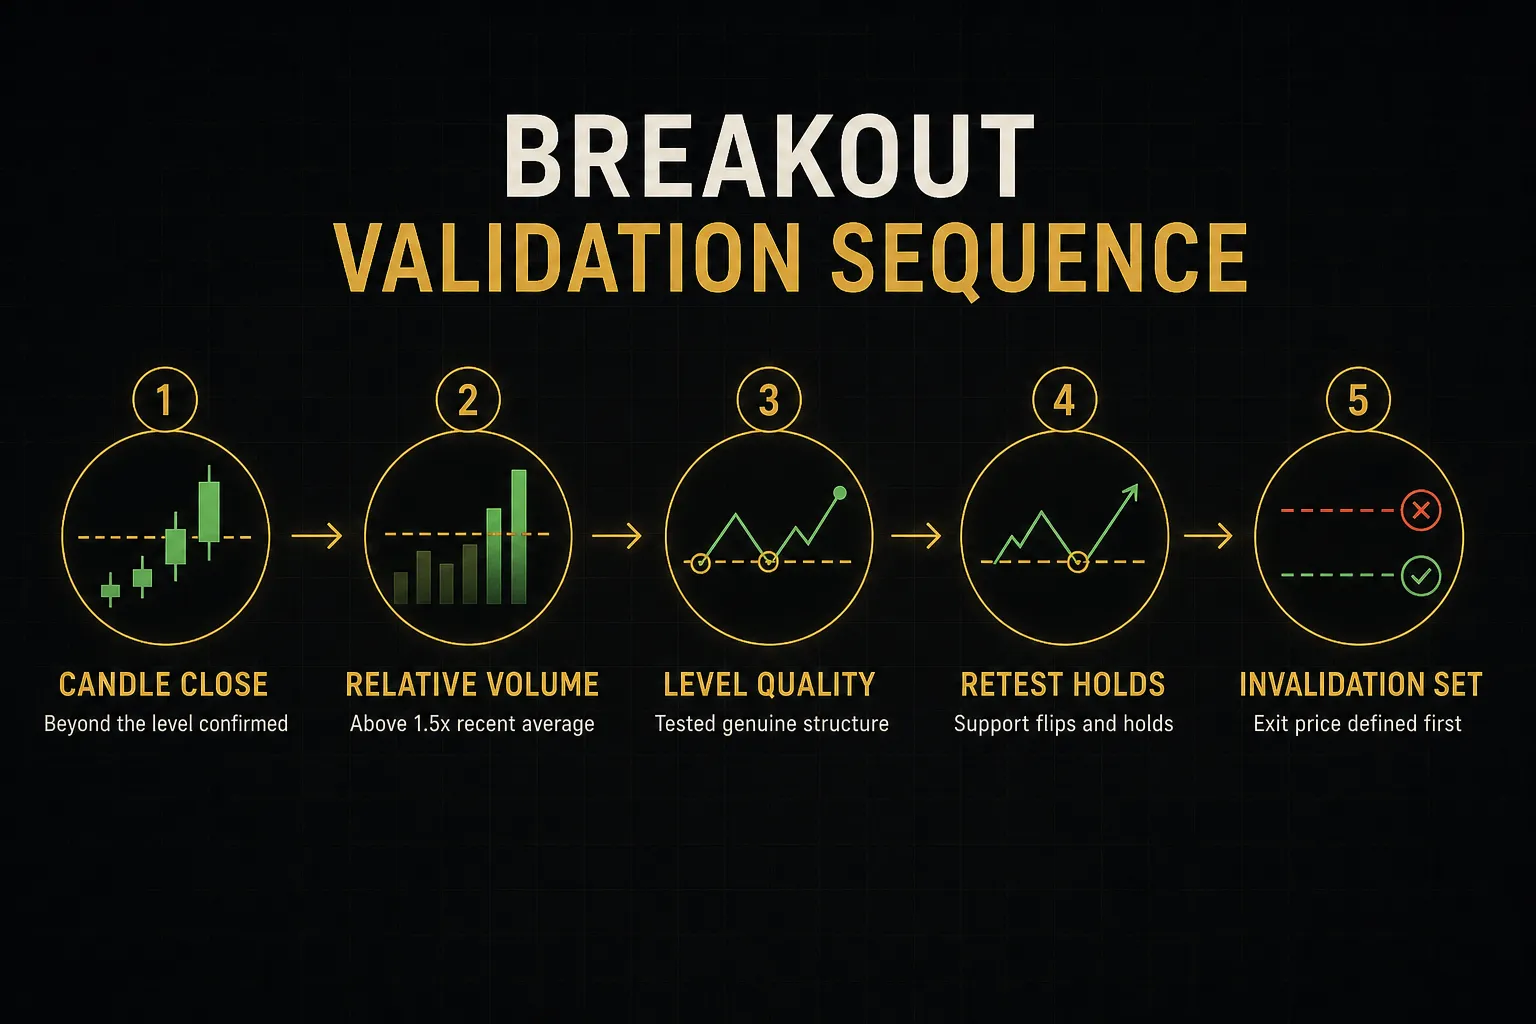
Run every candidate breakout through these five checks in order. If any one fails, the setup is not confirmed, regardless of how convincing the volume bar looks.
- Wait for a confirmed candle close beyond the level. Intrabar spikes through resistance reverse constantly. A close beyond the level on your working timeframe is the minimum evidence that the break is being accepted rather than probed.
- Check relative volume, not the raw bar height. Compare the current bar to its 20-period average volume. A useful threshold is 1.5x to 2x average for a genuine breakout; a bar that merely looks tall next to yesterday’s may still be below its normal range.
- Verify the level is genuine support or resistance. A break of a line you drew ten minutes ago is not the same as a break of a level that has been tested three times over two months. Volume profile helps here: breaks beyond the value area edge carry more structural weight than breaks of arbitrary trendlines.
- Look for a retest that holds. Strong breakouts frequently return to the broken level and find support there, ideally on lighter volume than the break itself. That retest is often a better entry than chasing the initial candle, with a tighter and more logical stop.
- Define invalidation before entry. Decide the exact price at which your thesis is wrong, usually just beyond the retest low or back inside the prior range. Without this, a losing breakout becomes an open-ended position.
Context Behind Volume Spikes
Some volume spikes carry information.
Others are mechanical artifacts of the calendar.
Knowing which is which prevents a large category of false signals.
- Scheduled news and earnings. A biotech printing 8x average volume on an FDA decision day is reacting to an event, not accumulating quietly. Event-driven volume tells you the market is repricing, but it says little about the durability of the resulting trend until the dust settles.
- Market opens and session overlaps. The first 30 minutes of the US equity session routinely carries the day’s heaviest volume, and the London-New York forex overlap does the same for FX. Compare volume to the same time of day historically, not to the quiet midday lull.
- Futures contract rollovers. During roll weeks, volume migrates from the expiring contract to the next, producing sharp changes in both contracts that have nothing to do with directional conviction. Continuous charts smooth this, but they also hide it.
- Options expiration. Monthly and quarterly expirations, particularly quadruple witching, generate enormous mechanical volume from hedging and position closing. Price behavior on those days is frequently unrepresentative of the underlying trend.
- Abnormal one-off prints. A single block trade, an index rebalance, or a fat-finger error can create a spike that no follow-through supports. Check whether the volume distributed across many bars or landed in one.
Confirming Volume With a Full System
Volume indicators have real limitations, and pretending otherwise is expensive.
They lag price, because they summarize transactions that already happened. They misfire on thin or manipulated feeds, particularly in small-cap equities and low-liquidity crypto pairs.
And every volume rule you read, including the ones here, needs backtesting or paper trading on your specific instrument and timeframe before you risk capital on it.
The productive approach treats volume as one input in a multi-factor signal framework.
Trend direction sets the bias.
Support and resistance define where trades make sense.
Momentum and volatility describe the conditions.
Volume answers one question only: how much market participation is behind this move?
Platforms built around this logic show the pattern clearly. PipTrend, for example, pairs directional signals with a multi-timeframe table so a setup on the 15-minute is read against the 1-hour and 4-hour picture, then layers precision entry levels including VWAP and supply and demand zones.
The signal gives direction; the structural levels give the entry and the invalidation.
Volume becomes confirming evidence within that structure rather than the trigger itself, and PipTrend’s published, verified trade-outcome results give traders something concrete to evaluate rather than an unfalsifiable claim.
The principle transfers regardless of tooling.
Direction from trend, location from structure, conviction from volume, and risk defined before entry.
Common Volume Questions Answered
What is the best volume indicator for trading?
There is no single best volume indicator, because each one answers a different question. Choose based on your objective: OBV for confirming trend and spotting accumulation, VWAP for intraday bias and entry timing, volume profile for locating accepted price and structural levels, and CMF or MFI for gauging money flow direction.
Most experienced traders use one or two, not five. Stacking correlated tools produces redundant agreement, which feels like confirmation and isn’t.
How do you read a volume indicator?
Read volume in two steps: compare the current bar to its recent average, then check whether it agrees with price direction and chart location.
Start with relative volume against a 20-period average. Is this bar 0.6x, 1.0x, or 2.5x normal?
Then ask what price did during that bar and where it happened.
High volume on a close above a multi-tested resistance level means something.
The same volume in the middle of a range means far less.
What does volume tell you about a stock?
Volume tells you how much participation and conviction sits behind a price move, not the direction or destination of that move.
High volume means many market participants agreed to transact at those prices, which makes the resulting move more likely to hold. Low volume means few did, which makes the move easier to reverse.
Volume also proxies liquidity: heavily traded names have tighter spreads and less slippage on execution.
Is volume a leading or lagging indicator?
Raw volume is roughly coincident, and cumulative volume tools like OBV are lagging.
Volume bars print simultaneously with the price action they describe, so they neither predict nor trail.
Indicators built on accumulated history, including OBV, the accumulation/distribution line, and CMF, summarize past activity by design.
They can highlight divergences that appear before price turns, but that’s early warning from historical data, not forecasting.
What does it mean when price goes up but volume goes down?
Rising price on falling volume signals thinning participation, a caution sign that often precedes a stall or pullback.
Fewer buyers are pushing price higher, meaning the advance is running on reduced fuel.
It is not a sell signal by itself.
Uptrends can drift higher on declining volume for extended periods. Treat it as a reason to tighten stops and watch for confirmation, such as a break of a rising trendline or a lower high on the price chart.
Does volume indicator work in forex?
Volume indicators work in forex, but only as relative gauges on tick volume from a single broker feed.
Because spot FX is decentralized with no consolidated tape, retail platforms display tick volume, a count of price changes rather than currency traded. That correlates well with real activity, so comparing sessions on the same feed is legitimate.
Comparing across brokers, or reading the number as total global turnover, is not.
For genuine reported volume and open interest, use CME currency futures.
Let Volume Confirm, Not Command
The decision logic comes down to market and context.
On stocks, futures, and crypto, you can lean on raw and relative volume with real confidence, adjusting for the quirks of each: rollovers in futures, exchange fragmentation in crypto, off-exchange reporting in equities. On spot forex, treat tick volume strictly as a same-feed relative gauge and nothing more.
Everywhere, the same rule applies.
Volume sits alongside price structure, trend direction, and risk management. It does not replace them, and it should not trigger trades on its own.
A volume spike at a random price level is noise.
The same spike on a confirmed close beyond a well-tested level, in the direction of the higher-timeframe trend, with a defined invalidation below the retest, is evidence.
One concrete action for your next trade.
Before you enter, pull up relative volume against its 20-period average and confirm the reading matches the price-volume combination you think you’re trading.
If you’re buying a breakout, you want expansion above roughly 1.5x. If you’re buying a pullback in an uptrend, you want contraction.
If the volume disagrees with your thesis… the thesis needs another look. That single check filters out more bad trades than most traders expect.
Sources
Risk Disclaimer: Trading involves risk. Past performance doesn't guarantee future results. Only trade with money you can afford to lose. PipTrend is a tool to assist your trading decisions, not financial advice.