On this page
Why Most Challenge Attempts Fail
Most traders who fail a prop firm evaluation had a strategy that could have worked. What they lacked was the math to keep that strategy alive long enough to prove it.
The failure point is rarely the entry signal.
It is almost always position sizing, a misunderstood drawdown rule, or one bad afternoon of revenge trading.
That reframing matters.
If you treat a challenge as a strategy problem, you spend your energy hunting for better setups. If you treat it as a survival-math problem, you spend it making sure no single trade, day, or losing streak can end the attempt.
This guide takes the second approach. You will learn how to pass a prop firm challenge by turning the firm’s rule sheet into four concrete tools:
- A personal risk budget that sits well inside the firm’s limits.
- A position-size formula you apply before every trade.
- A daily stop that triggers long before the firm’s daily drawdown does.
- A readiness test you pass on paper before risking a cent of challenge fees.
One more thing before the numbers.
Speed is the enemy.
The traders who brag about passing in two days usually did it with oversized positions, and for every one of them there are dozens who breached a rule trying the same thing.
The realistic goal is not to pass fast. It is to pass once, without paying for a reset.
The Rules That Actually Break Traders
Two traders can buy the same $100,000 challenge from two different firms and have completely different amounts of room to trade.
Same account size.
Same 5% headline limit.
Very different reality.
The difference is how the limit is calculated.
Some firms measure drawdown from your starting balance, which gives you a fixed floor. Others use end-of-day equity, and some use a moving high-water mark that rises with every new account peak.
Before you place a single trade in 2026, read the firm’s FAQ until you can state the calculation method in one sentence.
Daily Loss Limit vs Maximum Drawdown
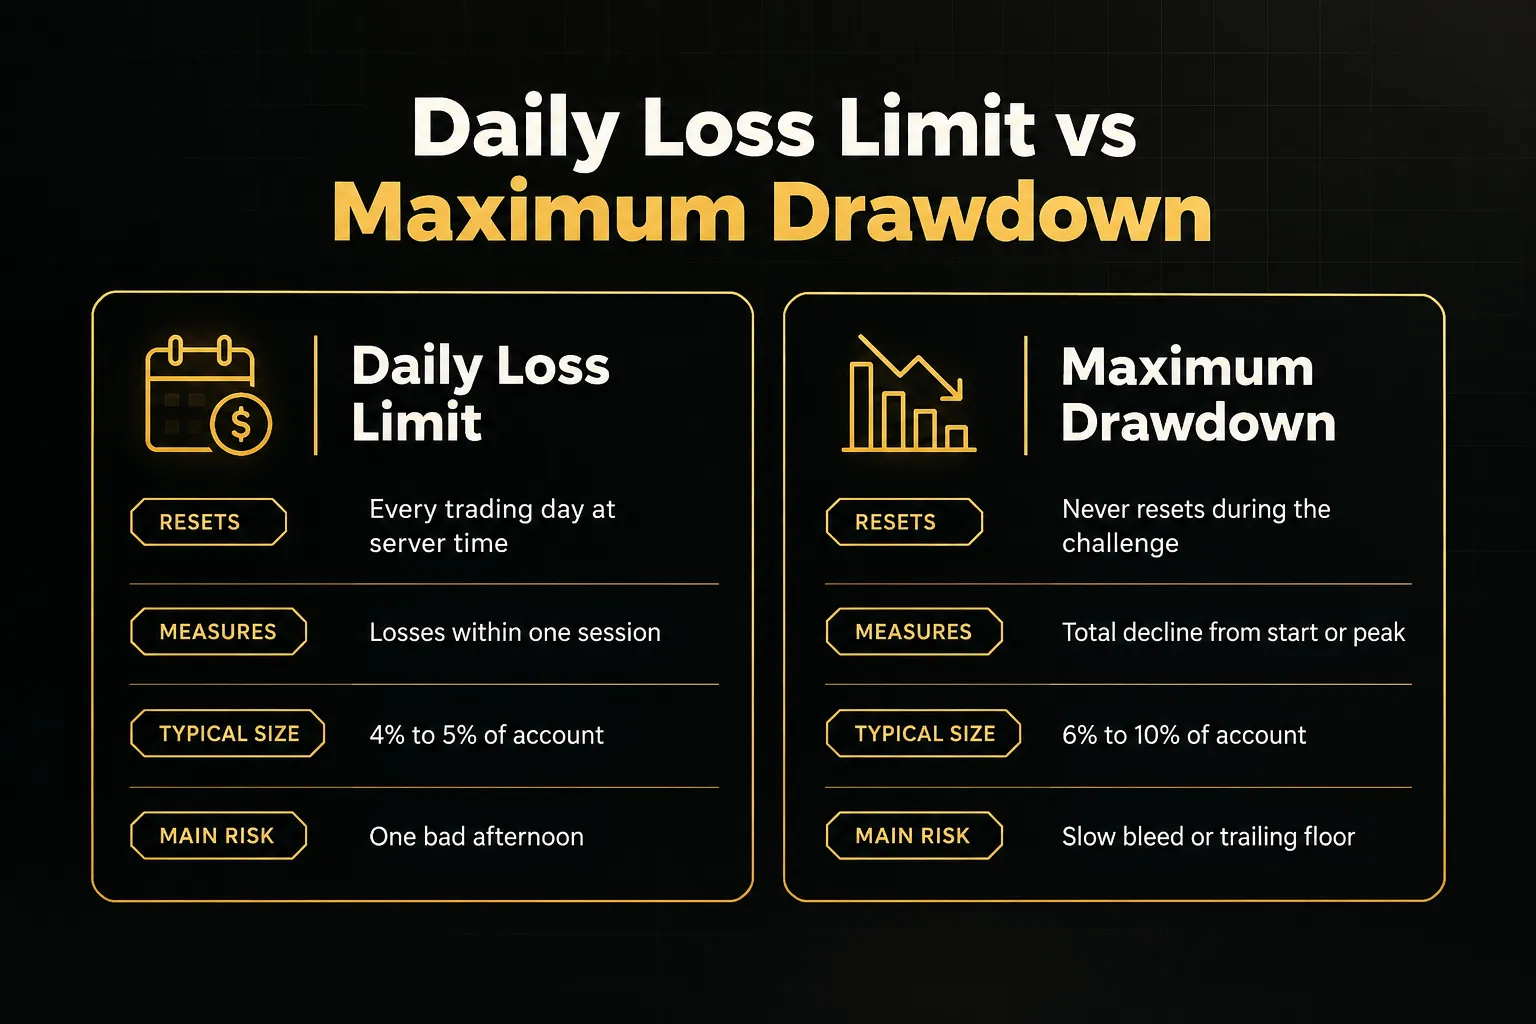
The daily drawdown limit resets every trading day, usually at a fixed server time such as 5 p.m. New York. It caps how much you can lose within that single session.
The maximum drawdown limit never resets.
It is cumulative across the entire challenge.
The daily limit also varies in how it is measured. A balance-based daily limit only counts closed trades.
An equity-based daily limit counts floating losses on open positions too, which is far stricter.
Many firms also calculate the daily floor from whichever is higher at reset: your balance or your equity. So if you carry a $1,500 floating profit into the new day, that profit becomes part of the baseline you are measured against.
How Trailing Drawdown Moves Against You
A static drawdown stays put.
On a $100,000 account with a 5% static limit, your floor is $95,000 from day one to the last day.
Simple.
A trailing drawdown follows your highest point upward. Say your account climbs to $104,000.
With a 5% trailing limit, your floor moves from $95,000 to $99,000. You are now up $4,000, but you only have $5,000 of room left, exactly as before.
Your profits did not buy you a cushion.
It gets worse with equity-based trailing.
If an open trade shows $3,000 of unrealized profit, the high-water mark may rise even though you never closed the trade. If that trade then reverses to breakeven, you have effectively lost $3,000 of room without a single realized loss.
Some firms stop trailing once the floor reaches your starting balance.
Know whether yours does.
Why Winners Can Still Breach Rules
Here is the counterintuitive part.
You can breach a rule on a trade that closes in profit. These are the most common triggers:
- Floating losses mid-trade. With an equity-based daily limit, a position that dips $4,100 against you before recovering to +$2,000 has already breached a $4,000 daily limit. The firm’s system logs the breach the moment equity touches the floor.
- Spread widening during news. A EUR/USD spread that normally sits under 1 pip can blow out to 5 or more pips during a major release. That widening hits your equity instantly, even if price barely moves.
- Slippage on stops. A 30-pip stop that fills at 36 pips is 20% more loss than you planned. Stack two or three of those and your carefully sized day is gone.
- Commissions. At roughly $7 per round-turn lot, ten trades at 3 lots each cost about $210. That comes straight out of your daily allowance.
The fix is not complicated.
Treat the firm’s limits as walls you never get near, and size everything against a smaller personal limit instead.
Turning Rules Into a Risk Budget
A rule sheet tells you where the cliff edge is. A risk budget tells you how far from the edge you will stand.
The gap between those two numbers is what absorbs slippage, spread, commissions, and the losing streak you have not had yet.
The Position-Size Formula (Worked Example)
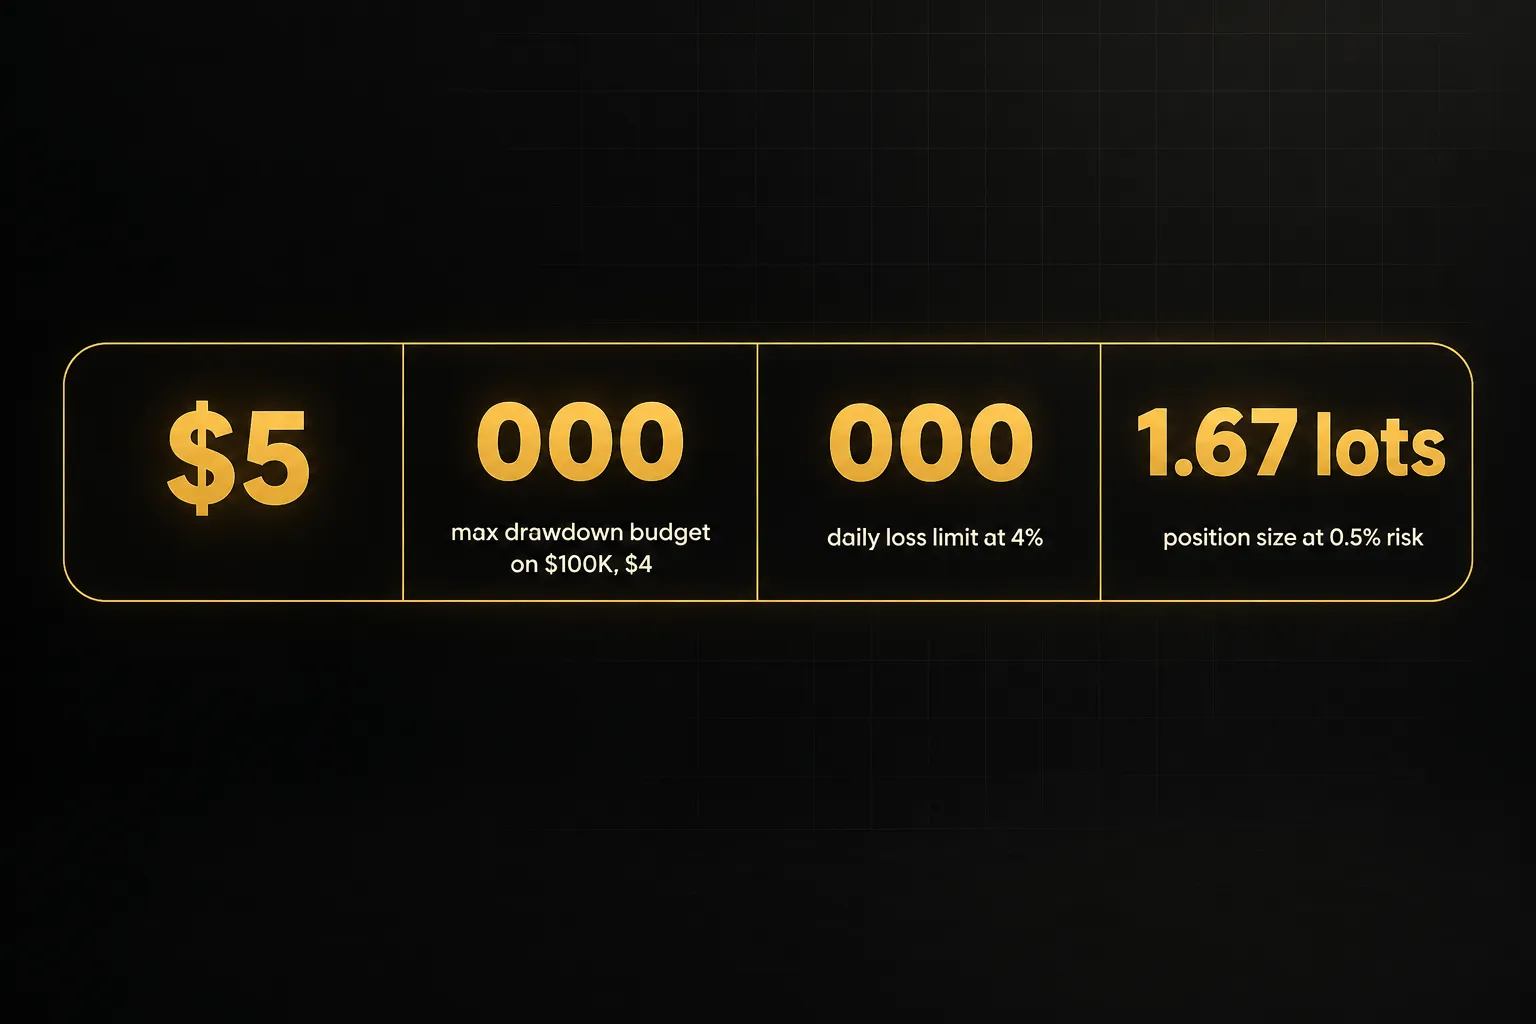
Take a standard setup: a $100,000 account with a 5% maximum drawdown ($5,000) and a 4% daily loss limit ($4,000). Your strategy uses a 30-pip stop on EUR/USD, where one standard lot is worth about $10 per pip.
The position-sizing formula is:
Lot size = Dollar risk ÷ (Stop distance in pips × Pip value per lot)
If you decide to risk 0.5% per trade, your dollar risk is $500. Plug it in: $500 ÷ (30 × $10) = 1.67 lots.
At 1% risk, the same math gives $1,000 ÷ $300 = 3.33 lots.
Your stop-loss placement determines the stop distance first, and the lot size adjusts to fit.
Never the other way around.
Now the hidden trap: correlated exposure.
Suppose you go long USD/JPY and long EUR/JPY, each at 0.5% risk. On paper that looks like two separate trades.
In practice, both are heavily driven by yen strength, so a sharp JPY rally can stop out both at once.
Your “0.5% per trade” just became a 1% loss in a single move.
The rule is simple.
If two positions share a currency and point the same way on that currency, count them as one trade for risk purposes and split the budget between them.
Choosing a Risk-to-Reward Ratio
Your risk-to-reward ratio decides how often you need to be right.
At 1:1, you need to win more than 50% of trades just to break even. At 1:2, the break-even win rate drops to about 33%.
That is a huge difference in breathing room, and it costs you nothing in extra per-trade risk.
| Risk-to-Reward | Break-Even Win Rate | Expectancy at 45% Win Rate | Trades to 8% Target at 0.5% Risk |
|---|---|---|---|
| 1:1 | 50.0% | -0.10R (losing) | Never reached |
| 1:1.5 | 40.0% | +0.13R | About 124 trades |
| 1:2 | 33.3% | +0.35R | About 46 trades |
| 1:3 | 25.0% | +0.80R | About 20 trades |
Expectancy is your average result per trade in R (units of risk).
At 1:2 with a 45% win rate, it works out to (0.45 × 2) − (0.55 × 1) = 0.35R. On a $500 risk, that is $175 per trade on average, so an $8,000 profit target takes roughly 46 trades.
Patient, but very survivable.
One caution.
Higher ratios usually mean lower win rates and longer losing streaks. A 1:3 strategy that wins 25% of the time can easily produce 8 or 10 losses in a row.
Pick the ratio your backtest actually supports, not the one that looks best on this table.
Conservative, Moderate, and Aggressive Models
This is where the math gets personal.
The table below shows how many consecutive full losses each risk model can absorb on our $100,000 example account before touching the 4% daily limit or the 5% maximum drawdown.
Remember: hitting the limit exactly usually counts as a breach.
| Model | Risk Per Trade | Dollar Risk | Lot Size (30-pip stop) | Losses Before Daily Limit (4%) | Losses Before Max Drawdown (5%) |
|---|---|---|---|---|---|
| Conservative (low) | 0.25% | $250 | 0.83 | 15 (16th hits limit) | 19 (20th hits limit) |
| Conservative (high) | 0.5% | $500 | 1.67 | 7 (8th hits limit) | 9 (10th hits limit) |
| Moderate | 1% | $1,000 | 3.33 | 3 (4th hits limit) | 4 (5th hits limit) |
| Aggressive | 1.5% | $1,500 | 5.00 | 2 (3rd breaches) | 3 (4th breaches) |
| Aggressive (high) | 2% | $2,000 | 6.67 | 1 (2nd hits limit) | 2 (3rd hits limit) |
Look at the bottom row.
At 2% risk, two losing trades in one session end the challenge.
Most strategies with a 40% to 50% win rate see a maximum losing streak of five to eight trades over a few hundred samples.
The aggressive model cannot survive a normal bad week.
And these numbers assume perfect fills.
Add slippage and spread, and each row effectively loses one trade of tolerance.
That is why the conservative and moderate bands (0.25% to 1%) are where most consistent passes happen.
Building a Strategy That Survives
A strategy that makes money on a personal account can still fail a prop firm challenge.
Why? Because the firm changes the conditions: different spreads, a capped leverage ratio, banned trading windows, and a drawdown method that punishes floating losses.
Your strategy has to be tested against those conditions, not your broker’s.
Backtesting Against the Firm’s Exact Conditions
Generic backtesting asks, “Does this strategy make money?” Prop-firm backtesting asks a harder question: “Would this strategy have breached any rule along the way?”
Build your test around these five inputs.
- Drawdown calculation method. Track equity, not just closed balance, and apply the firm’s exact daily reset time and trailing logic to your historical equity curve.
- Trading hours. Remove any trades that fall outside the firm’s allowed sessions or that would have been held over a weekend if weekend holds are banned.
- Spread and commission schedule. Use the firm’s typical spreads plus its per-lot commission, and widen spreads around session opens where your data supports it.
- Leverage cap. If the firm caps leverage at 1:30 or 1:50 on certain instruments, check that your historical position sizes would even have been allowed.
- Prohibited practices. Strip out trades placed within the firm’s news window if it enforces news trading restrictions, typically two to five minutes either side of high-impact releases.
Then run a forward testing phase on demo for at least two to four weeks under the same rules.
Backtests show what happened.
Forward tests show whether you can actually execute it in real time, with real hesitation, in the current market regime.
How Many Trades You Actually Need
Many evaluations require a minimum number of trading days, often four or five.
This rule quietly causes a lot of breaches.
Traders hit the profit target on day three, then feel pressure to “use up” the remaining days with trades their system never signaled.
Forcing a full-size trade on a flat day is the worst option. You are taking risk with no edge behind it, and you are doing it on an account that is already near the finish line.
If you must place a qualifying trade, make it small.
Many firms count any executed trade as a trading day, so a 0.01-lot position on your normal setup satisfies the requirement at almost zero risk.
Check your firm’s definition first, since a few require a minimum position size or holding time.
One Setup, One Market, or Several?
More markets means more opportunities.
It also means more decisions, more correlated exposure, and more chances to misread a spread or session rule.
During a 30-day evaluation, that trade-off rarely pays.
One clean, well-tested setup on one or two instruments has three advantages.
You know its typical losing streak. You know its spread behavior.
And you make fewer decisions per day, which reduces the decision fatigue that leads to impulsive entries late in a session.
Multiple markets make sense only if each one has its own tested edge and you cap total open risk across all of them. If you cannot write down your maximum combined exposure, you are trading too many things.
Where Indicators Like PipTrend Fit In
Systematic traders often fail challenges not by ignoring their signals, but by finding too many of them. Every chart starts to look like a setup when you are behind on the profit target.
A tool like PipTrend helps here through two features.
Its multi-timeframe table shows trend direction across several timeframes in one view, so you can see at a glance whether the higher timeframes agree.
Its separation of the signal from the entry means a directional bias appears first, and you still wait for your defined entry condition before acting.
That structure makes it harder to chase every flicker on a lower timeframe.
An indicator tells you direction. It does not tell you how much to risk. Indicator confirmation is a filter, never a substitute for position sizing.
A perfectly timed long on a correctly identified trend still breaches the daily limit if you sized it at 3% risk.
Use the indicator to decide whether to trade. Use the position-size formula to decide how much.
Executing Without Blowing the Account
Every trader has a plan when they are calm.
The question is what happens after the third loss of the morning, when the profit target feels further away than it did at breakfast.
Execution rules exist for that moment, and they have to be written before it arrives.
A Losing-Streak Protocol Before It Starts
Losing streaks are not a sign that something is broken.
They are a statistical certainty.
What breaks accounts is the reaction: doubling size to “get it back,” which is revenge trading by another name.
A predefined protocol removes the decision from your hands.
- After two consecutive losses: stop trading for the rest of the session. No exceptions, even if a perfect setup appears an hour later.
- After three consecutive losses: cut risk per trade in half for the next five trades. At 0.5% risk, that means dropping to 0.25%.
- After reaching a set drawdown threshold: pick a number such as 3% total drawdown and, if you hit it, return to demo or simulation until you log ten trades that match your backtested criteria.
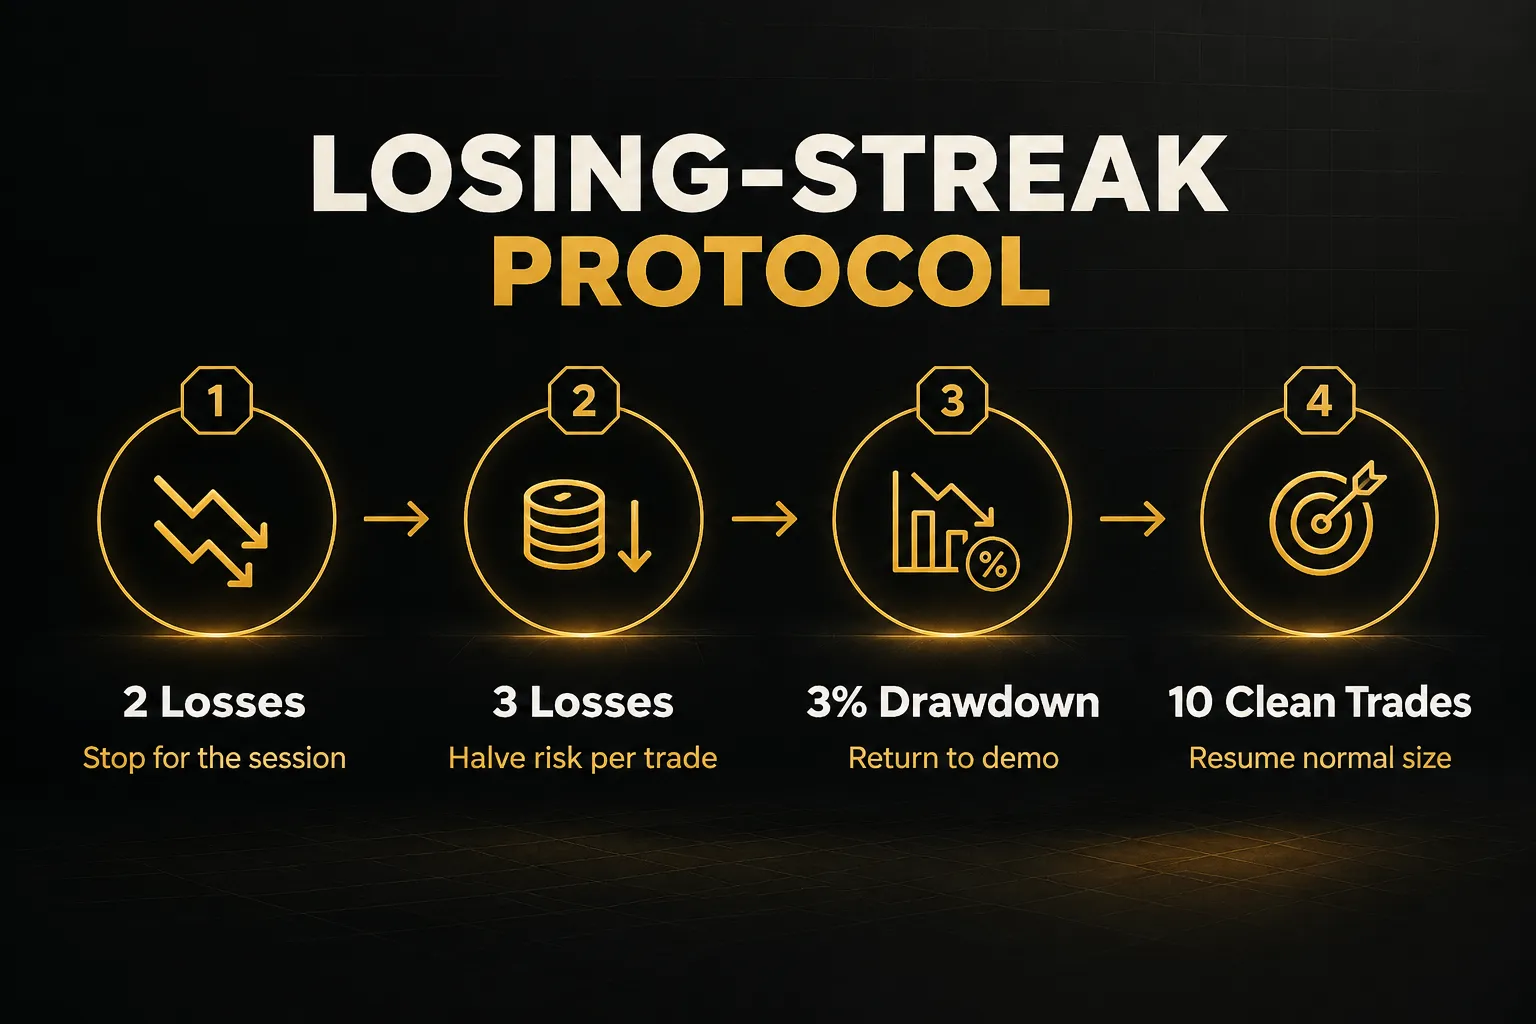
Notice that the protocol triggers well before the firm’s limits.
At 0.5% risk, two losses cost 1% of the account. You walk away with 3% of daily room still intact.
What Belongs in Your Trading Journal
A trade journal during a challenge is not a diary.
It is an audit trail that tells you, within a week, whether your losses come from the strategy or from you. Record these fields for every trade:
- Entry trigger: the exact condition that fired, written the same way every time.
- Stop distance: in pips, plus the resulting lot size and dollar risk.
- R multiple: the result expressed in units of risk, such as +2R or -1R.
- Emotional state: a one-word note (calm, rushed, frustrated) recorded before entry.
- Rule-compliance checklist: a yes or no on position size, news window, session hours, and correlation.
- Backtest match: whether the setup matched your tested criteria or was a judgment call.
After twenty trades, filter by “backtest match: no.” If those trades are underperforming (they usually are), you have found your leak.
After the Target, Before Confirmation
You hit the profit target.
Now what?
Stop trading.
Completely.
There is often a gap between reaching the target and the firm confirming the pass, sometimes a few hours, sometimes a business day or two.
Do not add trades “to be safe” or to build a buffer.
An open position can still trigger an equity-based breach, and a breach before confirmation can void the entire pass.
Preserve the equity curve exactly as it closed. If minimum trading days remain, use the tiny qualifying-trade approach described earlier and nothing else.
The same mindset carries into the funded account.
In the first few weeks, cut position size until you have built a profit buffer of at least 2% to 3%.
Funded accounts usually carry the same drawdown rules, and a single bad day can erase the status you spent weeks earning… along with your next payout.
Common Prop Firm Challenge Questions
How hard is it to pass a prop firm challenge?
Passing a prop firm challenge is hard, with industry estimates commonly placing pass rates in the single digits to low teens.
Most failures come from rule breaches tied to oversized positions, not from bad strategies.
Online evaluation programs differ from traditional proprietary trading firms, which hire and train traders directly.
With online evaluations, your risk budget matters far more than your entry skill.
What is the best strategy to pass a prop firm challenge?
The best strategy is one setup you have backtested under the firm’s exact drawdown, spread, and session rules.
Pair it with a 1:2 or better risk-to-reward ratio and a fixed risk per trade between 0.25% and 1%.
The edge comes from surviving the losing streak, not from finding a perfect entry.
How much money should I risk on a prop firm challenge?
Risk 0.25% to 1% of the account per trade.
On a $100,000 account, 0.5% risk ($500) lets you absorb seven consecutive losses before nearing a 4% daily limit and nine before a 5% maximum drawdown.
Above 1.5%, two or three losses can end the challenge.
Can you pass a prop firm challenge in one day?
You technically can, but most firms now require a minimum number of trading days, and trying is the fastest way to fail.
Hitting an 8% to 10% target in one session requires risk sizes that leave almost no room for a single losing trade.
One-day passes are survivorship stories, not strategies.
What happens if you hit the daily drawdown in a prop firm challenge?
Hitting the daily drawdown limit fails the challenge immediately at nearly every firm.
Open positions are typically closed and the account is disabled, even if you would have recovered later that day.
Some firms offer a paid reset or free retry if you were profitable, but the attempt itself is over.
Is passing a prop firm challenge profitable?
Passing is profitable only if the funded account survives long enough to pay out more than you spent on fees.
A $100,000 challenge often costs a few hundred dollars, and profit splits commonly run 80% to 90%.
Traditional firms pay traders from their own trading revenue.
Many online evaluation firms earn heavily from challenge fees, so repeated resets can easily outweigh your first payout.
Pass the Challenge, Keep the Account
Everything in this guide reduces to one decision rule.
Before your next trade, confirm the position size against the daily loss limit.
Not against gut feeling.
Not against the urgency to finish.
Against the math.
If the lot size, multiplied by the stop distance and pip value, fits inside your personal risk budget with room to spare, take the trade. If it does not, shrink it or skip it.
That is how to pass a prop firm challenge in 2026 without paying for three resets first.
The fastest pass is rarely the goal.
The goal is the only pass that matters: the one that leads to a funded account still standing in month two, still paying out, still trading the same disciplined size that got it there.
Sources
Risk Disclaimer: Trading involves risk. Past performance doesn't guarantee future results. Only trade with money you can afford to lose. PipTrend is a tool to assist your trading decisions, not financial advice.