Nasdaq Composite Index Explained for Traders
On this page
What the Nasdaq Composite Really Tracks
Most traders quote the Nasdaq Composite daily. Very few could tell you what’s actually in it.
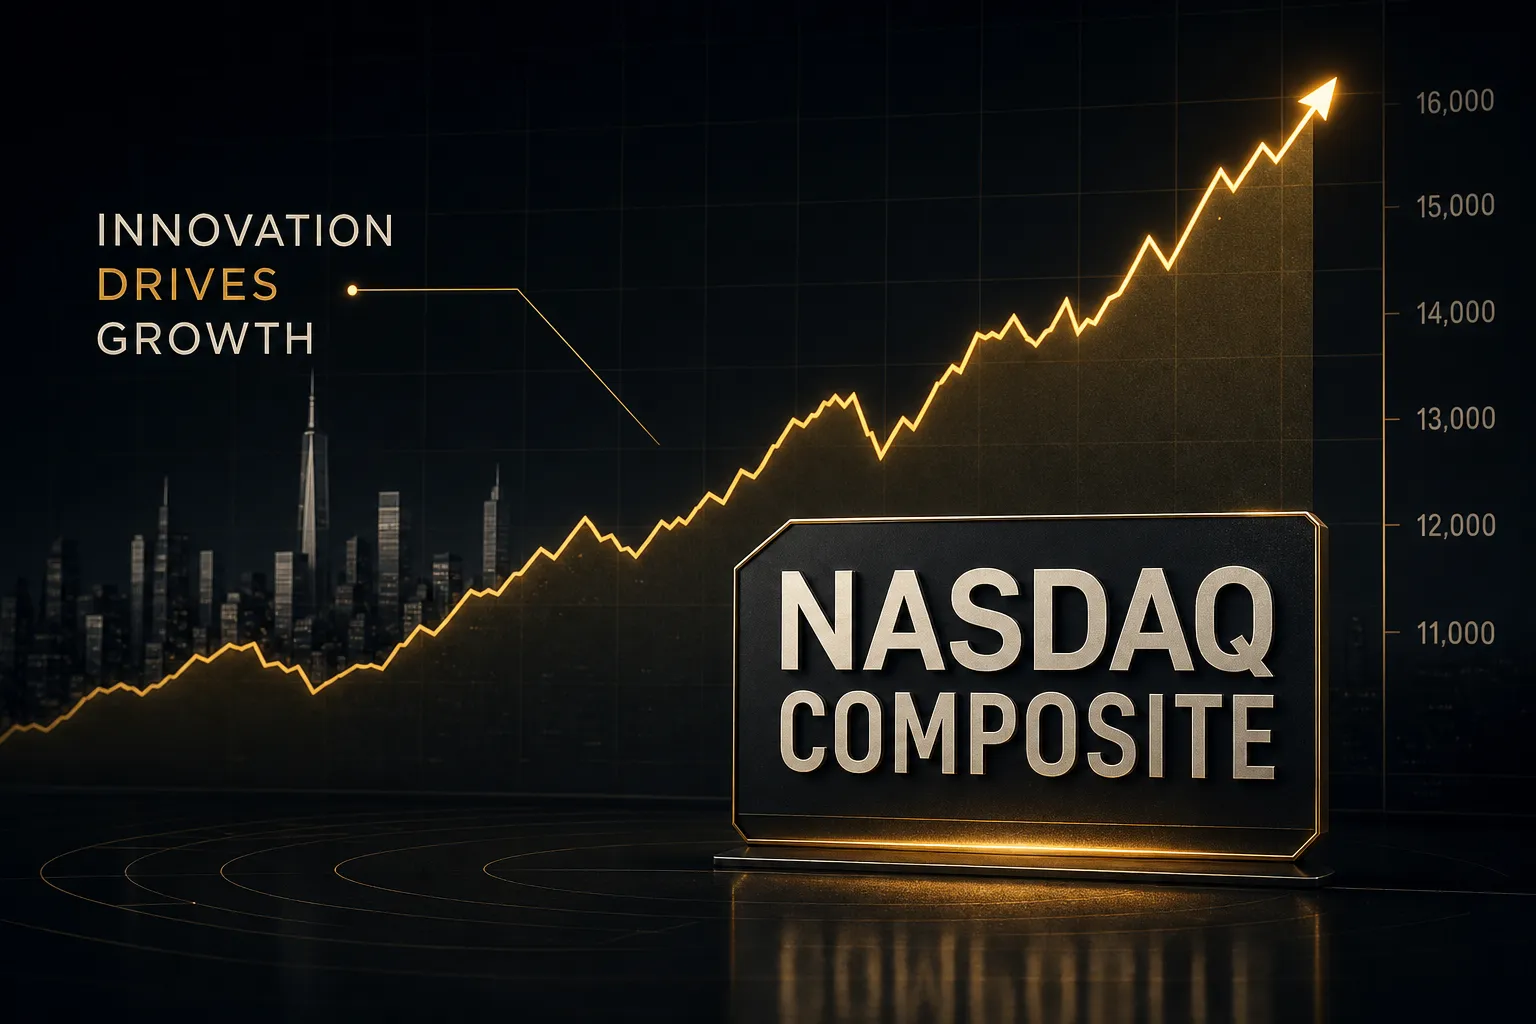
The Nasdaq Composite Index is a broad, market-cap-weighted index covering nearly every domestic and international common-type security listed on the Nasdaq Stock Market.
Not a curated list of tech giants. Everything that qualifies, from trillion-dollar names down to microcaps you’ve never heard of.
That breadth is the whole point.
And it’s also the thing that gets misread most often, because people treat the Composite as a synonym for the Nasdaq-100 when the two behave differently in important ways.
This guide does two jobs.
First, it separates the Composite from the Nasdaq-100 clearly enough that you’ll never confuse them again. Second, it shows how to actually use the index in analysis, as market context, breadth reference, and trend backdrop, rather than just memorising a definition.
One warning before we go further.
Constituent counts and sector weights shift constantly through IPOs, delistings, and mergers. Any article citing “exactly 3,000 stocks” without a measurement date is giving you a number with a short shelf life.
A “current as of” label matters more than a precise figure.
If you’re a beginner trader, a long-term investor, or a researcher who needs accurate data plus practical application, you’re in the right place.
What Is the Nasdaq Composite Index?
The Composite launched in 1971, the same year the Nasdaq Stock Market itself opened for business.
It started at a base value of 100. It was designed as the benchmark for every company that chose to list on Nasdaq rather than the New York Stock Exchange.
The methodology is market capitalization weighting.
Each constituent’s influence on the index is proportional to its total market value, so a company worth $3 trillion moves the index roughly three thousand times more than a company worth $1 billion.
Thousands of members, but a small handful of them do most of the heavy lifting.
Eligibility is simpler than most people assume.
The security has to be listed exclusively on the Nasdaq Stock Market (with limited dual-listing exceptions) and it has to be a common-type security.
That’s it.
No profitability screen, no minimum market cap threshold beyond listing requirements, no sector exclusions.
The Composite is closer to a census of the Nasdaq market than a selection of it. That’s what makes it useful as a breadth gauge and misleading as a “tech index” label.
Ticker Symbols Explained (COMP vs IXIC)
COMP is Nasdaq’s official ticker for the price-return version of the Composite. That’s the symbol the exchange itself uses in its own index documentation and on its official index pages.
But open Yahoo Finance and you’ll see ^IXIC. Google Finance shows IXIC too.
Various charting platforms use .IXIC, $COMPQ, COMPQ, or NASDAQ:IXIC depending on their internal conventions.
These are not different indexes.
They all point to the same underlying calculation. The Nasdaq Composite ticker you see simply depends on which data vendor built the feed, and the caret or dollar prefix usually just flags “this is an index, not a tradeable stock.”
Practical takeaway: when you pull a level, note the source and the timestamp.
Index levels update continuously through the 9:30 a.m. to 4:00 p.m. ET session, and free feeds are frequently delayed by 15 minutes.
If you’re comparing two charts and the numbers differ slightly, delay is usually the culprit, not a data error.
Price Return vs Total Return Versions
Here’s where fund comparisons quietly go wrong.
The Composite exists in three versions, and they diverge more than you’d expect over time.
The price return index (the COMP/IXIC level everyone quotes) tracks price movement only.
Dividends vanish from the calculation entirely.
This is the headline number on every news broadcast.
The total return index comes in two flavours.
Gross total return assumes all dividends are reinvested with no tax drag. Net total return reinvests dividends after deducting withholding taxes at the rates applicable to non-resident investors.
Why does this matter?
Because an index fund tracking the Composite collects and reinvests dividends. Its performance will drift above the price-return index over multi-year periods.
Compare a fund’s five-year return against the IXIC price chart and the fund looks like it’s beating the index.
It isn’t.
You’re comparing two different measurements.
The Composite’s dividend yield is modest, historically well under 1% given its growth-stock tilt, but compounding turns even that into a visible gap across a decade.
Composite vs Nasdaq-100: The Real Differences
Financial media uses “the Nasdaq” to mean both indexes interchangeably.
That habit costs traders money, because the two respond to different forces and tell you different things about market health.
The Nasdaq-100 holds the 100 largest non-financial companies listed on the exchange.
The Composite holds essentially everything.
When a Composite rally is driven by seven mega-caps while 60% of constituents decline, the Nasdaq-100 will look strong and the Composite will look strong, but only breadth data reveals the rot underneath.
| Feature | Nasdaq Composite (COMP / IXIC) | Nasdaq-100 (NDX) |
|---|---|---|
| Number of constituents | Roughly 3,000+ (varies weekly with listings and delistings) | Exactly 100 companies (around 101 securities with dual share classes) |
| Financial companies | Included: banks, insurers, asset managers all eligible | Excluded by rule, non-financial companies only |
| Weighting method | Market capitalization weighting, uncapped | Modified market cap weighting with concentration caps applied |
| Minimum size requirement | None beyond basic Nasdaq listing standards | Among the largest by market cap, plus liquidity and seasoning tests |
| Rebalancing / reconstitution | Continuous: additions and removals as listings change, quarterly share updates | Annual reconstitution each December, quarterly rebalances, special rebalances when caps breach |
| Security types allowed | Common stock, ADRs, ordinary shares, tracking stocks, limited partnership interests | Common stock and ADRs of qualifying non-financial issuers |
| Best used as | Broad market-breadth gauge for growth and innovation exposure | Mega-cap growth and technology proxy |
| Typical trading products | ETFs such as ONEQ, some mutual funds | QQQ, NQ futures, NAS100 CFDs, extensive options market |
Notice the last row.
Liquidity is the practical reason most active traders watch the Composite but trade Nasdaq-100 instruments. The derivatives ecosystem around NDX is deep.
The Composite’s is thin.
There’s a useful analytical trick here.
Compare Composite performance against Nasdaq-100 performance over a rolling period. When NDX consistently outruns COMP, market leadership is narrowing into mega-caps. When COMP keeps pace or leads, smaller constituents are participating and the advance has a broader base.
That relative strength spread is one of the cleanest concentration signals available for free.
What’s Actually Inside the Index
“The Nasdaq is a tech index.” That statement is roughly half true, and the other half is where the interesting information lives.
Eligible and Excluded Securities
The Composite’s inclusion rules are about security type, not company quality. A security must be listed exclusively on the Nasdaq Stock Market and fall into one of the accepted categories.
Eligible security types:
- Common stock. The bulk of the index. Standard equity shares in US-domiciled operating companies, from mega-cap to micro-cap.
- American Depositary Receipts (ADRs). These give the Composite genuine international exposure, since foreign issuers can access US markets through depositary receipts without a full US listing structure.
- Ordinary shares. Foreign companies that list directly rather than through an ADR programme, common among Israeli, Chinese, and European tech issuers.
- Tracking stocks. Securities tied to the performance of a specific business unit inside a larger parent company rather than the whole enterprise.
- Limited partnership interests. Relatively rare in the index but eligible under the common-type security definition.
- Shares of beneficial interest (SBIs). Including certain trust structures that behave like common equity.
Excluded from the index:
- Exchange-traded funds. Including ETFs listed on Nasdaq itself, because including funds that hold index constituents would double-count exposure.
- Preferred stock. Behaves more like a bond than equity, with fixed dividends and no meaningful growth participation.
- Rights and warrants. Derivative-like instruments with expiry dates and conditional value.
- Convertible debentures and closed-end funds. Not common-type equity securities.
- Any derivative instrument. Options, futures, and structured products sit outside the index entirely.
- Securities dual-listed on another US exchange. Exclusive Nasdaq listing is the baseline requirement.
Sector Weightings and Concentration
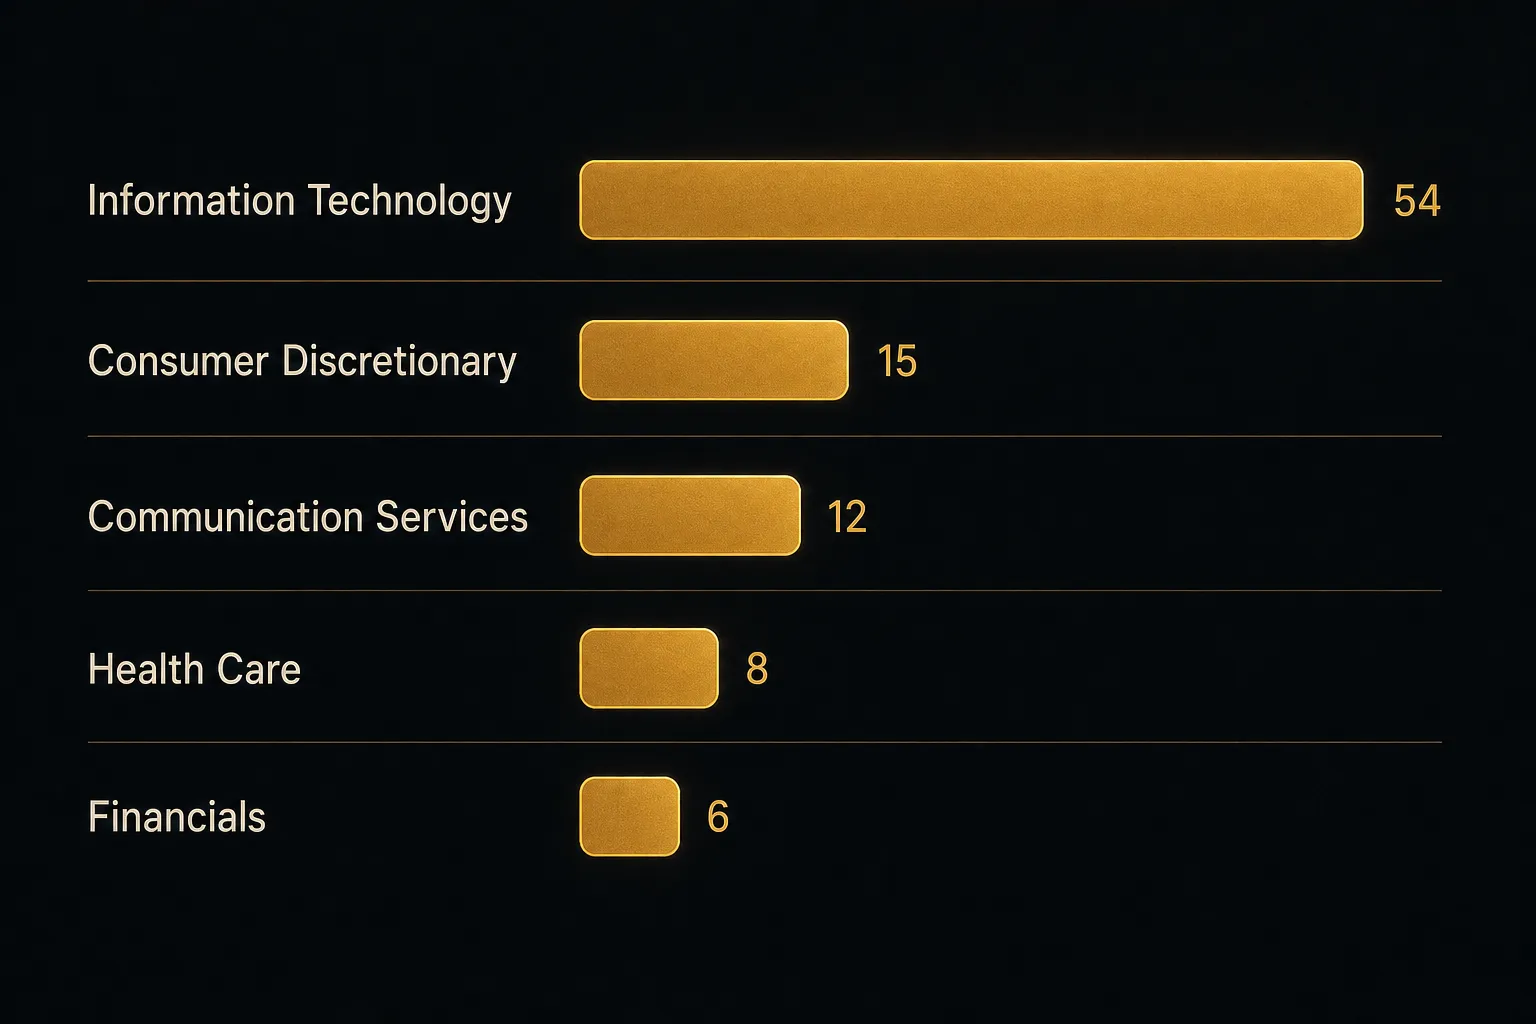
Technology dominates, but it doesn’t own the whole thing. Approximate sector exposure as of early 2026, using standard sector classifications:
- Information technology: roughly 50 to 58%. Semiconductors, software, hardware, and IT services. The single largest bloc by a wide margin and the primary driver of index volatility.
- Consumer discretionary: roughly 12 to 18%. Dominated by a small number of e-commerce and electric vehicle mega-caps, with hundreds of smaller retail and leisure names contributing marginally.
- Communication services: roughly 10 to 15%. Search, social media, streaming, and telecoms, a category created largely to house what used to be classified as pure technology.
- Health care: roughly 6 to 10%. Heavy in biotech by count, light by weight. Hundreds of clinical-stage biotechs sit in the index with market caps under $500 million.
- Financials: roughly 4 to 7%. Regional banks, exchanges, and fintech. Entirely absent from the Nasdaq-100, which is the single biggest structural difference between the two indexes.
- Industrials: roughly 3 to 6%. Transport, machinery, and commercial services.
- Consumer staples, energy, utilities, materials, real estate: combined 4 to 8%. Thin representation, since these sectors historically favoured NYSE listings.
Now the concentration problem.
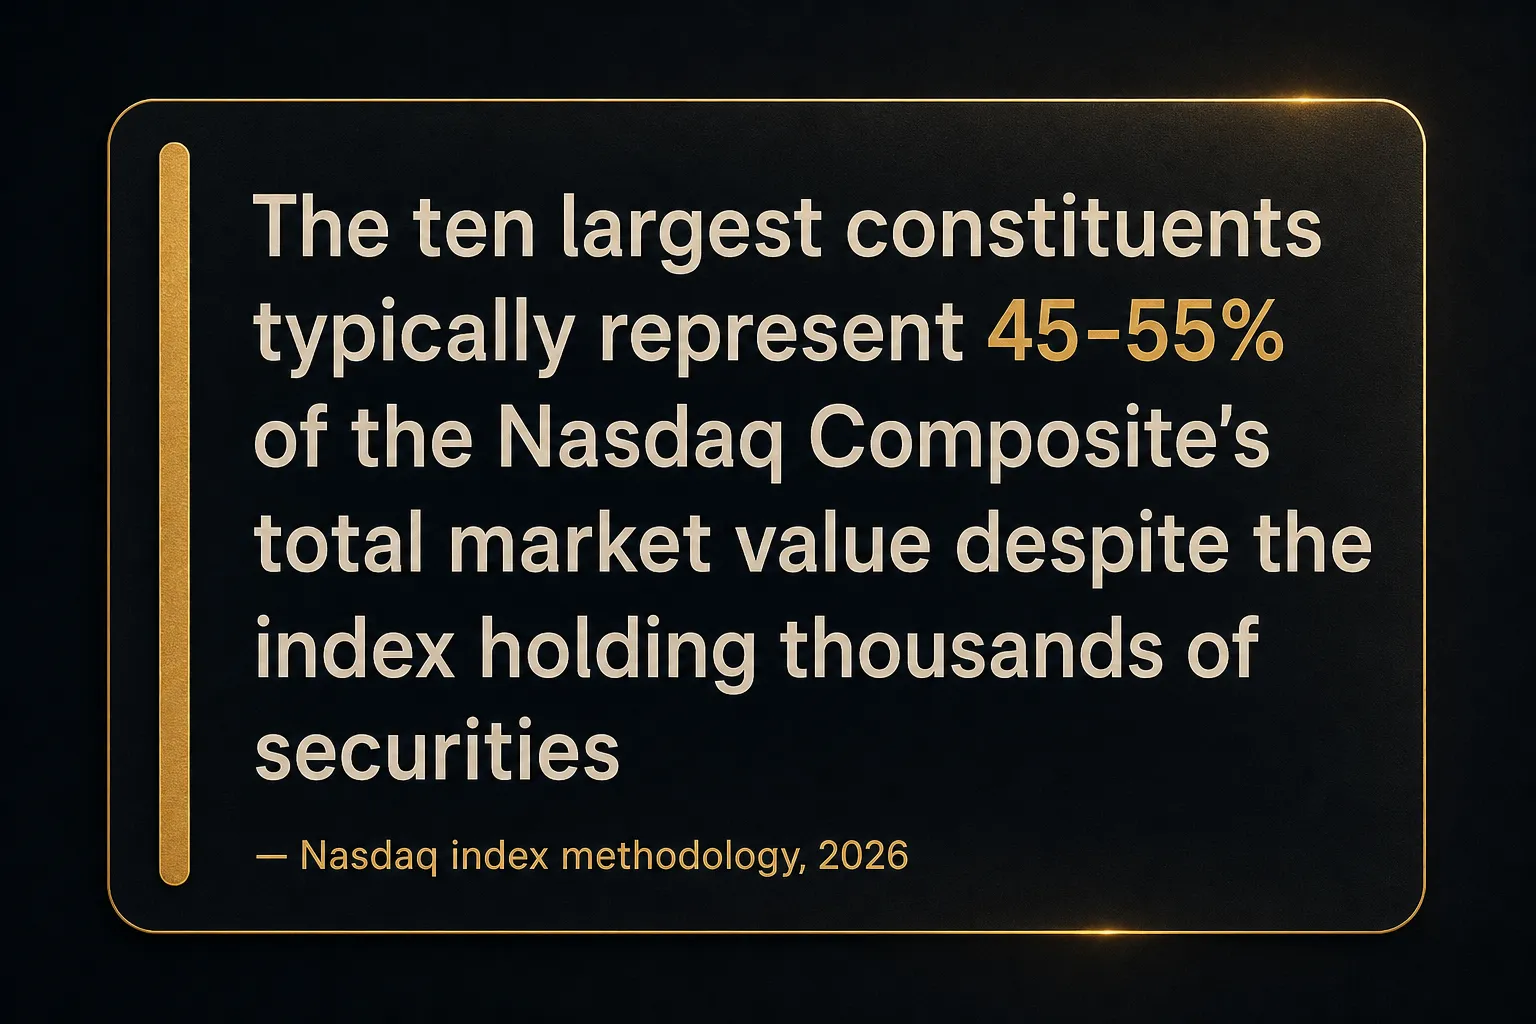
Because weighting is uncapped and market-cap based, the ten largest constituents routinely account for 45% to 55% of total index value.
Thousands of companies.
Half the movement from ten of them.
Do the arithmetic and it gets stark.
A 3% move in a $3 trillion company shifts the index more than a 30% move across two hundred $1 billion companies combined.
The Composite looks diversified.
Its daily behaviour is anything but.
Why the Constituent Count Keeps Changing
You’ll see 2,500 in one article, 3,700 in another, and “over 3,000” in a third. All of them can be correct, just at different times.
The count moves for five reasons:
- IPOs. Newly listed Nasdaq companies join the index shortly after listing, subject to a brief seasoning period. Hot IPO years can add hundreds of names.
- Delistings. Companies failing minimum bid price, market value, or corporate governance standards get removed. Bear markets clear out microcaps aggressively.
- Mergers and acquisitions. Two constituents merging reduces the count by one, and an acquisition by a private buyer removes the name completely.
- Exchange transfers. Companies occasionally move from Nasdaq to NYSE or vice versa, and exclusive listing is a requirement.
- SPAC cycles. Blank-cheque vehicles list, merge, or liquidate in waves, which can swing the count by hundreds within eighteen months.
The honest answer as of early 2026: approximately 3,000 to 3,400 securities, with the figure best treated as a range rather than a fixed count.
Cite the number, cite the date, or don’t cite it at all.
Using the Composite in Trading and Investing
A rising Composite does not mean most Nasdaq stocks are rising. Internalise that sentence and you’re already ahead of most retail participants.
Trend, Momentum, and Market Breadth
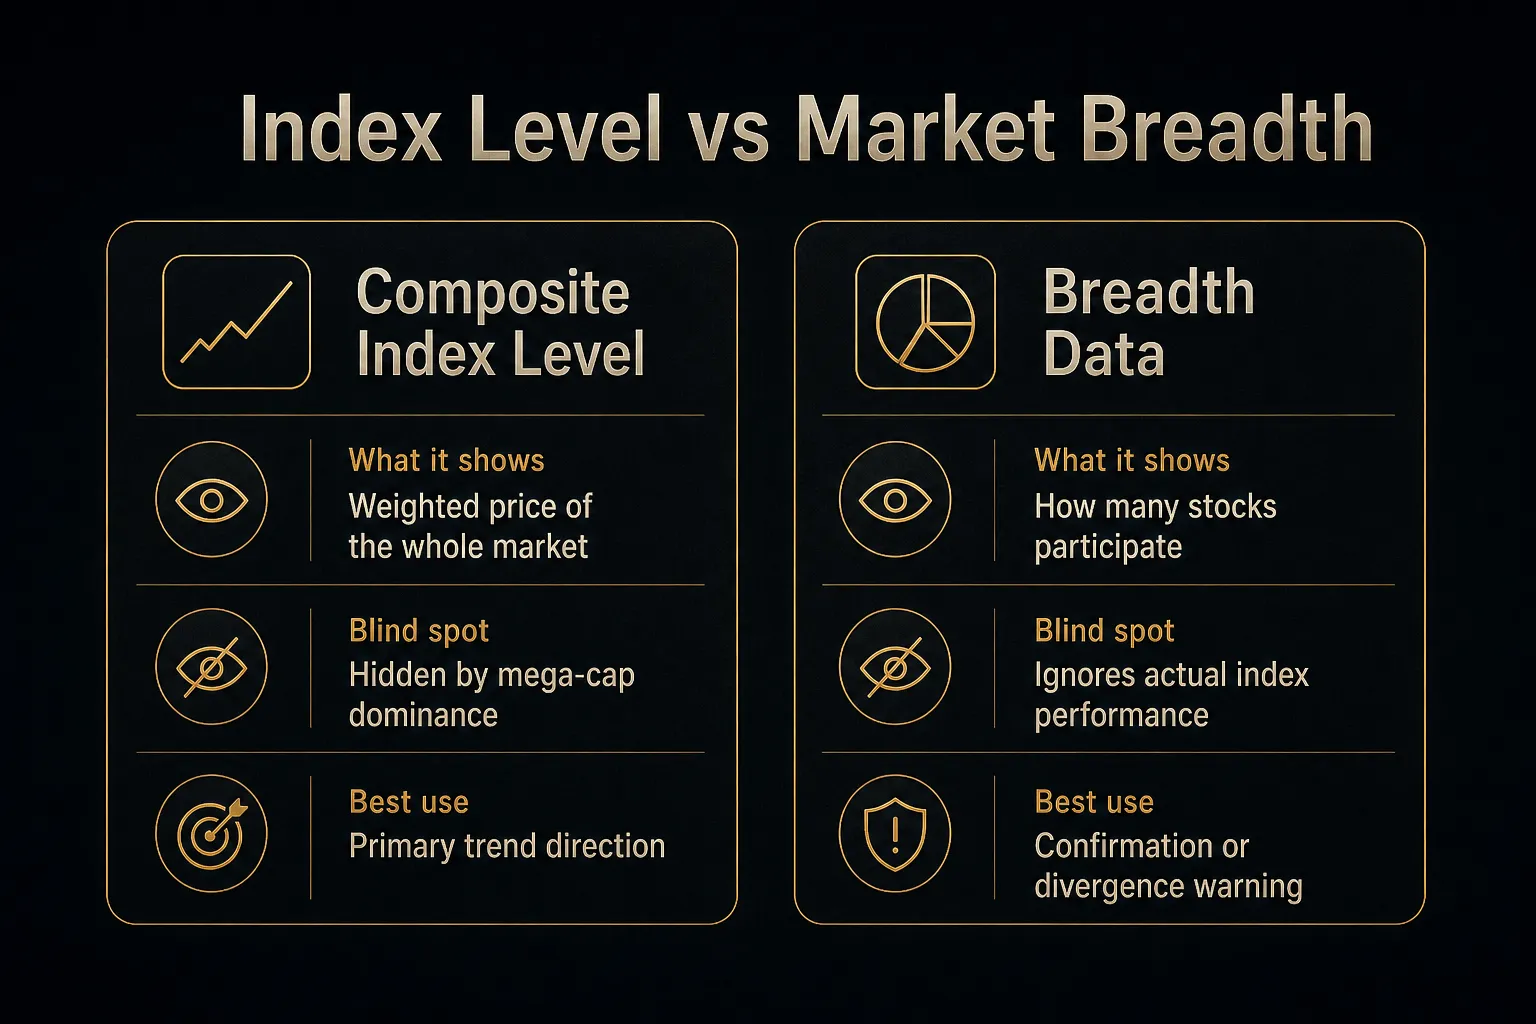
Because of cap weighting, the Composite can print new all-time highs while the majority of its constituents trade below their own 200-day moving averages. This happened repeatedly through 2023 and 2024, and it’s the reason experienced traders never read the index level in isolation.
Market breadth answers the question the index level can’t: how many stocks are actually participating?
Three tools do most of the work.
The advance-decline line is a running cumulative total of advancing issues minus declining issues. When the index makes a higher high and the A-D line makes a lower high, that’s a bearish divergence, and it has preceded several significant Nasdaq corrections.
New highs versus new lows tracks how many constituents hit 52-week extremes. An index near record levels with new lows outnumbering new highs is a warning that the average stock is in trouble even as the headline number celebrates.
Percentage of stocks above their 50-day and 200-day moving averages gives you a clean participation reading. Below 40% of constituents above the 200-day while the index sits near highs?
Leadership is dangerously narrow.
For trend work itself, standard tools apply. Traders track the Composite’s moving averages (20, 50, and 200-day are the common set), watch prior swing highs and lows as support and resistance, and use momentum indicators like RSI or MACD to gauge whether a move is accelerating or tiring.
The key discipline: the Composite provides context.
It tells you whether the tide is coming in or going out.
It doesn’t tell you which boat to buy.
Confirming Setups with PipTrend
Since the Composite itself isn’t directly tradeable, most execution happens on Nasdaq-linked instruments, primarily NAS100 CFDs or index futures. The workflow is to establish broad direction from the Composite, then find alignment on the instrument you’ll actually trade.
This is where multi-timeframe confirmation earns its keep. PipTrend’s multi-timeframe table displays trend direction across several timeframes simultaneously, so you can see at a glance whether the 4-hour, daily, and weekly views agree on NAS100 or related instruments.
The trend-colored candles do the same job visually on the chart itself. Instead of eyeballing whether price is above a moving average and guessing at slope, the candle colouring reflects the prevailing trend state directly.
Used properly, the sequence looks like this.
Composite trend is up and breadth is healthy. You check the multi-timeframe table on NAS100 and find the daily and 4-hour aligned bullish.
Only then do you look for an entry on your execution timeframe.
Trend alignment is confirmation, not a trigger. It filters out trades fighting the broader tape. It does not tell you when to press the button.
The inverse is equally valuable.
When the Composite is trending up but your multi-timeframe table shows conflict across timeframes, that disagreement is information.
Reduce size or stand aside until the picture clears.
Funds, Limitations, and What the Index Can’t Tell You
You cannot buy the Nasdaq Composite.
An index is a calculation, not a security. What you can buy is a fund that attempts to replicate it.
The best-known vehicle is ONEQ, the Fidelity Nasdaq Composite Index ETF, which uses a sampling approach rather than holding all three thousand-plus constituents. Full replication of thousands of illiquid microcaps would be prohibitively expensive, so the fund holds a representative subset.
That sampling creates tracking error, the gap between fund performance and index performance. Three factors drive it: the sampling method itself, the expense ratio (ONEQ charges around 0.21%, roughly four times QQQ’s 0.20%… actually comparable, but well above broad-market S&P funds at 0.03%), and cash drag from dividend timing.
Liquidity matters too.
ETF exposure to the full Composite is far less liquid than Nasdaq-100 products, which means wider spreads and worse fills on size. QQQ trades tens of millions of shares daily.
ONEQ trades a small fraction of that.
Now the limitations you need to price in.
Concentration risk. Half the index value sits in ten companies.
If you own a Composite fund thinking you own three thousand stocks, you effectively own a mega-cap tech portfolio with a long tail attached.
Interest-rate sensitivity. Growth-stock valuation depends heavily on discounted future cash flows, and higher discount rates compress those valuations disproportionately.
The Composite historically falls harder than the S&P 500 during aggressive tightening cycles. In 2022 it dropped roughly 33% against the S&P 500’s 19%.
Sector imbalance. Minimal energy, utilities, and materials exposure means the Composite lags badly when value and commodity sectors lead.
It’s a growth vehicle, full stop.
Volatility from the tail. Thousands of small and micro-cap constituents, many pre-revenue biotechs and speculative names, add churn without adding much weight.
They contribute to volatility analysis readings and breadth statistics far more than they contribute to returns.
What the index genuinely can’t tell you: whether individual constituents are cheap, which sectors are rotating into leadership, how much of a move came from one earnings report, or anything at all about the median Nasdaq stock. For that, you need breadth data and sector-level analysis alongside the headline number.
Nasdaq Composite FAQ
What is the Nasdaq Composite Index in simple terms?
The Nasdaq Composite is a stock market index that tracks the combined value of nearly every company listed on the Nasdaq Stock Market, weighted so that larger companies have proportionally more influence.
Think of it as a scoreboard for the entire Nasdaq exchange rather than a selected group of stocks. It launched in 1971 at a base value of 100 and includes common stock, ADRs, ordinary shares, tracking stocks, and limited partnership interests, but excludes ETFs, preferred stock, and derivatives.
What is the current Nasdaq Composite Index?
The Composite’s level changes continuously throughout the trading session, so any figure printed in an article is out of date within seconds.
Check Nasdaq’s official index page or a live quote provider using the ticker COMP, IXIC, or ^IXIC depending on the platform. Trading runs from 9:30 a.m. to 4:00 p.m. Eastern on US market days, and free data feeds are often delayed by 15 minutes.
Always confirm the timestamp on whatever source you use.
What is the difference between Nasdaq Composite and Nasdaq-100?
The Composite includes roughly 3,000-plus Nasdaq-listed securities including financial companies, while the Nasdaq-100 holds only the 100 largest non-financial companies on the exchange.
The Composite uses uncapped market capitalization weighting and updates its membership continuously as companies list and delist. The Nasdaq-100 applies concentration caps, excludes financials entirely, and reconstitutes annually each December.
Use the Composite as a broad market gauge and the Nasdaq-100 as a mega-cap growth proxy.
How many stocks are in the Nasdaq Composite?
Approximately 3,000 to 3,400 securities as of early 2026, though the exact figure changes weekly.
IPOs add constituents, while delistings, mergers, and exchange transfers remove them. Published sources cite anywhere from 2,500 to 3,700 depending on when they measured and whether they counted securities or unique companies (some companies have multiple share classes).
Treat any exact number without a stated date with suspicion.
What companies make up the Nasdaq Composite?
The largest weightings are dominated by mega-cap technology and consumer names such as Apple, Microsoft, Nvidia, Amazon, Alphabet, Meta, Broadcom, and Tesla, though the exact ranking shifts with market values.
Beyond the top tier, the index spans health care and biotech, regional banks and fintech, industrials, transport, and hundreds of small-cap companies across every sector.
Financial companies are included, which sets the Composite apart from the Nasdaq-100. Membership is not a fixed list, so check Nasdaq’s official constituent data for current holdings.
Can you buy the Nasdaq Composite Index?
No.
An index is a calculation, not a tradeable security, so investors gain exposure through ETFs or index funds that track it.
ONEQ, the Fidelity Nasdaq Composite Index ETF, is the primary vehicle and uses a sampling approach rather than holding every constituent.
Before buying, compare the expense ratio, historical tracking error, and average daily trading volume. Composite-tracking products are considerably less liquid than Nasdaq-100 funds like QQQ.
Treat the Index as a Map, Not a Signal
The Nasdaq Composite is one of the most quoted numbers in finance and one of the most casually misinterpreted. Its value comes from context, not from crossings.
Used well, it tells you the direction of the growth-heavy end of the US market and gives you a reference point for measuring individual stock relative strength. Used badly, it becomes a buy signal that ignores the fact that ten companies are carrying the entire move.
Here’s a decision rule worth keeping.
When the Composite’s primary trend and market breadth agree, treat conditions as confirmed and size positions normally. When they diverge, when the index climbs while the advance-decline line rolls over, wait for alignment before committing meaningful capital.
Divergence isn’t a sell signal on its own. It’s a reason to tighten risk, shorten holding periods, and stop assuming every dip gets bought.
Before your next session, do two things.
Pull current breadth data on the Nasdaq and note whether participation confirms the headline trend. Then check multi-timeframe alignment on the Nasdaq-linked instrument you actually trade.
The index draws the map.
Your setup, your risk, and your timeframe decide the route.
Risk Disclaimer: Trading involves risk. Past performance doesn't guarantee future results. Only trade with money you can afford to lose. PipTrend is a tool to assist your trading decisions, not financial advice.