100 Nasdaq Explained: Index, Symbols, and Trading Basics
On this page
What Does “100 Nasdaq” Actually Mean?
Type “100 nasdaq” into a search bar and you’ll get five different answers to five different questions. That’s because the phrase is doing a lot of work for a lot of people.
Some readers want a definition of the Nasdaq-100 Index.
Others want today’s price.
A third group wants the constituent list, a fourth wants to know how to buy the QQQ ETF, and a fifth is looking at NQ or MNQ futures contracts on a trading platform and wondering what they actually control.
Here’s the correction that solves most of the confusion: the Nasdaq-100 and the Nasdaq Composite are not the same index.
One holds 100 companies.
The other holds roughly 3,000.
People quote them interchangeably, and the numbers they cite are usually wrong as a result.
This guide separates the pieces.
First, how the index is actually built, including the rules most articles get wrong. Then the symbols: NDX, NQ, MNQ, and QQQ, and what each one costs to trade.
After that, what genuinely moves the price, and finally a repeatable workflow for reading the chart if you plan to trade it.
What this is not: a live quote page.
Prices change every second the market is open, and any number printed here would be stale before you finished reading the sentence.
It’s also not a static list of holdings, because membership changes and weights shift every quarter.
Understanding how an index is constructed tells you more about its future behaviour than knowing today’s closing price.
Read it as a framework.
The specific numbers you’ll pull from a live data feed.
The structure you’ll keep.
What Is the Nasdaq-100, Really?
The Nasdaq-100 Index tracks the 100 largest non-financial companies listed on the Nasdaq stock exchange, ranked primarily by market capitalisation and screened for liquidity. Launched in January 1985 with a base value of 250, it has become the headline benchmark for large-cap growth in the United States.
The word “non-financial” matters.
Banks, insurers, and most investment companies are excluded by rule, which is why you won’t find a traditional lender in the constituent list even if it trades on Nasdaq.
That single exclusion is a big part of why the index behaves differently from the S&P 500.
Eligibility isn’t just about size.
A company must be listed exclusively on Nasdaq, have traded for at least three months, meet minimum average daily volume thresholds, and stay current on its filings.
Size gets you considered.
Liquidity and compliance keep you in.
Nasdaq-100 vs Nasdaq Composite
This is the mix-up that costs people money.
The Nasdaq Composite includes essentially every common stock listed on the Nasdaq exchange, which is roughly 3,000 securities, financials included. The Nasdaq-100 holds 100 companies and excludes financials entirely.
They correlate closely, often above 0.95 on daily returns, because the same mega-caps dominate both.
But they are not interchangeable.
The Composite carries hundreds of small and micro-cap names that give it different market breadth characteristics, especially during risk-off periods when small caps fall harder.
When a news anchor says “the Nasdaq closed up 1.2%,” they usually mean the Composite. When a futures trader says “Nasdaq,” they almost always mean the Nasdaq-100 via NQ.
Same word, different instrument.
Not Just a Tech Index
Calling the Nasdaq-100 a tech index is convenient shorthand that’s been wrong for over a decade. Technology is the largest sector, typically around half the index weight, but it’s nowhere near the whole story.
Consumer discretionary shows up through Amazon and Tesla. Communication services brings in Alphabet, Meta, Netflix, and Comcast.
Healthcare contributes biotech and medical device names like Amgen, Gilead, and Regeneron. Industrials, consumer staples (PepsiCo, Mondelez, Costco), and even utilities have representation.
Why does the label matter?
Because if you assume you’re buying pure technology exposure, you’ll misjudge how the index responds to consumer spending data, drug approval news, or freight volumes.
You’re buying large-cap growth with a technology tilt.
That’s a different bet.
How Weighting Really Works
Here’s a myth worth killing: the Nasdaq-100 does not always contain exactly 100 tradable securities.
It contains 100 companies.
Because some issuers have multiple share classes, the number of listed securities can exceed 100.
Alphabet is the classic example, with both GOOGL and GOOG in the index.
The company counts once toward the 100.
Its securities count twice on the tape.
Modified market-cap rules
The index uses modified market capitalisation weighting, not pure market cap.
In a pure scheme, a company worth 10% of total index value gets a 10% weight, no ceiling.
Under the modified rules, Nasdaq applies caps to prevent any single name or small group from dominating.
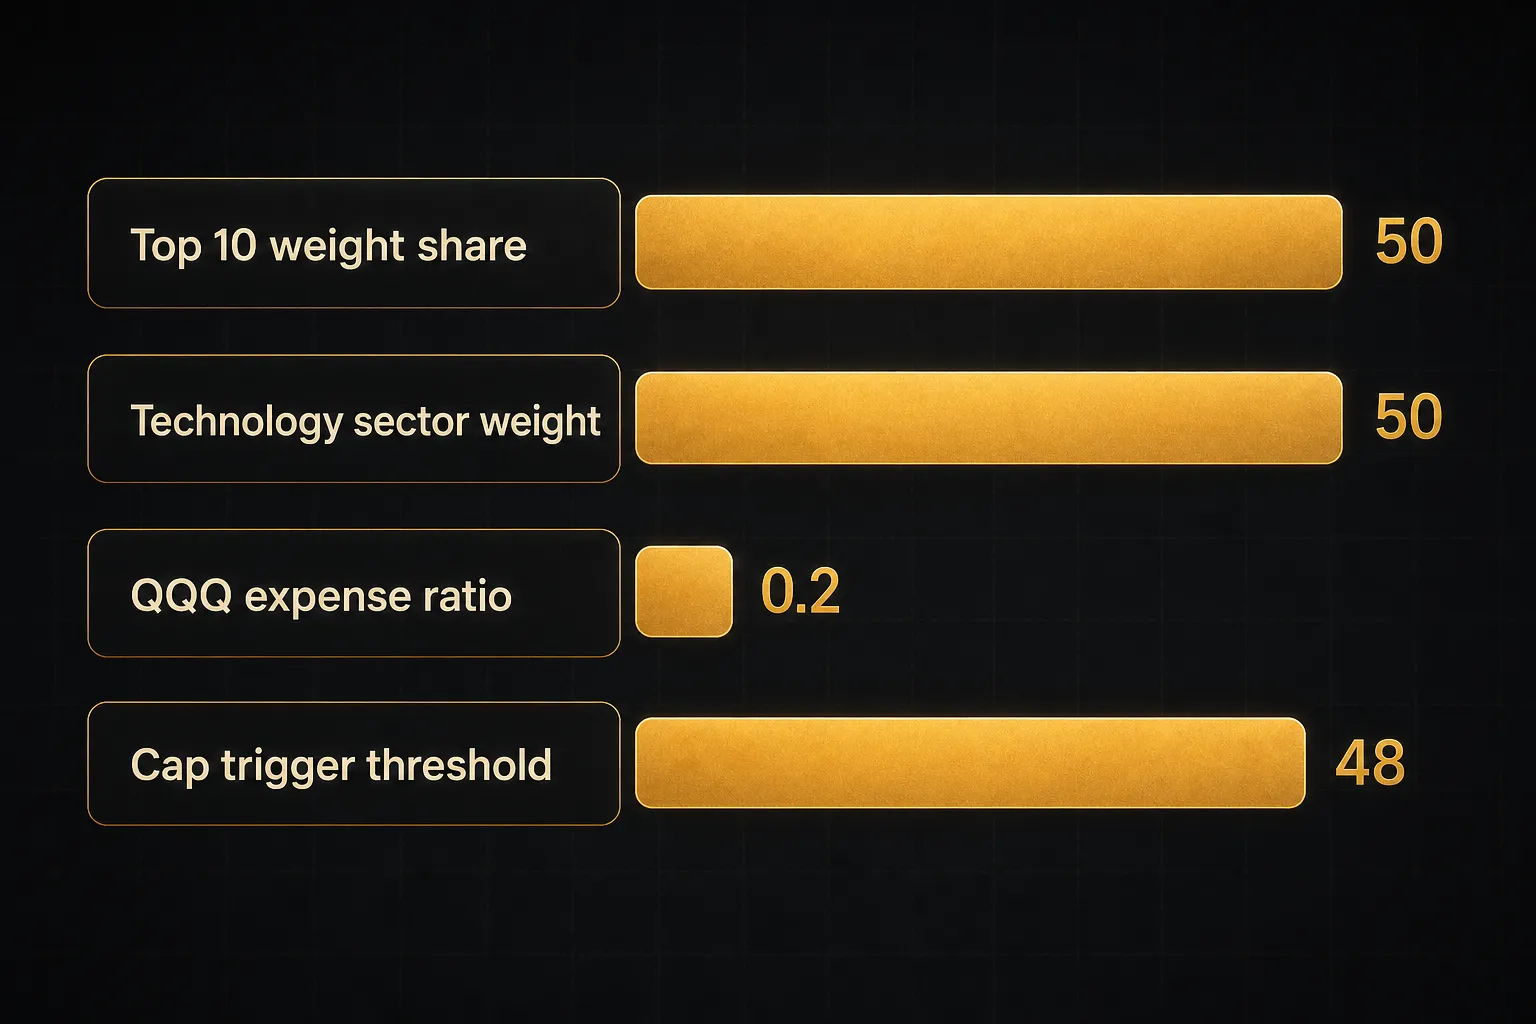
The core constraint: if the combined weight of all constituents individually exceeding 4.5% of the index rises above 48%, a special rebalance is triggered and those weights are scaled down. This has happened, notably in July 2023 when the top handful of names had swollen past the threshold.
Two calendar events drive changes.
Quarterly rebalancing adjusts weights in March, June, September, and December.
Annual reconstitution, effective in December, changes membership itself, adding qualifying companies and removing those that no longer make the cut.
Index funds tracking the benchmark must trade to match these changes. Billions in flows concentrate around those dates, and the result is often elevated volume and short-term price dislocation in the affected names.
Traders watch reconstitution announcements for exactly this reason.
Concentration risk in top names
Even with caps, mega-cap concentration is the defining structural feature of this index. The top 10 constituents have regularly accounted for roughly 50% or more of total index weight in recent years.
Put plainly: the bottom 50 companies combined often carry less weight than the single largest holding. A 5% drop in one mega-cap can outweigh gains across dozens of smaller members.
That’s not automatically bad.
It’s just a fact about what you own, and it explains why the index can rise on a day when more constituents fall than rise.
Symbols and Ways to Get Exposure
You cannot buy the Nasdaq-100 Index.
Not directly, not ever.
The index is a calculation, a number published by Nasdaq that represents a weighted basket.
There’s nothing to take delivery of.
Exposure comes through three routes: an ETF that holds the underlying stocks, a futures contract that settles against the index value, or options on the index itself. Each carries different capital requirements, tax treatment, and risk.
NDX, NQ, MNQ, and QQQ Compared
The four symbols below cover the vast majority of retail and institutional exposure. Contract specifications reflect standard terms as of 2026; always verify current specs with your broker, since exchanges do adjust them.
| Instrument | Symbol | What It Is | Size / Multiplier | Tick Value | Trading Hours (ET) | Typical User |
|---|---|---|---|---|---|---|
| Nasdaq-100 Index | NDX | Cash index value; underlying for index options | $100 per index point (options) | Varies by option premium | 9:30am to 4:15pm | Options traders, benchmark reference |
| E-mini Nasdaq-100 Futures | NQ | Cash-settled futures contract on the index | $20 per index point | $5.00 per 0.25 tick | Sunday 6pm to Friday 5pm, near 24 hours | Active traders, hedgers, institutions |
| Micro E-mini Nasdaq-100 | MNQ | One-tenth size version of NQ | $2 per index point | $0.50 per 0.25 tick | Sunday 6pm to Friday 5pm, near 24 hours | Retail traders, precise position sizing |
| Invesco QQQ Trust | QQQ | ETF holding the actual constituent shares | 1 share, roughly 1/40th of index value | $0.01 per share | 9:30am to 4:00pm plus extended sessions | Long-term investors, retirement accounts |
The size difference between NQ and MNQ is the single most useful fact for a new trader.
With NQ, a 100-point move is $2,000 per contract. With MNQ, the same move is $200.
Ten times the granularity for position sizing.
QQQ is the only instrument on that list where you own something.
Buy a share and you hold a proportional claim on the underlying basket, dividends included.
Futures give you exposure without ownership, and they expire quarterly (March, June, September, December), which means rolling positions if you want to stay in.
Price Return vs Total Return
The headline NDX figure is a price return index. It measures price movement only and ignores dividends entirely.
Nasdaq also publishes a total return version (XNDX) that assumes dividends are reinvested.
Over long horizons the gap compounds meaningfully.
Nasdaq-100 constituents yield less than the broad market, often under 1%, but a 0.7% annual difference over 20 years is not trivial.
This explains why QQQ’s performance never matches the quoted index exactly. Three forces pull them apart: the expense ratio (0.20% annually for QQQ), dividend timing and distribution mechanics, and normal tracking error from trade execution during rebalances.
One more practical trap.
Data feeds differ.
Free financial sites often show delayed quotes, typically 15 minutes, while your broker shows real time.
If two sites disagree on the “Nasdaq-100 price,” check whether you’re comparing NDX, NQ front-month futures, or QQQ multiplied by roughly 40.
They’re related but never identical, and futures trade overnight when the cash index is closed.
What Moves the Nasdaq-100 Price
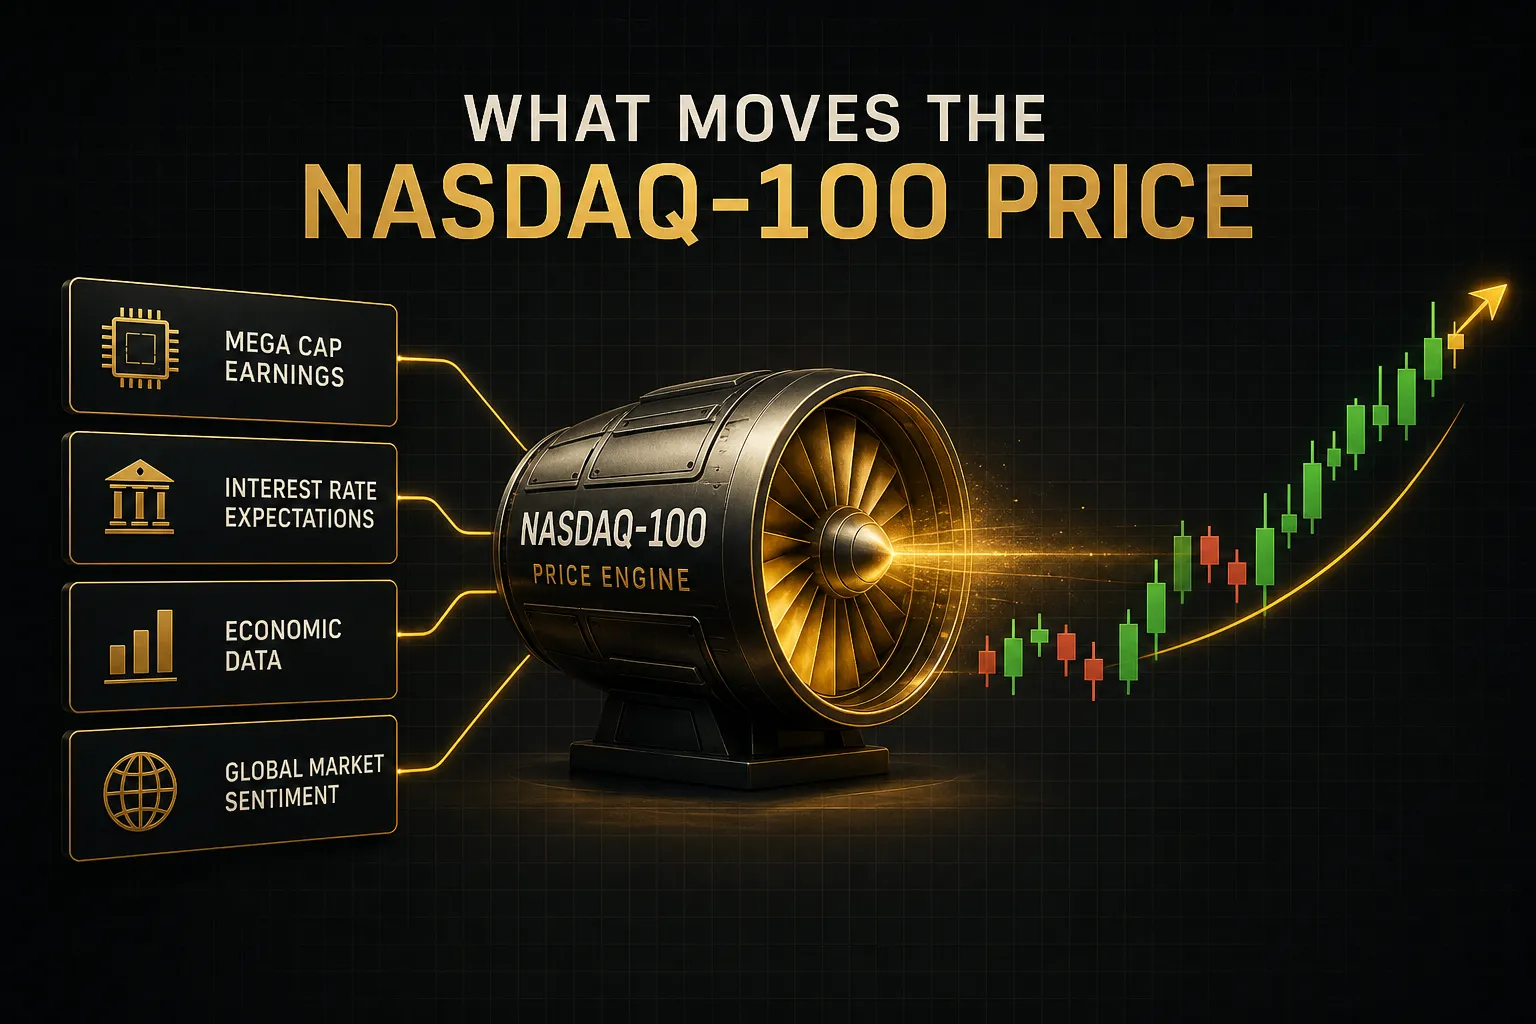
Ask ten traders what drives this index and you’ll get ten answers. Ask what drove it on any specific down day and the answers converge fast, because the same four forces do most of the work.
Understanding these isn’t academic.
It tells you which economic releases to have on your calendar and which headlines to ignore.
- Interest rates and Treasury yields. Growth companies derive most of their valuation from earnings expected years out. When the 10-year Treasury yield rises, those future cash flows get discounted more heavily, and multiples compress. This interest-rate sensitivity is why the Nasdaq-100 often falls harder than value-heavy indices on hot inflation prints or hawkish Fed commentary. Watch CPI releases, FOMC decisions, and the 10-year yield as a live input.
- Mega-cap earnings and guidance. With the top 10 names carrying roughly half the index weight, a handful of quarterly reports can move the whole benchmark more than the other 90 companies combined. A single mega-cap missing on guidance has produced 2%+ single-session index moves. Earnings season concentrates this risk into a two-week window each quarter, and the reaction is usually to forward guidance, not the reported quarter.
- AI capital spending and the semiconductor cycle. Since 2023, capex commitments from hyperscalers and the demand outlook for advanced chips have functioned as a distinct driver, one that barely registers in the broader Composite. Semiconductor earnings and data-centre spending announcements now move the index in ways that have no clean historical parallel. When AI enthusiasm cools, the concentration works in reverse.
- Risk sentiment, the dollar, and gap risk. A stronger dollar pressures the substantial overseas revenue base of large multinationals in the index. Broad risk-off events, geopolitical shocks, credit stress, liquidity scares, hit high-beta growth first. And because futures trade nearly around the clock while stocks don’t, overnight news produces gap openings. The cash index can open several percent away from the prior close, with no opportunity to exit in between.
Reading the Nasdaq-100 Chart Like a Trader
Most losing trades don’t fail at the exit.
They fail at the decision to enter, made without a defined bias, without a level, and without knowing what would prove the idea wrong.
What follows is a repeatable workflow. It won’t make you profitable on its own, but it will stop you taking trades that had no business being taken.
A Multi-Timeframe Workflow
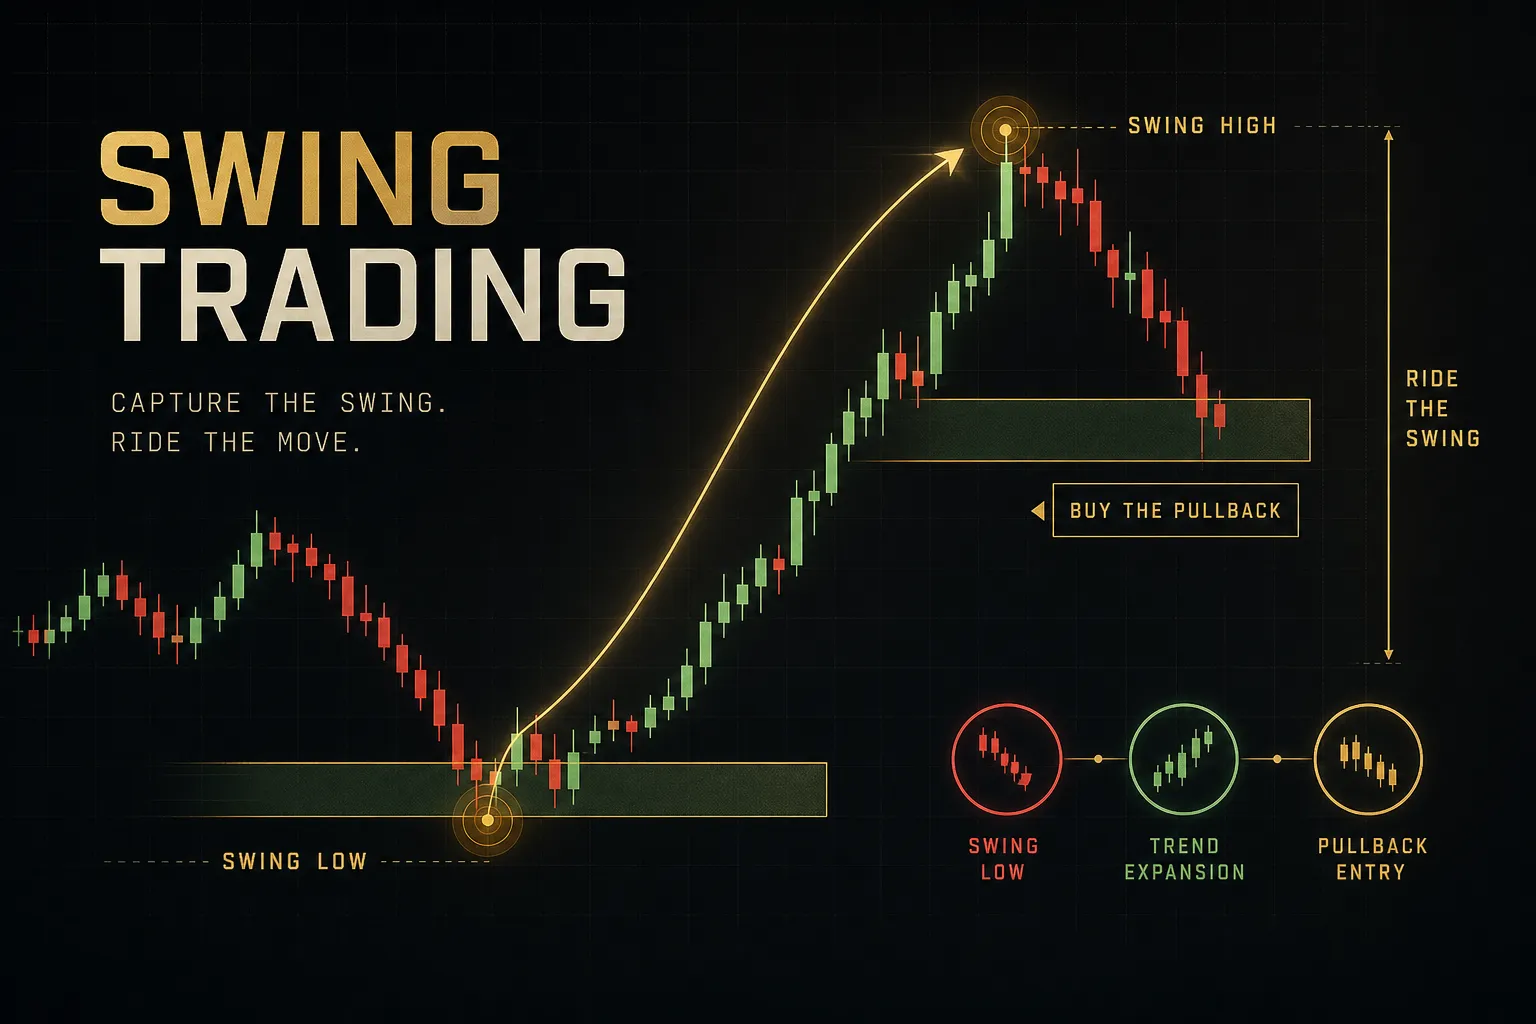
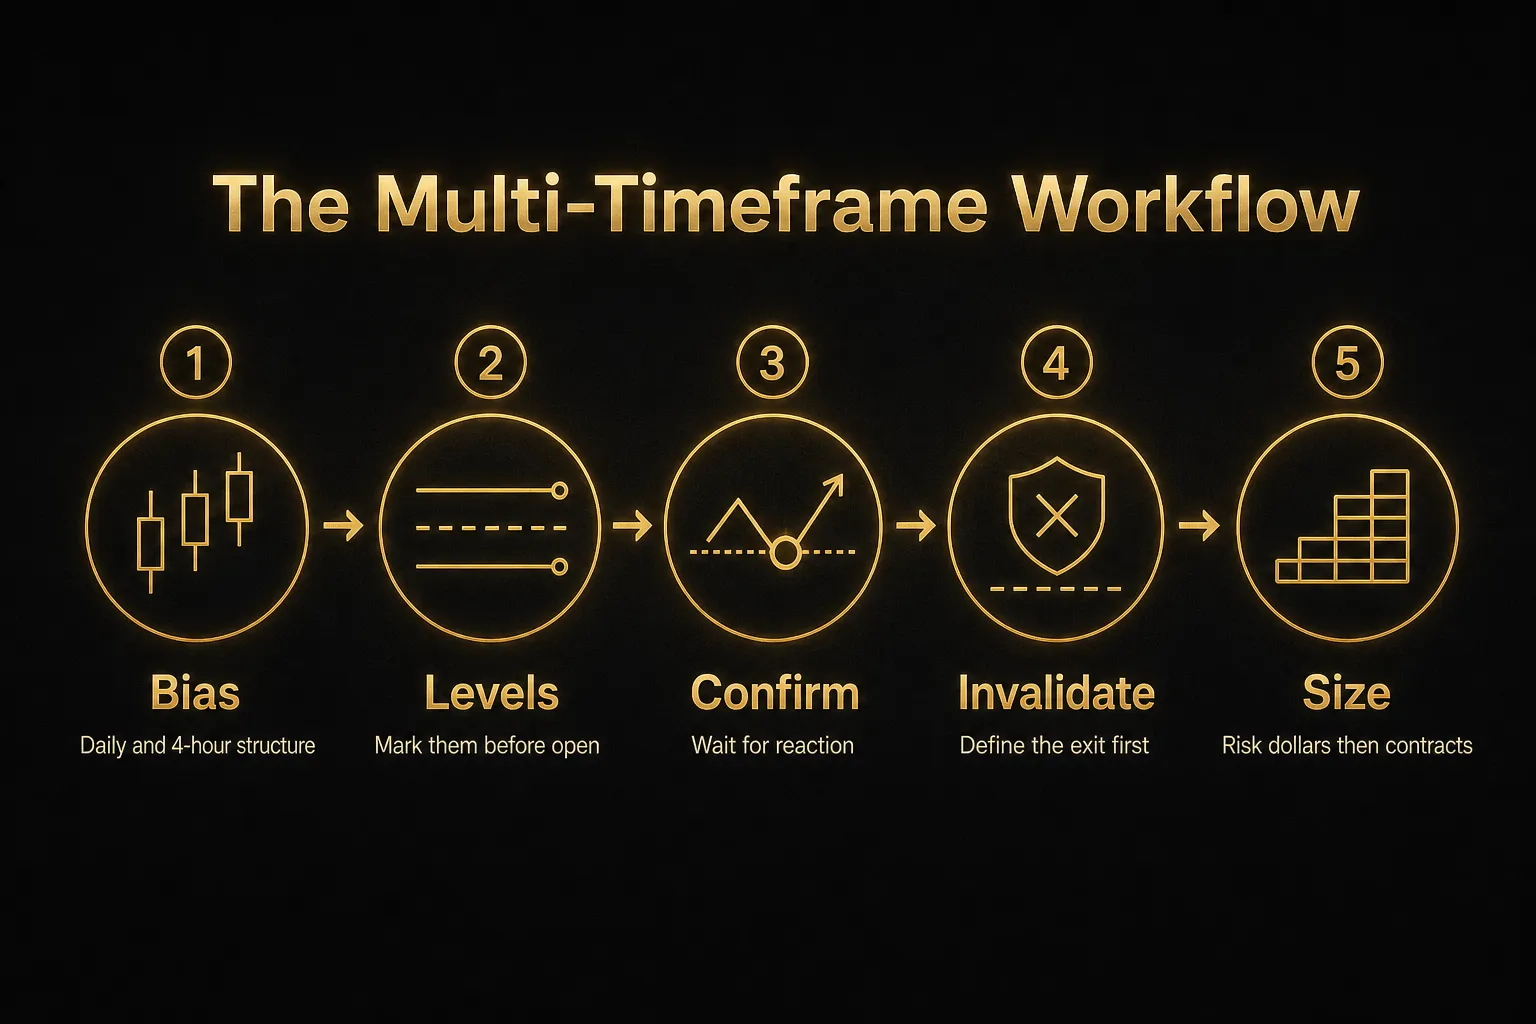
- Establish directional bias on the higher timeframe. Start with the daily and 4-hour charts before you look at anything shorter. You’re answering one question: is price making higher highs and higher lows, lower highs and lower lows, or neither? That’s market structure, and it frames every decision below it.
- Mark your key levels before the session opens. Prior day high and low, prior week high and low, overnight session extremes, and any obvious support and resistance shelf where price reversed more than once. Do this when markets are quiet. Levels drawn mid-move are levels drawn with a bias.
- Drop to the execution timeframe and wait. A 5-minute or 15-minute chart shows you how price behaves when it reaches your level. You are not looking for a reason to enter. You’re waiting for the market to show you rejection, absorption, or a clean break with volume confirmation.
- Define invalidation before entry. Pick the exact price where your idea is wrong, and it should be a structural point, below the swing low that formed the setup, not an arbitrary round number of points. If you can’t articulate invalidation in one sentence, you don’t have a trade.
- Calculate reward-to-risk against a realistic target. Measure distance from entry to invalidation, then to the next meaningful level in your favour. If that ratio is under 1.5 to 1, skip it. The next setup is 20 minutes away.
- Size the position from the risk, not the account. Decide your maximum acceptable loss in dollars first, then divide by the stop distance in points, then divide by the tick value to get contracts. In MNQ at $2 per point, a 40-point stop with $200 of risk gives you 2.5 contracts, so you round down to 2.
- Log the trade and review the process, not the outcome. A winning trade taken without a plan is worse than a losing trade taken with one. Track whether you followed steps 1 through 6, and the P&L takes care of itself over a large enough sample.
Where Indicators Fall Short
Every trend-following indicator is a function of past price.
That’s not a criticism, it’s the definition.
But it has consequences on an instrument that gaps as often as Nasdaq-100 futures do.
An exponential moving average crossover signals after the move is underway.
On a strongly trending day that’s fine.
On a choppy range day it will whipsaw you repeatedly, generating a signal, reversing, generating the opposite signal.
The relative strength index has a different failure mode.
It reads “overbought” above 70 and traders sell into strength, which is exactly the wrong instinct during a sustained trend where RSI can pin above 70 for days.
Overbought means strong, not expensive.
Gap opens break indicator logic outright.
When NQ opens 300 points below the prior close, moving averages and oscillators are computing from a data series that no longer reflects the current regime.
Give them a few bars to reset before trusting them.
Indicators should confirm what structure already told you. When an indicator disagrees with clear price structure, the structure usually wins.
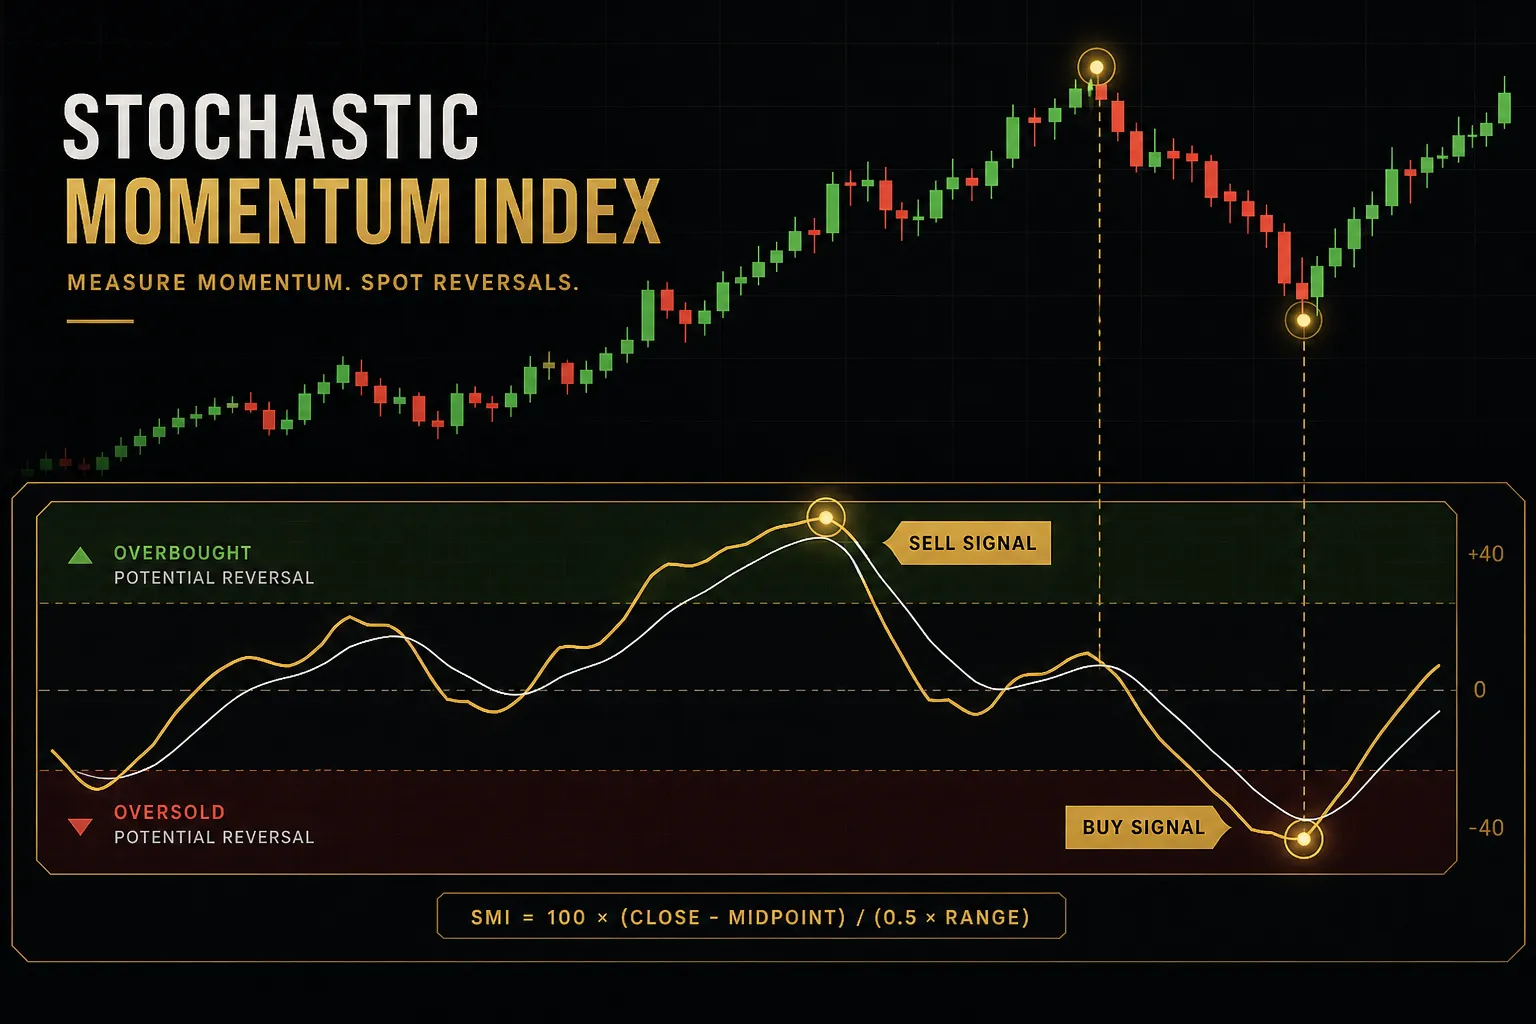
Tools like PipTrend exist to make this confirmation step faster rather than replace it. Its colour-coded trend candles give an immediate read on directional bias for NAS100, session high and low levels plus VWAP mark the reference points where reactions tend to happen, and a 12-timeframe confluence table shows at a glance whether short and long timeframes agree.
Used properly, that’s step one and step two of the workflow compressed into a glance.
Used improperly, it’s a colour telling you to buy.
The difference is whether you still define invalidation and reward-to-risk yourself.
Managing Leverage and Volatility
Leverage on index futures is easy to underestimate because the margin number looks small.
One NQ contract at an index level of 20,000 carries a notional value of $400,000.
Overnight margin might be $20,000 to $30,000 depending on the broker.
That’s roughly 15 to 20 times leverage.
A 2% adverse move against a single NQ contract is $8,000, which can exceed a third of the posted margin.
Notional value is the number that determines your risk, not margin.
Margin is a deposit requirement.
Maximum acceptable loss is a decision you make.
Confusing the two is how accounts get wiped out on a single overnight headline.
Volatility regime should change your sizing, not just your timing.
use average true range on the daily chart as a calibration tool: if daily ATR expands from 250 points to 500, the same stop distance in points is now half as protective.
Widen the stop and cut the contract count to hold dollar risk constant.
Implied volatility from index options, the VXN, gives you a forward-looking version of the same signal. Elevated readings before a Fed decision or a mega-cap earnings report tell you the market expects a larger move, which is a reason to size down rather than up.
Then there’s gap risk, the thing leveraged products punish hardest.
Stop-loss orders don’t execute at your price when the market opens 300 points past it, they execute at the next available price.
If you hold leveraged Nasdaq-100 exposure overnight, size the position so a 3% gap against you is survivable… because eventually one will come.
Frequently Asked Questions
What is the Nasdaq-100 in simple terms?
The Nasdaq-100 is a stock market index tracking the 100 largest non-financial companies listed on the Nasdaq exchange. It uses modified market capitalisation weighting, so bigger companies have more influence on the index value, subject to caps that prevent excessive concentration.
Think of it as a scoreboard for America’s largest growth companies. It excludes banks and insurers by rule, and it is rebalanced quarterly with membership reviewed annually each December.
What are the top 100 companies on Nasdaq?
The constituent list changes every year, so any list printed here would go stale. As of 2026 the largest weights consistently include Apple, Microsoft, Nvidia, Amazon, Alphabet (both GOOGL and GOOG share classes), Meta, Broadcom, Tesla, Netflix, and Costco.
Below the top 10 you’ll find names across healthcare (Amgen, Gilead, Regeneron), consumer staples (PepsiCo, Mondelez), and industrials. For the current official list, check Nasdaq’s index page or the daily holdings file published by any tracking ETF, since those update after every reconstitution.
Is Nasdaq-100 a good investment?
The Nasdaq-100 has delivered strong long-term returns while carrying higher volatility and greater concentration risk than a broad market index.
Both halves of that sentence matter.
It fell over 30% in 2022 and roughly 78% peak-to-trough during the 2000 to 2002 dot-com collapse.
It also outperformed the S&P 500 across most rolling 10-year periods since 2010.
Whether it suits you depends on time horizon, tolerance for drawdowns, and whether your other holdings already overlap heavily with the same mega-caps.
What is the difference between Nasdaq and Nasdaq-100?
“Nasdaq” usually refers to either the exchange itself or the Nasdaq Composite index of roughly 3,000 listed stocks. The Nasdaq-100 is a separate, narrower index of just 100 non-financial companies.
The Composite includes financial companies and thousands of small-caps.
The Nasdaq-100 excludes financials and holds only the largest names.
They move together most days but diverge when market breadth is poor, since the Composite feels small-cap weakness the Nasdaq-100 never registers.
How do I buy the Nasdaq-100?
You cannot buy the index directly, so exposure comes through an ETF, a futures contract, or index options. For most long-term investors, an ETF like QQQ (or the lower-cost QQQM, which tracks the same index at a reduced expense ratio) is the straightforward route through any standard brokerage account.
Active traders typically use NQ or MNQ futures, which require a futures-enabled account and margin. Options on NDX are cash-settled and carry a $100 multiplier, making them capital-intensive relative to QQQ options.
What moves the Nasdaq-100 the most?
Interest rate expectations and mega-cap earnings are the two dominant drivers. Because the index is weighted toward long-duration growth companies, rising Treasury yields compress valuations quickly, and because the top 10 names hold roughly half the weight, their quarterly results can move the entire benchmark.
Secondary drivers include AI-related capital spending announcements, semiconductor demand data, dollar strength, and broad risk sentiment. On any given week, the CPI release and the FOMC calendar deserve as much attention as any chart pattern.
The Bottom Line on Trading the Nasdaq-100
The right instrument depends entirely on what you’re trying to do. Long-term investors accumulating over decades are best served by QQQ or an equivalent low-cost fund in a tax-advantaged account, where the 0.20% expense ratio and minor tracking error are rounding errors against compounding.
Active traders working intraday or over a few days want NQ or MNQ futures for the near-24-hour access and precise sizing, paired with rules they actually follow. Beginners should study how the index behaves for a few weeks before committing capital, because the concentration and gap behaviour surprise people who learned on slower markets.
One concrete step before your next session: pull the current Nasdaq-100 constituent weights from Nasdaq’s official page, then confirm which contract or ETF matches the exposure you actually want and the loss you can actually absorb.
Five minutes of verification beats a month of assumptions.
And remember what indicators are for.
Colour-coded trend tools, moving averages, confluence tables, they organise information.
They do not manage risk.
Defined invalidation and disciplined position sizing do that, and nothing else can.
Sources
Risk Disclaimer: Trading involves risk. Past performance doesn't guarantee future results. Only trade with money you can afford to lose. PipTrend is a tool to assist your trading decisions, not financial advice.