The Moving Average Indicator: A Trader's Complete Guide
On this page
The Line Every Chart Seems to Need
Open any trading platform, any market, any timeframe. Chances are a moving average is already sitting on the chart by default.
The moving average indicator is the most widely deployed technical tool across stocks, forex, crypto, and futures. Institutional desks reference it. Retail traders draw it. Algorithms trade off it.
And almost everyone misreads what it’s actually telling them.
Here’s the problem. Traders treat the line as a signal generator, something that predicts the next move.
It doesn’t.
A moving average is a lagging indicator, built entirely from prices that already printed. It describes where price has been, averaged over a window you chose arbitrarily.
That’s not a weakness.
It’s the point.
Context has value, and averaging out noise is genuinely useful when markets trend.
But the moment you ask the line to forecast, you’re using a rearview mirror as a windshield.
This guide covers the mechanics: how simple and exponential moving averages are calculated, what the smoothing multiplier actually does, how to pick a period that matches your holding time, what crossovers really confirm, and the specific market conditions where the entire approach falls apart.
A moving average is a lagging context tool, not a standalone prediction system. Everything else in this guide follows from that.
What a Moving Average Actually Measures
Strip away the branding and a moving average is arithmetic anyone can do on a napkin. Understanding that arithmetic is what separates traders who use the line intelligently from traders who just watch it change color.
The SMA Formula in Plain Terms
A simple moving average adds up the closing prices over a defined number of periods and divides by that number.
That’s it.
Take five consecutive daily closes on a stock: 100, 102, 101, 105, and 107. Sum them and you get 515. Divide by 5 and the 5-day SMA is 103.
Tomorrow, a new close of 110 arrives and the oldest value (100) drops out of the window. The new sum is 525, so the average moves to 105. The line “moves” because the window slides forward one candle at a time, discarding the oldest data point.
Notice what happened there.
The average jumped two full points not just because a high price entered, but because a low price exited.
Old data leaving the window can move a simple moving average as much as new data entering it.
That’s a quirk most traders never think about, and it explains sudden SMA shifts that seem disconnected from current price action.
SMA vs EMA: The Real Tradeoff
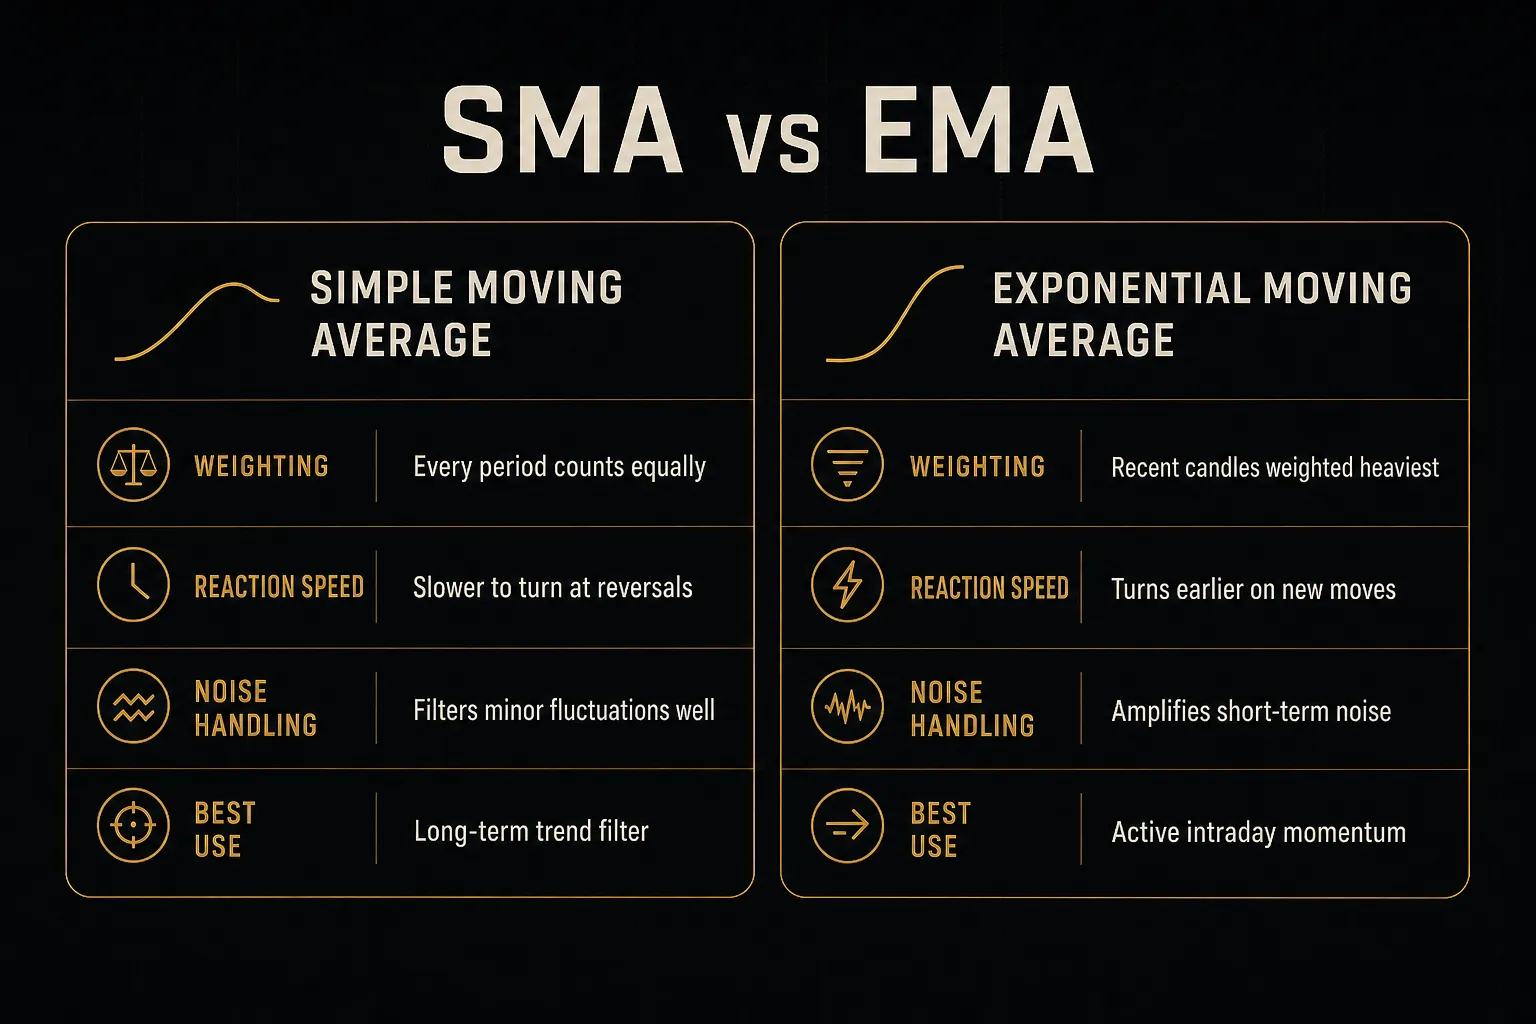
The exponential moving average solves a specific complaint: in an SMA, a price from 50 days ago carries exactly the same weight as yesterday’s close. For a trader trying to read current conditions, that feels wrong.
The EMA fixes it with a smoothing multiplier calculated as 2 / (n + 1), where n is the period. For a 20-period EMA, that’s 2/21, or roughly 0.0952. Each new value is computed as: (current close × multiplier) + (previous EMA × (1 − multiplier)).
So the most recent candle contributes about 9.5% of a 20 EMA’s value, and everything before it contributes the rest on a decaying scale. Older data never fully disappears, it just fades toward irrelevance.
The practical consequence is a genuine tradeoff, not an upgrade.
The EMA turns earlier at reversals, which means faster signals in real trends and more false signals in chop. The SMA lags further behind but filters minor fluctuations more effectively, so it whipsaws less.
There are variants worth knowing. A weighted moving average applies linearly declining weights rather than exponential decay. A volume weighted moving average gives more influence to candles that traded heavy size, which matters on equities and futures where volume data is reliable.
The Hull moving average uses nested weighted averages to cut lag aggressively, at the cost of occasionally hooking the wrong way.
None of these is objectively superior.
They’re different filters on the same underlying data.
Why the Price Source Changes the Line
Almost every trader runs moving averages on closing price without ever considering the alternative. That default is reasonable, but it isn’t neutral.
Closing price is the most meaningful single data point on a candle because it reflects where participants were willing to hold risk into the next period. But it ignores everything that happened in between.
Alternative sources reshape the line in measurable ways:
- HL2 (high + low / 2) centers the average on the candle’s range midpoint, producing a smoother line that ignores where the candle settled. Useful on instruments with erratic closes.
- HLC3 (typical price) blends the range with the close, giving a balanced read that’s popular in volume-weighted calculations and pivot-based systems.
- OHLC4 averages all four points, creating the smoothest of the common inputs. It reacts slowest, which suits longer-horizon trend filters.
- Open price is rarely used alone but appears in gap-sensitive strategies where the overnight jump matters more than the settle.
On calm daily charts the difference between these is small, often under half a percent. On volatile instruments with long wicks, crypto especially, the gap widens enough to change whether a crossover triggers at all.
Pick one source, document it, and stop switching.
Choosing a Period That Fits the Trade
Ask ten traders which period to use and you’ll get ten confident answers. Most of them are inherited from someone else’s chart without a single test.
What 20, 50, 100, and 200 Actually Signal
The popular periods aren’t magic numbers. They became meaningful largely because enough capital watches them that they generate self-reinforcing reactions.
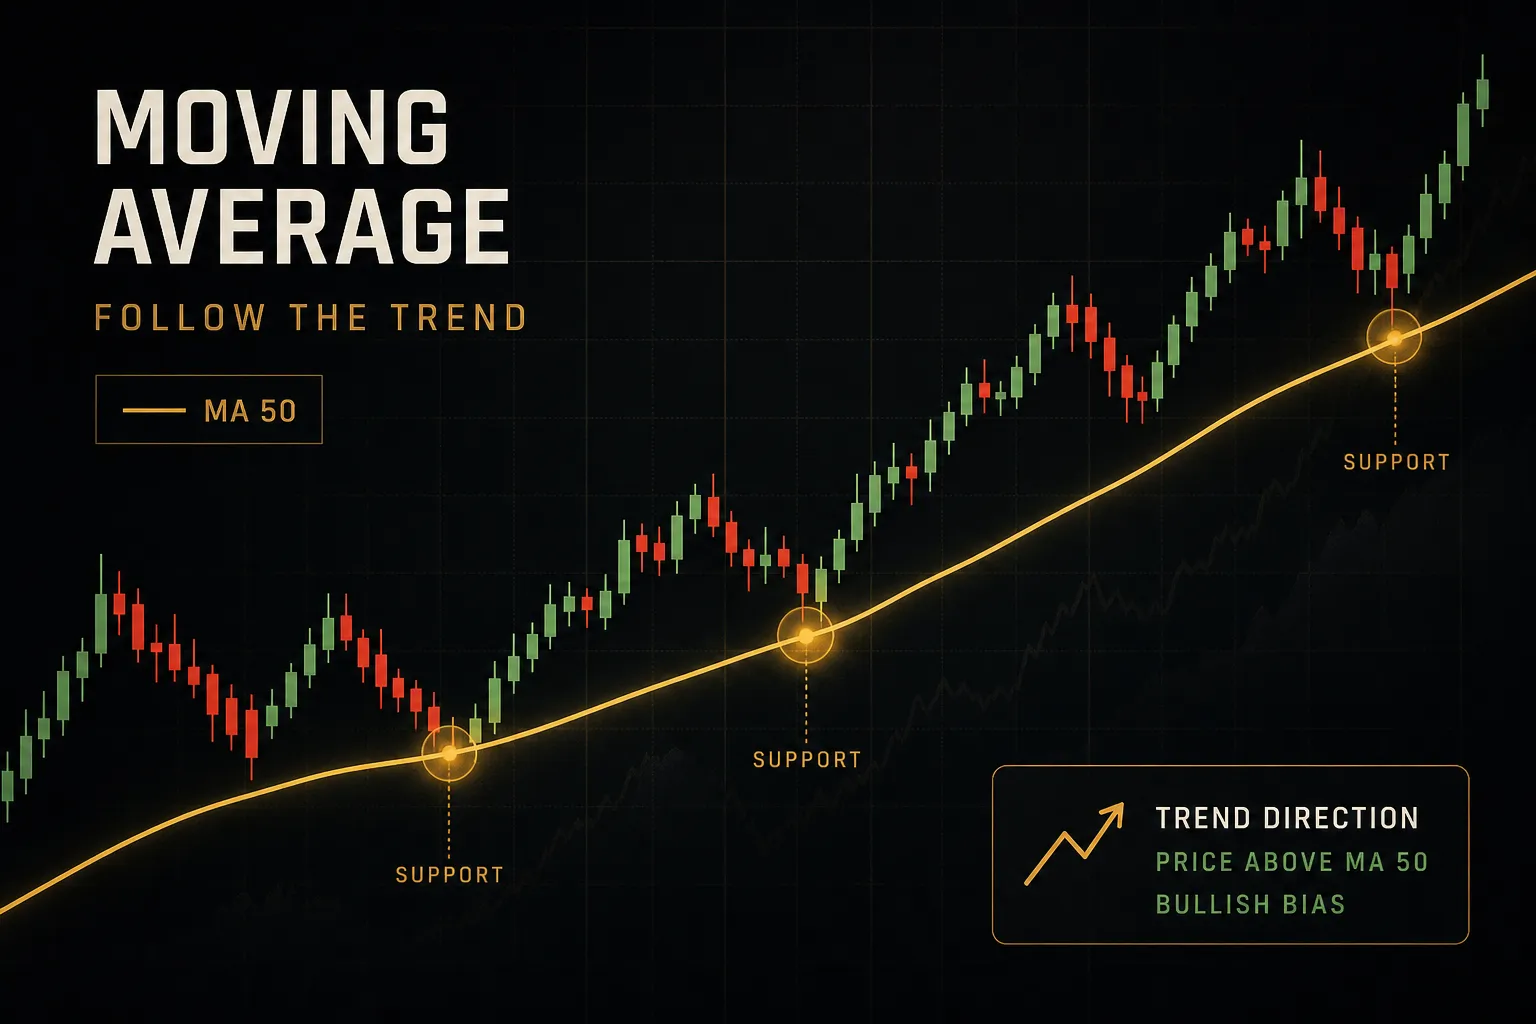
The 20-period average tracks short-term momentum. On a daily chart it roughly covers a trading month, and price holding above it usually indicates an intact near-term uptrend.
It’s noisy by design.
The 50-period is the intermediate reference most institutional research desks cite. Pullbacks to the 50-day in a strong uptrend are among the most commonly traded setups in equities, precisely because so many participants are watching the same level.
The 100-period sits in a transition zone. It’s watched less consistently than its neighbors but often catches moves that slice through the 50 and stall before the 200.
The 200-period is the long-term trend line. Pension funds, asset allocators, and risk models reference the 200-day as a bull/bear demarcation.
When a major index closes below it, financial media notices, and that attention itself creates flow.
Matching Period to Timeframe and Volatility
There is no universal best period. The correct setting scales with two things: how long you intend to hold, and how volatile the instrument is.
Consider two traders. One runs a 9 EMA on a 5-minute EUR/USD chart, looking for scalps lasting fifteen minutes. Nine bars covers 45 minutes of price action, which is roughly the horizon of the trade.
That’s coherent.
The other runs a 200 SMA on a daily gold chart, holding positions for months. Two hundred daily bars covers nearly a calendar year.
Also coherent.
Now swap them.
The 200 SMA on a 5-minute chart barely moves during a scalping session, offering no actionable information. The 9 EMA on a daily chart flips direction constantly, generating dozens of unusable signals per quarter.
A workable rule of thumb: your moving average window should cover roughly one to three times your average holding period. A swing trader holding five days doesn’t need a 200-day filter as a trigger, though it still works as a trend filter for direction.
Volatility matters just as much.
A low-volatility currency pair tolerates shorter periods because its noise amplitude is small. A small-cap biotech that swings 8% daily will chop a 9 EMA to pieces, and needs a longer window to produce anything stable.
Reading Slope and Separation, Not Just Position
Most traders check one thing: is price above or below the line?
That’s the least informative question you can ask.
Slope carries earlier information.
When a rising 50-period average begins to flatten, momentum is fading even though price may still sit comfortably above it. That flattening often precedes a crossover by several bars, sometimes weeks on a daily chart.
Separation between two averages tells you about trend strength.
When a fast and slow line widen apart, the trend is accelerating and pullbacks tend to be shallow. When they converge and start braiding together, you’re entering the conditions that produce whipsaw after whipsaw.
Converging moving averages are the market’s warning that a crossover strategy is about to stop working. Compression precedes chop far more reliably than it precedes breakouts.
Watch the angle.
A moving average rising at 45 degrees describes a completely different market than the same average rising at 5 degrees, even though both are technically “trending up.”
Trends, Crossovers, and Support Zones
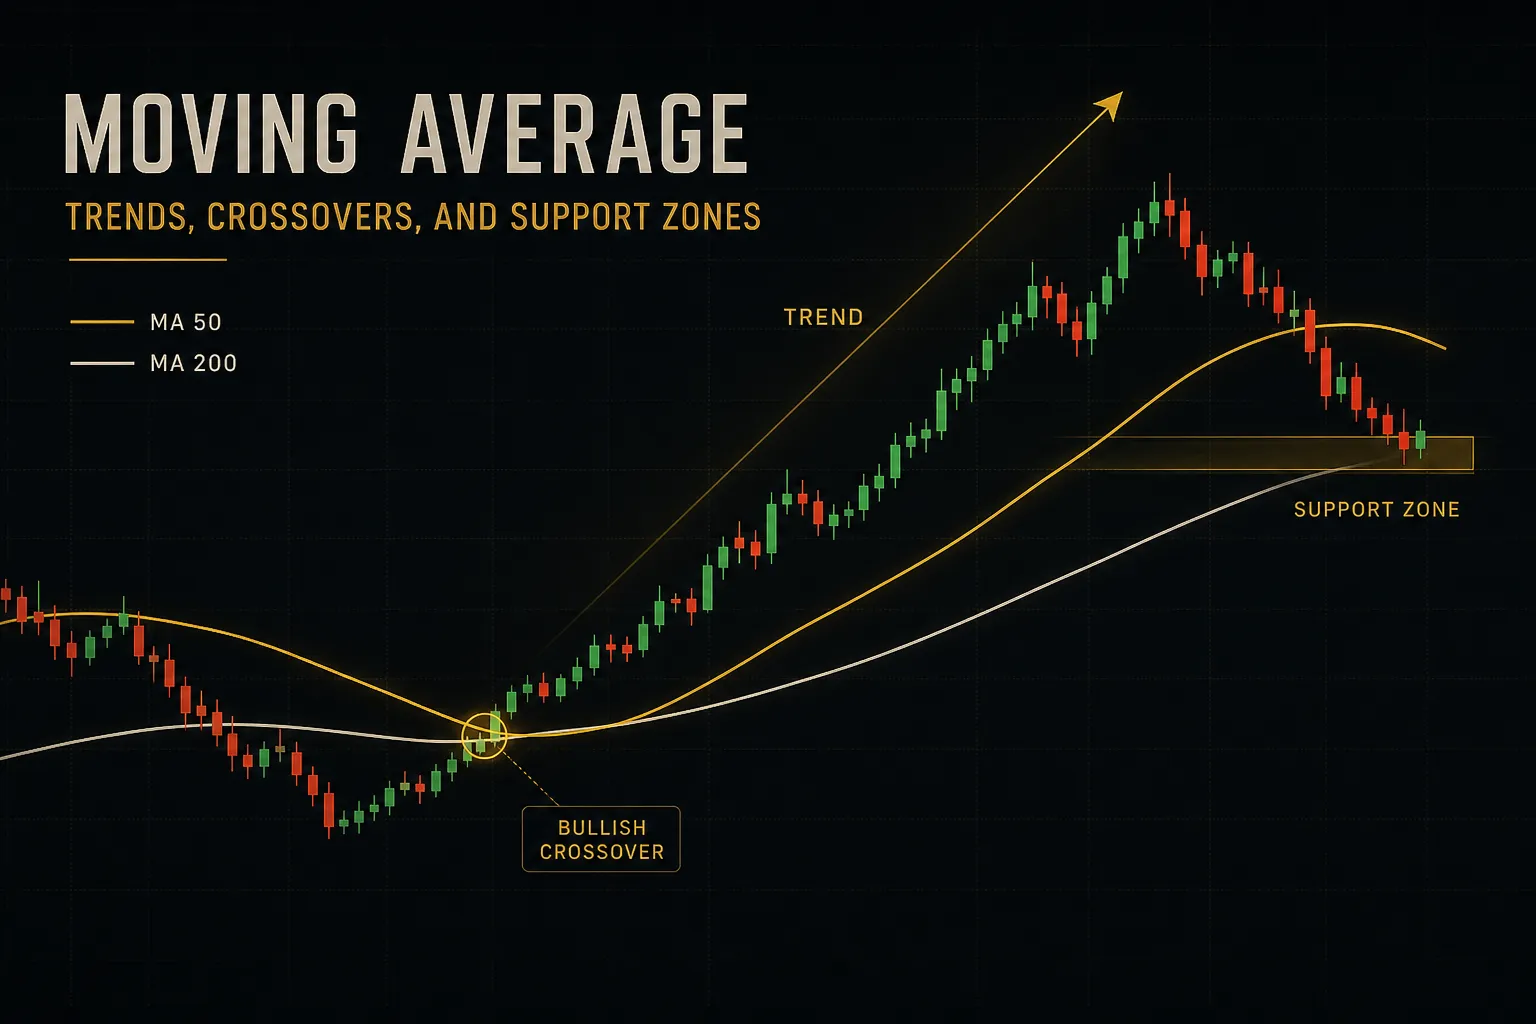
The moving average crossover is the most traded signal in technical analysis. It’s also the most misunderstood, largely because traders confuse confirmation with prediction.
Price Crossing the Line vs Two Lines Crossing
These are fundamentally different signals with different error profiles.
When price crosses a single moving average, you get an early signal. Price is the fastest-moving element on the chart, so it crosses first.
The cost is noise: in a ranging market, price may cross a 20 EMA fifteen times in a month, and thirteen of those crossings lead nowhere.
When two moving averages cross each other, both lines must first absorb enough new data to shift direction.
That takes time.
A 50/200 crossover on a daily chart may lag the actual turning point by twenty to forty bars.
The tradeoff is straightforward.
Single-line crossings give you more signals, earlier, with a lower hit rate. Dual-line crossings give you fewer signals, later, with fewer false triggers.
Neither is better in isolation.
Your choice depends on whether your strategy can survive frequent small losses in exchange for catching moves early.
Golden Crosses, Death Crosses, and Their Lag
A golden cross occurs when a shorter average (typically the 50-day) crosses above a longer one (typically the 200-day). A death cross is the inverse.
Financial media treats these as major events.
Structurally, they’re confirmations of moves that already happened.
Think about the mechanics.
For a 50-day average to climb above a 200-day average, price must have already rallied enough, for long enough, to drag both lines. By the time the intersection prints, the underlying move is typically well established and sometimes near exhaustion.
Historical behavior bears this out unevenly.
In sustained bull markets, golden crosses have marked genuinely useful trend confirmations. In choppy, range-bound conditions, they’ve frequently formed near short-term tops, right as the rally that created them ran out of buyers.
That’s not indicator failure.
It’s a direct consequence of lag. A signal built from two slow averages will always arrive after the fact, and in a market that reverses quickly, “after the fact” means “too late.”
Support, Resistance, and the Myth of the Exact Line
Traders draw a 200-day moving average and treat it like concrete. Price hits it, price bounces, theory confirmed.
Except price doesn’t bounce off the line. It reacts within a zone around it.
A moving average provides dynamic support and resistance, and the word that matters there is dynamic.
The value changes every bar.
During volatile sessions, price routinely pierces the average by 1-3% before reversing, and on high-beta instruments the overshoot can be far larger.
Treating the line as an exact level produces two predictable errors.
You place stops just beyond it and get swept by normal noise. Or you skip valid setups because price “broke” a level it never respected precisely in the first place.
The practical fix is to think in bands.
Draw a zone extending roughly half an ATR above and below the average, and evaluate reactions within that envelope. Combine it with actual market structure, prior swing highs, consolidation ranges, volume shelves, and the moving average becomes a confluence factor rather than a standalone level.
Where Moving Averages Break Down
Every trend-following indicator shares one weakness: it requires a trend. Moving averages are no exception, and the failure mode is expensive.
Why Ranging Markets Cause Whipsaws
Markets trend roughly 30% of the time. The rest is consolidation, rotation, and directionless drift.
In those conditions, a moving average sits in the middle of the range while price oscillates around it.
Every oscillation triggers a crossover. Every crossover triggers an entry. Every entry reverses before it profits.
This is the whipsaw problem, and it compounds fast.
Ten consecutive small losses plus commissions and spread can erase the profit from a single good trend trade. Systems that look brilliant in backtests over trending years get destroyed in sideways ones.
The defense is checking the volatility regime before trusting any signal. Two quick filters work well:
- ATR compression: if current Average True Range is materially below its own 20-period average, the market is coiling and directional signals lose reliability.
- Range width: if the last 20 bars are contained within a range narrower than typical, you’re in consolidation regardless of what a crossover suggests.
- MA separation: when your fast and slow averages sit within a fraction of an ATR of each other, expect crossovers to fail.
- ADX or similar: readings below 20 on most instruments indicate insufficient directional strength for trend-following logic.
A Confirmation Checklist Beyond the Line
A crossover alone is not a trade.
It’s one input.
Layer independent confirmation before acting:
- Candle close confirmation: wait for the bar to close beyond the average rather than reacting intrabar. Intrabar crossings reverse constantly and are the single largest source of avoidable false signals.
- Volume: a breakout above a key average on below-average volume lacks participation. Institutional moves leave volume footprints.
- Momentum divergence: if RSI or MACD histogram is weakening while price pushes through the average, the move lacks fuel.
- Higher-timeframe alignment: a bullish crossover on a 15-minute chart inside a daily downtrend is a countertrend trade whether you intended it or not.
- Structural context: is price crossing the average at a prior resistance shelf, or in open space? The former stalls more often.
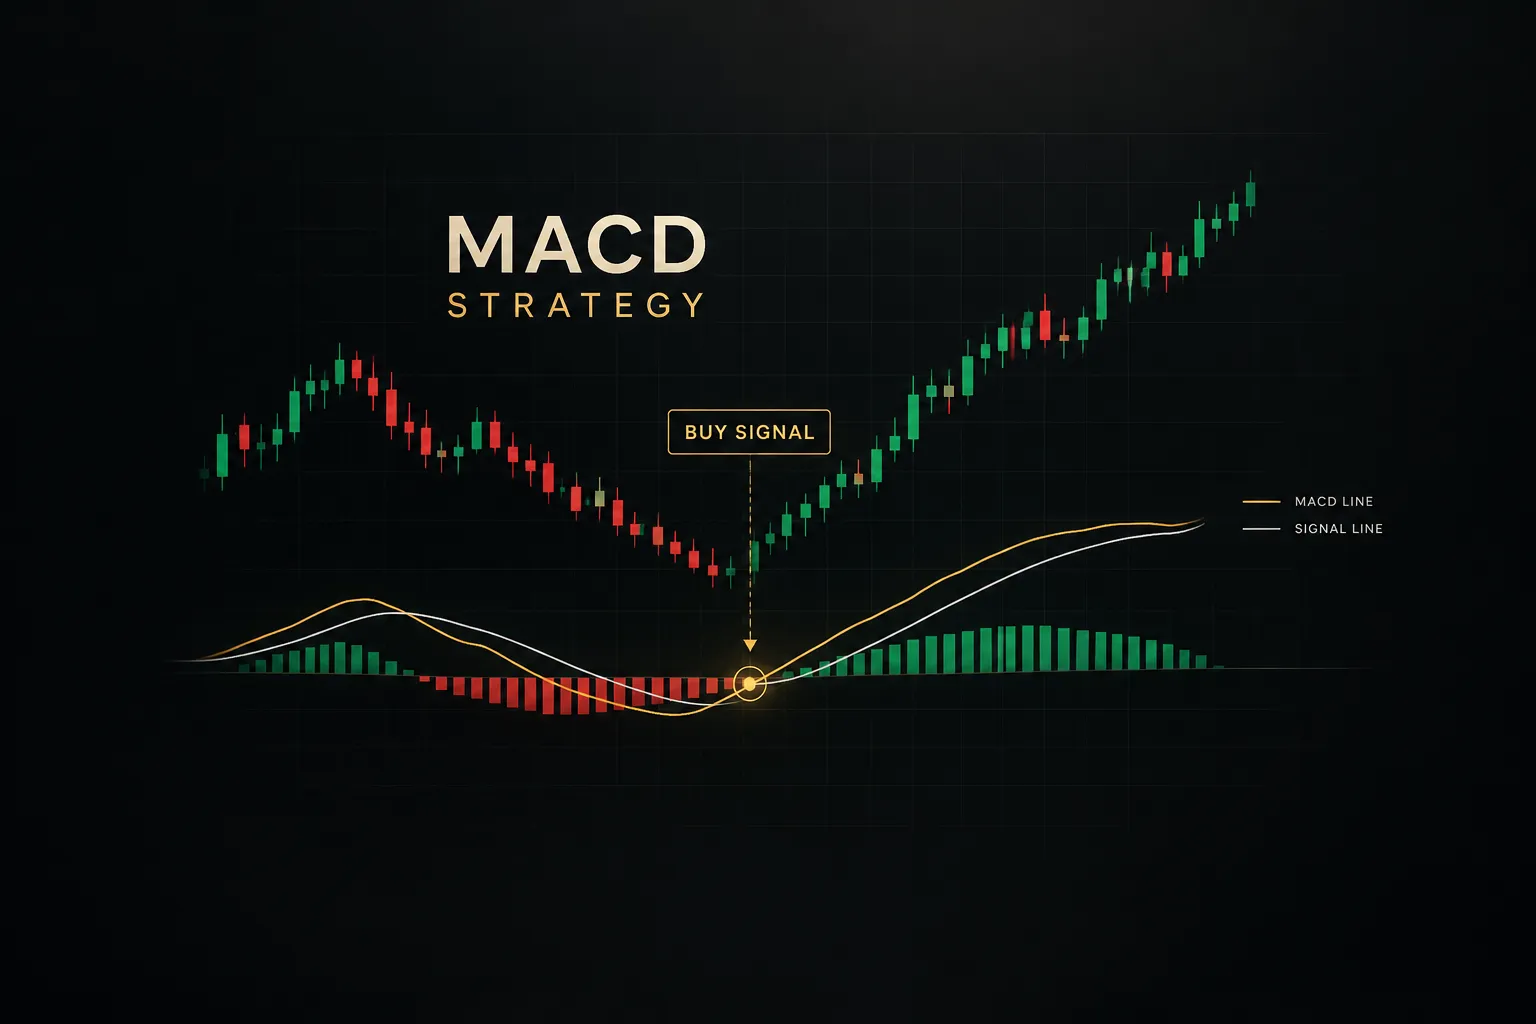
One caution about stacking indicators. MACD and Bollinger Bands are both built from moving averages, yet they add genuinely independent information: MACD measures the rate of convergence between two averages (momentum), and Bollinger Bands measure standard deviation around one (volatility).
Adding a 21 EMA to your 20 EMA adds nothing.
Two nearly identical lines agreeing with each other is not confirmation. It’s the same information counted twice, dressed up as consensus.
Turning a Visual Cue Into a Rules-Based Process
The gap between “I see a crossover” and “I have a trade” is where most accounts leak money.
A usable process separates two distinct jobs: identifying direction, and timing entry. Conflating them is why traders enter the moment a line crosses and then watch price retrace 40 pips against them before it works.
PipTrend is built around exactly that separation.
Its signal engine outputs direction only, no entry instruction attached. Precision entry levels then mark where action is actually justified, and a 12-timeframe confirmation table checks whether the shorter and longer horizons agree before anything is committed.
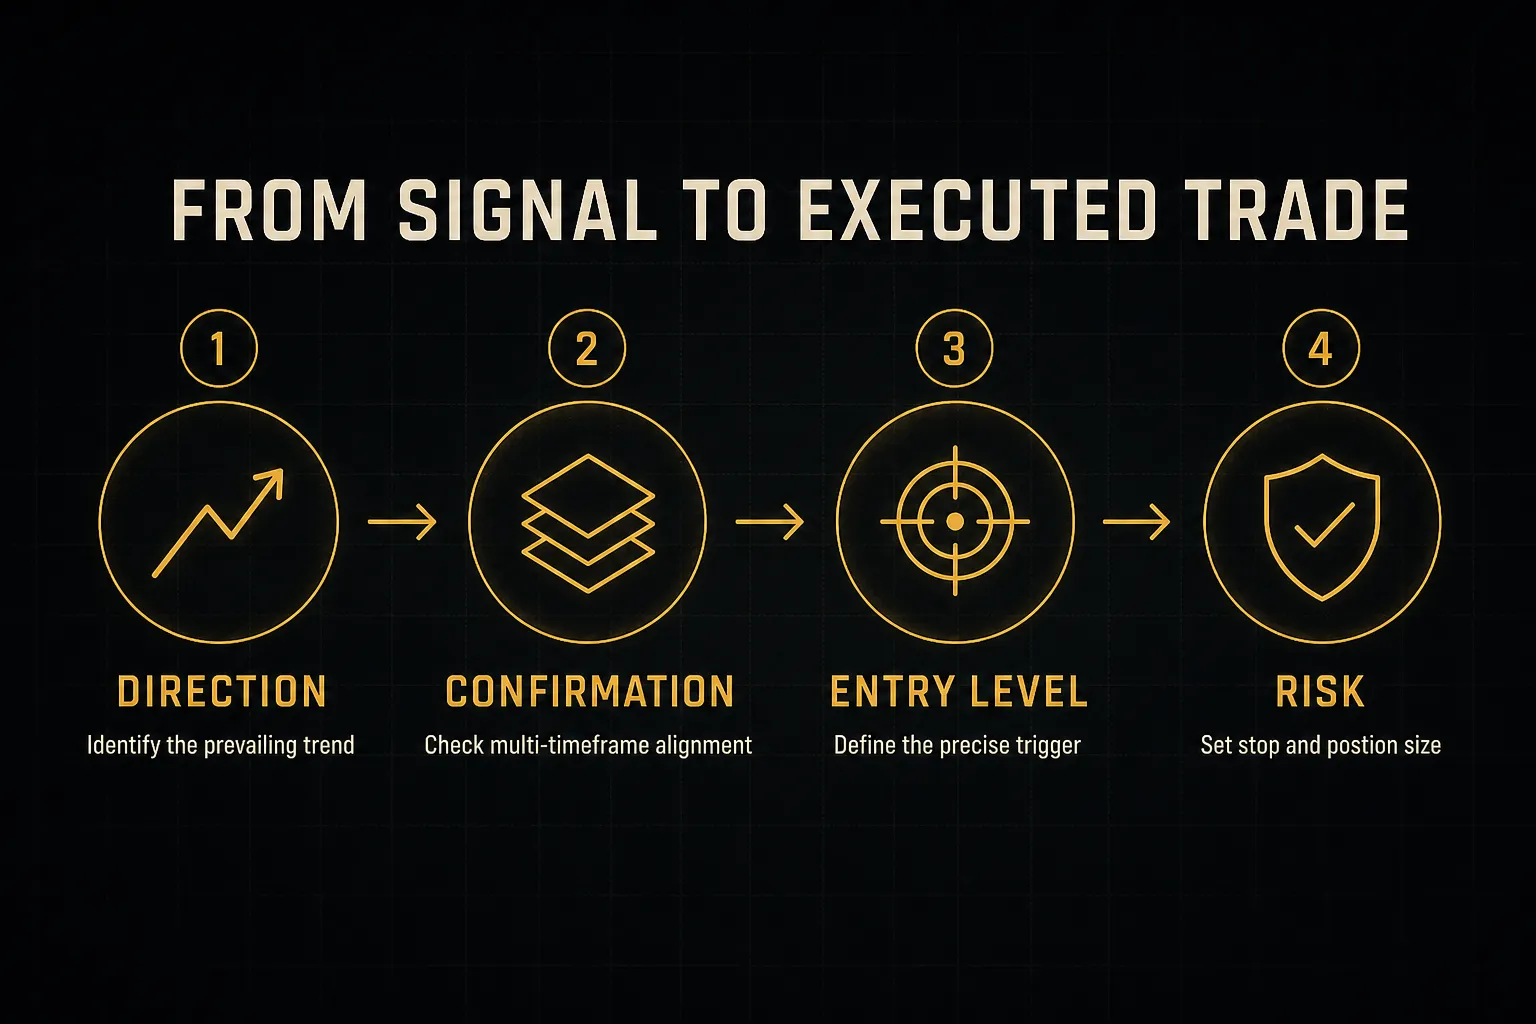
That structure forces a question most crossover systems skip: does the rest of the market agree with this one line?
Beyond the entry, four rules need to exist in writing before you trade:
- Entry trigger: the exact condition, including which price source, which timeframe, and whether close confirmation is required.
- Stop-loss placement: defined by structure or ATR multiple, never by the moving average value itself since it moves every bar.
- Exit logic: whether you trail, target a fixed multiple, or exit on an opposing crossover. Decide before entry.
- Position sizing: a fixed fraction of account risk per trade, calculated from the stop distance rather than a fixed lot size.
Then there’s backtesting, which deserves its own skepticism. Optimizing a crossover until the equity curve looks perfect is curve-fitting, and curve-fitted parameters fail forward with remarkable consistency.
Include realistic transaction costs and slippage in every test. A strategy generating 200 trades a year at 1.5 pips of combined cost needs to overcome 300 pips before it earns anything.
And test across regimes: a rule validated only on 2020-2021 trending data tells you nothing about how it handles a range-bound year.
Moving Average FAQs
What is a moving average indicator and how do you use it?
A moving average indicator calculates the average price of an asset over a set number of periods and plots it as a continuously updating line. It smooths short-term fluctuations so the underlying direction becomes visible.
Traders use it three ways: as a trend filter (only take longs above a rising average), as dynamic support and resistance during pullbacks, and as a crossover signal when price or a faster average crosses it. Because it’s built entirely from past prices, it confirms conditions rather than forecasting them.
Which moving average is best for day trading?
There is no single best setting, but shorter exponential moving averages between 8 and 21 periods are the most common choice on intraday timeframes. The EMA’s heavier weighting of recent candles suits the pace of day trading.
The right period depends on your chart timeframe and the instrument’s volatility. A 9 EMA works on a liquid 5-minute forex chart; the same setting on a volatile small-cap will produce constant false signals and needs a longer window.
Is EMA better than SMA?
Neither is better.
They solve different problems, and the choice is a tradeoff between speed and stability.
The EMA reacts faster to new price data, which helps in genuine trends but generates more false signals in choppy conditions. The SMA lags more but filters noise more effectively, making it the stronger choice for long-term trend filters like the 200-day.
Many traders use both: an EMA for timing, an SMA for context.
What is the most accurate moving average?
No moving average is universally most accurate, and any source claiming otherwise is selling something. Accuracy depends entirely on market regime.
In a strong directional trend, longer averages produce reliable signals with few false triggers. In a range-bound or low-ATR market, the same settings whipsaw repeatedly. Variants like the Hull moving average reduce lag, but reducing lag increases sensitivity to noise.
The tradeoff never disappears.
What do the 50-day and 200-day moving averages tell you?
The 50-day represents intermediate trend health and the 200-day represents long-term trend direction. Together they form the most widely watched pair in equity markets.
Price above both, with the 50 above the 200, describes an established uptrend. When the 50-day crosses above the 200-day it’s called a golden cross; the reverse is a death cross.
Both confirm moves that are already underway rather than predicting new ones.
Can moving averages predict stock prices?
No.
A moving average is a lagging indicator computed exclusively from prices that have already occurred, so it cannot forecast future values.
What it does provide is context: whether the recent trend is up, down, or flat, and how far current price has stretched from its own average. That context improves decision quality when combined with structure and confirmation, but it is descriptive, never predictive.
What is the best moving average crossover strategy?
No crossover setting works universally, though the 50/200 pair on daily charts and 9/21 EMA pair on intraday charts are the most commonly used starting points. Performance varies dramatically by regime.
What improves any crossover strategy is the filtering around it: requiring candle close confirmation, checking that ATR is expanding rather than compressing, verifying higher-timeframe agreement, and defining stops and position size before entry.
Why does price keep crossing the moving average?
Repeated crossing means the market is consolidating, not that the indicator is broken. When price ranges sideways, the average settles into the middle of that range and price naturally oscillates across it.
This is the classic whipsaw environment. The correct response is to stop taking crossover signals until directional strength returns, which you can measure through expanding ATR, widening separation between two averages, or a break of range structure.
The Line Is Context, Not a Crystal Ball
The decision rule is simple enough to keep in your head.
In a trending market with confirmation, moving average signals carry real information. In a ranging or low-ATR market, treat every crossover as suspect until volatility expands.
Before you act on any moving average signal, run three checks.
Has the candle actually closed beyond the line? What is the slope doing, rising, flattening, or rolling over? And does one independent input, volume, RSI, or the higher-timeframe trend, agree with what you’re seeing?
Three checks. Thirty seconds. They filter out a startling percentage of bad entries.
The perspective shift worth carrying forward is this: a moving average tells you where price has been, on average, over a window you selected.
Nothing more.
Its usefulness comes entirely from how you combine it with market structure and confirmation, not from the line itself.
Sources
Risk Disclaimer: Trading involves risk. Past performance doesn't guarantee future results. Only trade with money you can afford to lose. PipTrend is a tool to assist your trading decisions, not financial advice.