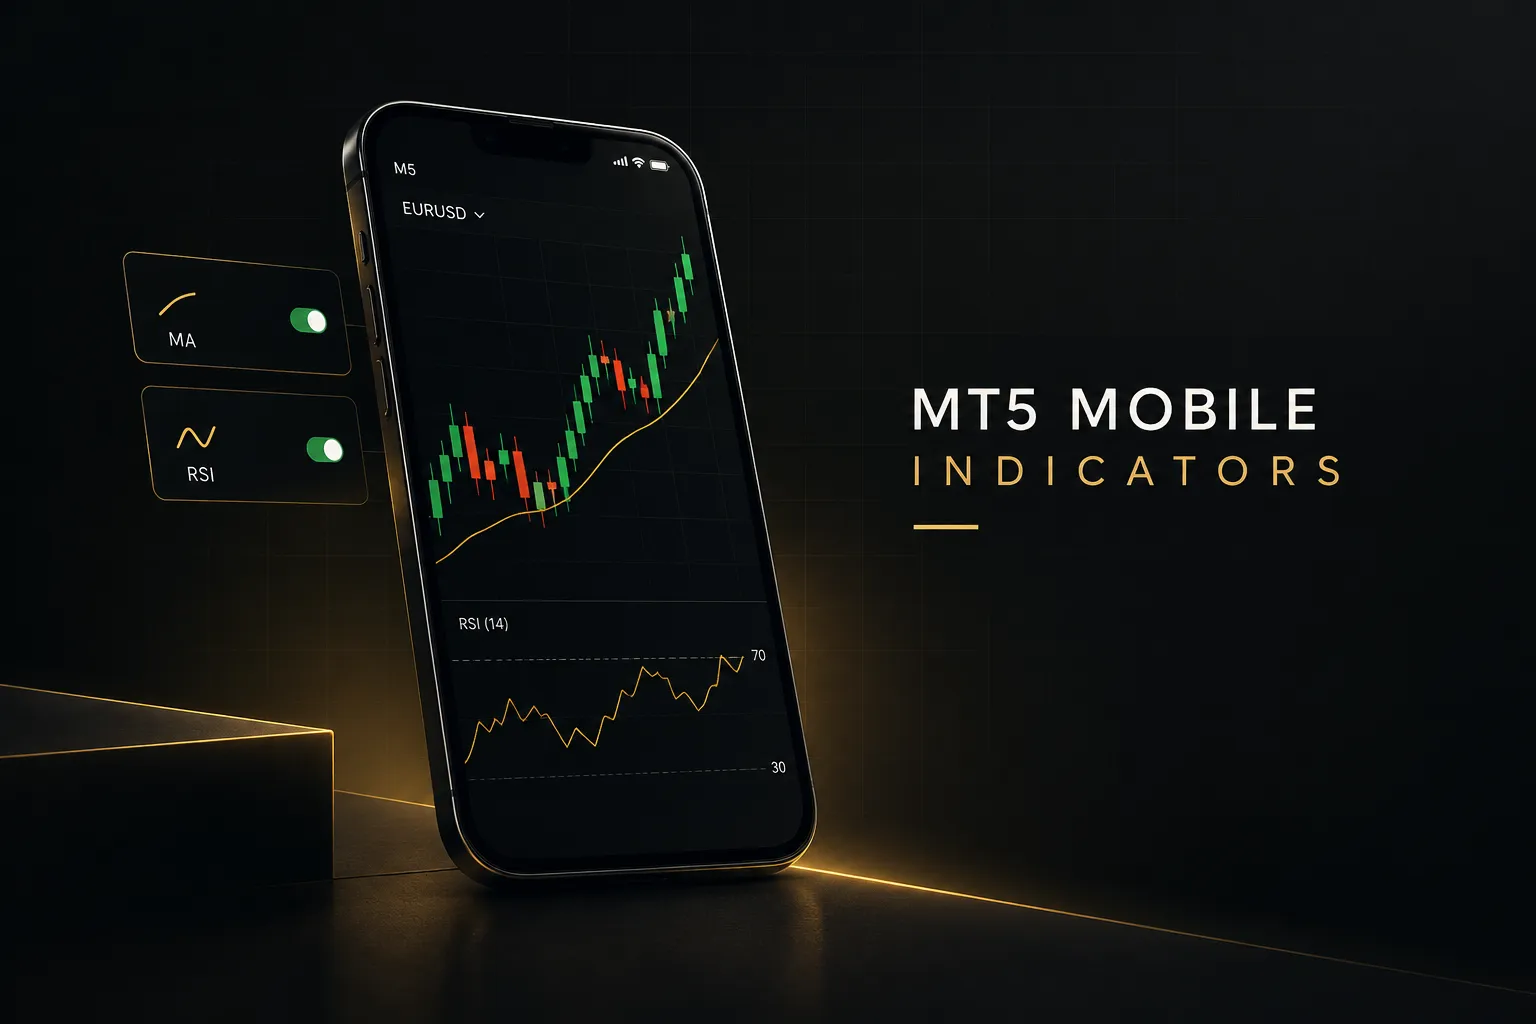
MT5 mobile indicators: what you can actually use
On this page
The mobile indicator reality check
Most traders discover the limits of their phone at the worst possible moment: mid-session, away from the desk, hunting for a custom indicator that simply isn’t there. The MetaTrader 5 mobile app does ship with a real library of built-in indicators.
It isn’t a toy.
But here’s the catch.
The Android and iOS apps cannot import custom EX5 files, cannot install products bought on the MQL5 Market, and cannot run Expert Advisors the way desktop MT5 can.
If your strategy depends on any of those, your phone will only ever be part of the picture.
This guide covers exactly what you can use on MT5 mobile indicators as of 2026. You’ll see what’s built in, how to add indicators step by step on Android and iPhone, how to choose tools without turning a six-inch screen into spaghetti, and how to bridge mobile monitoring with desktop-based custom systems when the app hits its limits.
One framing point before we start.
Indicators are analytical tools.
They summarize price behavior, highlight momentum, and flag volatility, but they don’t guarantee entries or exits.
An indicator tells you what price has been doing. Your risk management decides what happens to your account when price does something else.
Keep that in mind throughout.
The later sections return to it directly, because the best mobile setup in the world still needs a stop-loss, a sensible position size, and a clear risk-to-reward ratio behind every tap of the Buy button.
Built-in tools vs custom indicators
The single biggest source of confusion around MT5 mobile is the assumption that “MT5 is MT5.”
It isn’t.
The desktop terminal and the mobile app share a name, an account login, and a data feed, but they run very different execution environments.
What’s actually built into the app
The mobile app includes roughly 30 technical indicators, compared with 38 on the desktop terminal. That gap is smaller than most traders expect, and it covers the core tools that the vast majority of strategies rely on for technical analysis.
The native library breaks down into four familiar groups:
Trend indicators include the Moving Average (with simple, exponential, smoothed, and linear weighted modes, so the Exponential Moving Average is covered), Bollinger Bands, Parabolic SAR, Average Directional Index, Envelopes, and the Ichimoku Cloud. These form the backbone of any trend-following strategy.
Oscillators include the Relative Strength Index, Stochastic Oscillator, Moving Average Convergence Divergence, Commodity Channel Index, Average True Range, Momentum, and Williams’ Percent Range. These are your tools for momentum trading and overbought or oversold readings.
Volume indicators such as Volumes, On Balance Volume, Money Flow Index, and Accumulation/Distribution round things out, along with the Bill Williams set: Alligator, Awesome Oscillator, Fractals, Gator, and Accelerator.
Add in analytical objects like Fibonacci retracement and trendlines, and you have a complete toolkit for discretionary analysis.
Why custom indicators and EAs won’t load
Custom indicators and MQL5 Market products are compiled into .ex5 files built to run inside the desktop terminal’s execution environment. The mobile app has no folder to drop them into, no MQL5 runtime to execute them, and no import menu.
There is no installation path.
Not a hidden one, not a workaround one.
Expert Advisors face the same wall, with one useful nuance.
An EA cannot execute its logic locally on your phone. However, if an EA is running on your desktop or on a VPS, the positions it opens appear in the mobile app’s Trade tab, and you can monitor, modify, or close them manually.
Several guides online imply that any indicator on your desktop will “sync” to mobile.
That’s wrong, and it leads traders to buy MQL5 Market products expecting to use them on the go.
Here’s the clean distinction:
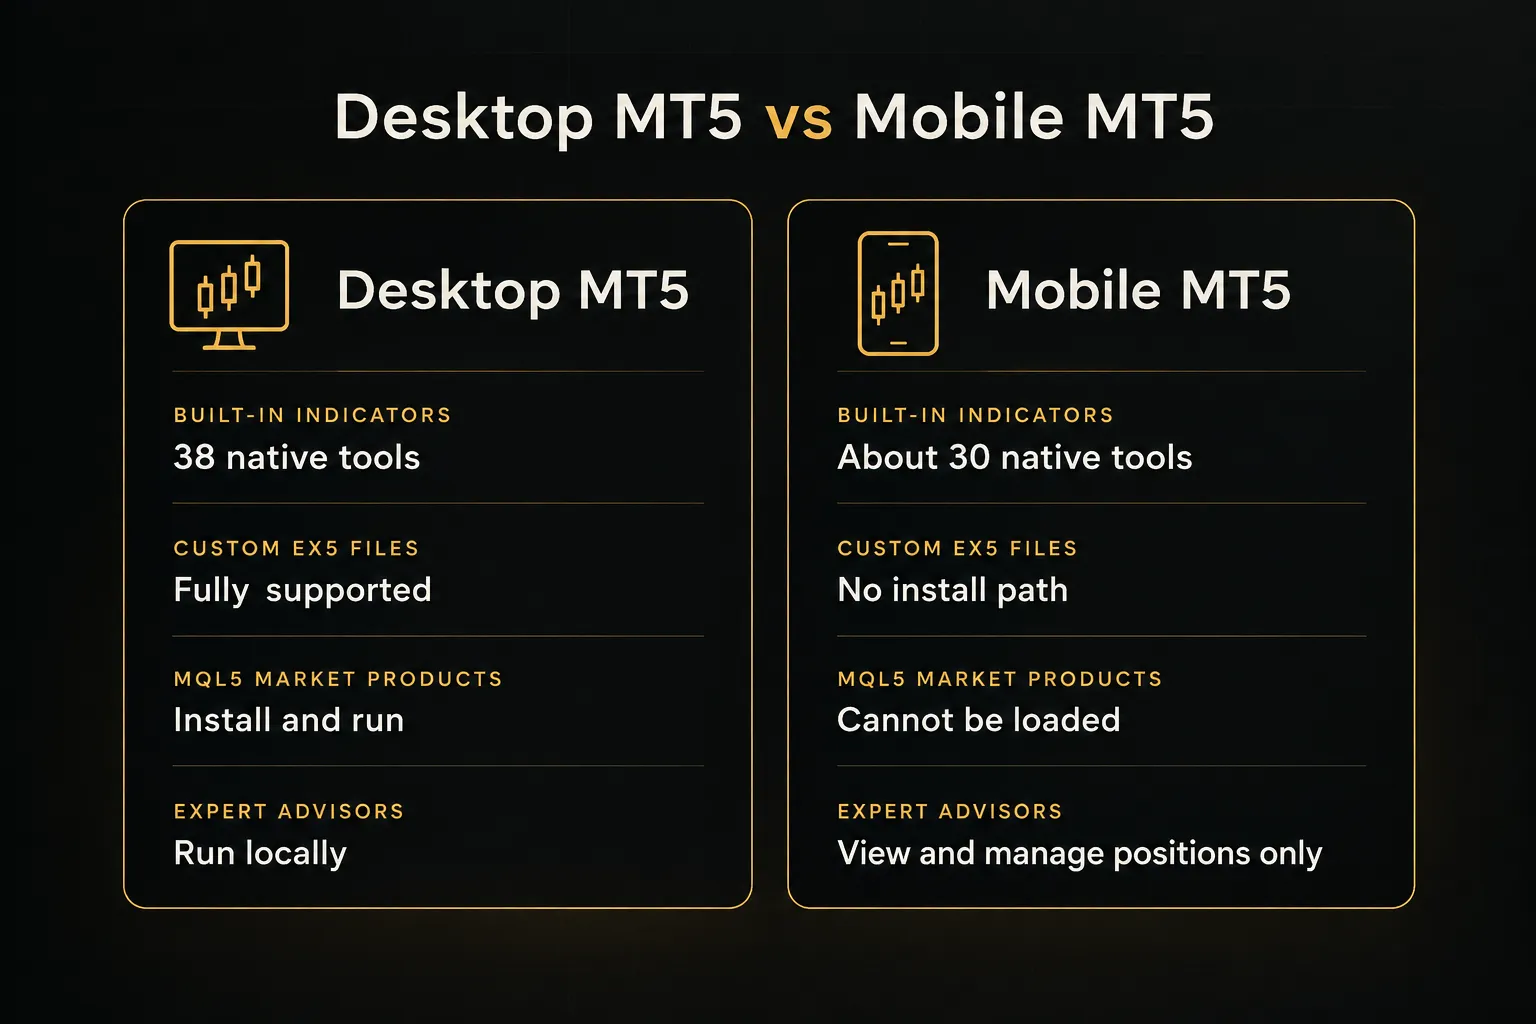
If an indicator came bundled with MetaQuotes’ default list, you’ll almost certainly find it on mobile.
If you downloaded it, coded it, or bought it, assume it stays on desktop.
Adding indicators on Android and iPhone
The process takes under 30 seconds once you know where to tap. The menus differ slightly between platforms and app versions, so follow the set that matches your device.
Android setup steps
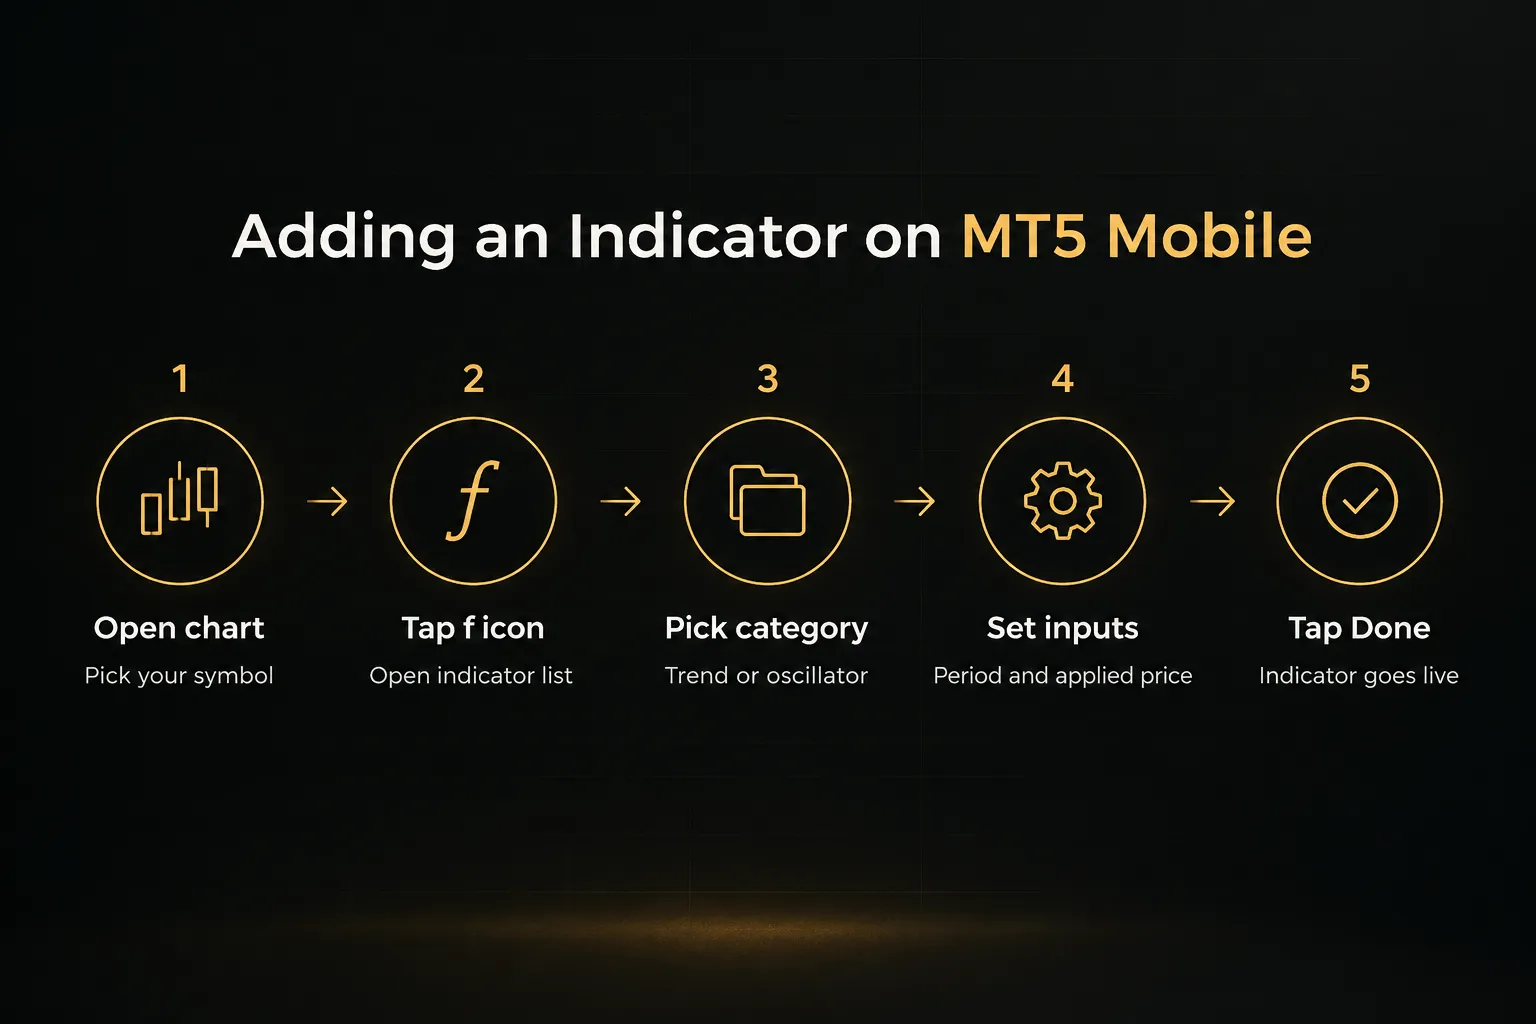
- Open the chart. Go to the Quotes tab, tap the symbol you want, and select Chart, or simply switch to the Chart tab at the bottom of the screen.
- Bring up the toolbar. Tap once on the chart to reveal the top toolbar, or long-press the chart to open the circular quick menu.
- Tap the indicator icon. Select the “f” symbol to open the indicator list, then tap the plus sign next to “Main window” for overlay tools.
- Choose a category and indicator. Browse Trend, Oscillators, Volumes, or Bill Williams, and tap the indicator you want to apply.
- Adjust parameters before applying. Set the period, method, applied price, and level values, then tap Done to place it on the chart.
- Edit color and settings later. Reopen the indicator list and tap the indicator name or its settings gear to change line color, thickness, or inputs, or remove it entirely.
iPhone setup steps
- Open the chart view. Tap the Chart tab and pick your symbol from the top selector.
- Tap the indicator symbol. Tap the chart to show the toolbar, then tap the “f” icon to open the indicator panel.
- Browse categories. Tap “Main window” to add an overlay, then scroll through Trend, Oscillators, Volumes, and Bill Williams.
- Apply the indicator. Select it, set your inputs and colors on the settings screen, and tap Done.
- Edit or delete as needed. In the indicator list, use the three-dot menu (or swipe left, depending on your iOS app version) to edit parameters or delete an indicator you no longer need.
Now, where does the indicator actually appear?
It depends on the tool.
Overlay indicators like the Moving Average, Bollinger Bands, and Parabolic SAR plot directly on the price chart because they share the same price scale.
Oscillators are different.
RSI, MACD, Stochastic, and ATR open in a separate indicator subwindow below the price chart, since their values (0 to 100 for RSI, for example) have nothing to do with price levels. Each oscillator gets its own panel unless you deliberately add it to an existing one.
Fixing missing or hidden indicators
Added an indicator and see nothing? Run through these checks:
- Zoom out or change timeframe. A 200-period Moving Average on a heavily zoomed chart may sit off-screen, so pinch out or switch to a higher timeframe to confirm it’s plotting.
- Load more chart history. Long-period indicators need enough bars to calculate, so scroll left to force the app to download older data.
- Restart the app. A frozen chart or failed data sync often clears after fully closing and reopening MT5.
- Check which window you used. If you added an oscillator to the main window or an overlay to a subwindow, it may look invisible, so remove it and re-add it to the correct location.
Matching indicators to market conditions
Here’s a counterintuitive truth: adding more indicators usually makes your analysis worse, not better.
The goal isn’t coverage.
It’s choosing the right lens for the market in front of you.
Indicators by market condition
Every market cycles between trending, volatile, and ranging phases. The table below maps each condition to the built-in tools that read it best on a small screen.
| Market condition | Best built-in indicators | What they tell you | Common mobile settings |
|---|---|---|---|
| Trending | Moving Average, MACD | Direction, trend strength, and when momentum behind the trend is fading | 50 and 200 EMA; MACD 12, 26, 9 |
| Volatile or expanding | Bollinger Bands, Average True Range | How far price typically moves, and when volatility is compressing or breaking out | Bollinger 20, 2.0; ATR 14 |
| Momentum extremes | RSI, Stochastic Oscillator | Overbought or oversold readings and momentum divergence from price | RSI 14 with 70/30 levels; Stochastic 5, 3, 3 |
| Ranging | Support and resistance zones, breakout levels | Where price has repeatedly stalled and where a breakout would invalidate the range | Horizontal lines on H4 and daily highs and lows |
ATR deserves special mention for volatility analysis.
It doesn’t tell you direction at all.
But it’s one of the most practical tools for setting stop-loss distances that respect how much an instrument actually moves.
Applying one indicator to another
MT5 lets you choose what data an indicator calculates from through its “Apply to” setting.
The standard options are price-based (Close, Open, High, Low, Median, Typical, Weighted), and on supported indicators you’ll also find “First Indicator’s Data” and “Previous Indicator’s Data.” The full set is always available on desktop; on mobile, the options shown depend on the indicator and app version.
Applying a Moving Average to RSI, for example, smooths RSI into a signal line.
Useful.
But apply that same logic carelessly and things go sideways fast.
Stacking Stochastic on top of RSI’s data means you’re measuring momentum of momentum. The output can look like a clean signal while actually being a twice-distorted echo of price.
If you can’t explain in one sentence what the combined line represents, don’t trade off it.
Avoiding chart clutter and overlap
Picture a chart running RSI, Stochastic, MACD, and three moving averages at once.
It looks thorough.
It isn’t.
RSI, Stochastic, and MACD all derive from the same price momentum.
When all three agree, you haven’t found triple confirmation… you’ve found one piece of information displayed three times.
That’s how confirmation bias creeps in: traders feel more confident while their actual edge hasn’t changed.
On a phone, the problem doubles.
Each subwindow steals vertical space, squashing the price chart until candles become unreadable. A lean mobile template works far better:
- One trend tool, such as a 50-period EMA or the Average Directional Index, to define direction.
- One momentum oscillator, such as RSI 14 or MACD, to time entries and spot divergence.
- Price-based support and resistance zones, drawn as horizontal lines, to anchor every decision to real levels.
This sparse setup is ideal for multi-timeframe analysis on mobile. Flick from daily to H4 to H1, and the same three elements give you a consistent read at every level without redrawing anything.
When mobile indicators hit a wall
So your strategy relies on a custom indicator or an EA that mobile can’t run.
Does that mean you’re chained to your desk?
Not at all.
It means you split the work.
Alerts, VPS, and remote access options
Three practical workarounds cover nearly every situation:
Push notifications from desktop MT5. Every mobile install has a unique MetaQuotes ID, found under Settings or Messages in the app.
Enter it in desktop MT5 under Tools, Options, Notifications, and any custom indicator or EA that supports alerts can send push notifications straight to your phone.
A VPS running your strategy 24/5. VPS trading keeps your terminal, custom indicators, and EAs running continuously on a remote server, so your laptop can be closed and your strategy keeps working.
MetaQuotes offers built-in virtual hosting inside the terminal, and many brokers provide free VPS access above certain trading volumes.
Remote desktop apps for emergencies. Tools like Chrome Remote Desktop or Microsoft Remote Desktop let you view your full desktop terminal from your phone.
It’s clunky for daily use, but invaluable when you need to see that one custom signal right now.
Using mobile for monitoring, not strategy building
The smartest setup treats your phone as an execution and monitoring layer. The analytical heavy lifting (custom signals, multi-timeframe confirmation, backtesting and forward testing) happens on a desktop or web-based system with full tooling.
The phone receives the result and lets you act on it.
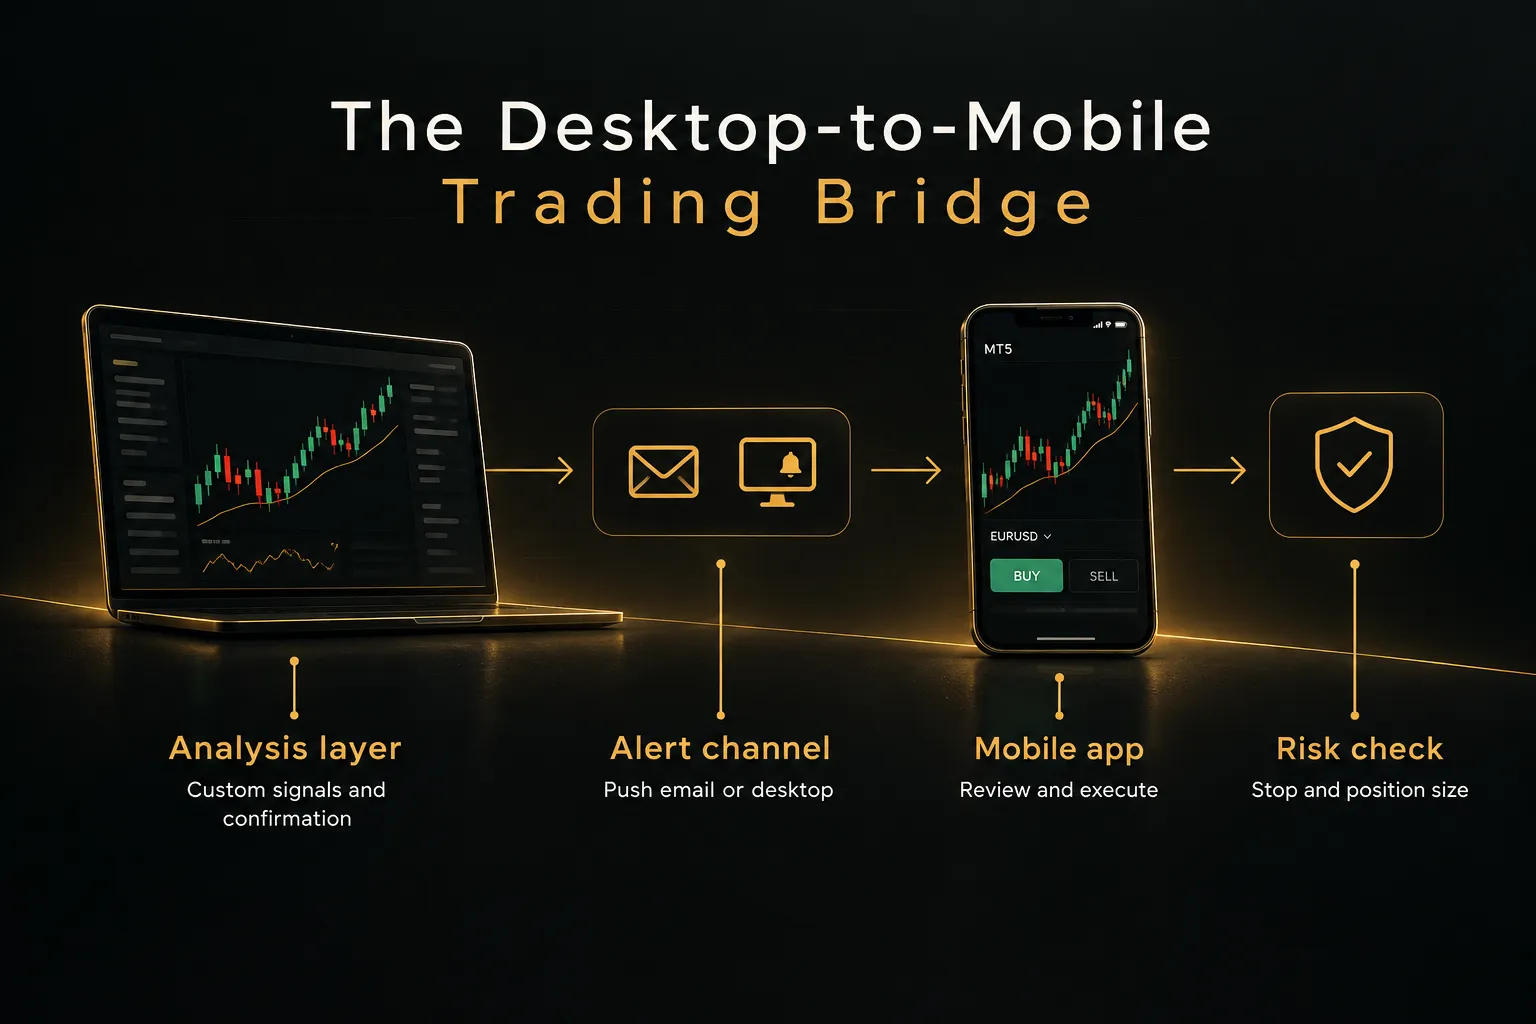
PipTrend is a concrete example of this bridge. It’s a TradingView-based signal and multi-timeframe confirmation system that sends real-time push, email, and desktop alerts.
When a setup triggers, you get a notification on your phone with the direction and entry level, without needing the indicator itself installed in MT5 mobile.
From there, you open your MetaTrader 5 mobile app, check the chart against your lean template, and place the trade.
The custom analysis stays where it runs best.
The phone does what phones do best.
Alerts replace the need to babysit charts. They don’t replace the need to think.
That distinction matters.
A signal tells you where an opportunity might be.
Your final entry, stop-loss placement, and position sizing still need deliberate risk management on the device, ideally with a fixed percentage risk per trade that keeps your maximum drawdown survivable during a losing streak.
FAQ
Can you add custom indicators to MT5 mobile?
No, you cannot add custom indicators to MT5 mobile.
The Android and iOS apps have no way to import .ex5 files or MQL5 Market products. Run custom indicators on desktop or a VPS and send their alerts to your phone via push notifications instead.
How do I get indicators on MetaTrader 5 mobile?
You get indicators on MetaTrader 5 mobile through the built-in “f” menu on any chart.
Open the chart, tap the “f” icon, choose the main window or a subwindow, and pick from roughly 30 native indicators.
No downloads are needed or possible.
What is the best indicator for MT5 mobile?
The best indicator for MT5 mobile depends on your strategy type, not on a universal ranking.
Trend traders tend to favor moving averages and MACD, range traders rely on support and resistance with RSI, and volatility traders use Bollinger Bands and ATR.
Pick one trend tool and one oscillator that match your approach.
Does MT5 mobile have all the indicators?
MT5 mobile does not have every indicator available on desktop.
It includes about 30 built-in tools compared with 38 on the desktop terminal, plus no support for custom or purchased indicators.
The core indicators most traders use, including RSI, MACD, Bollinger Bands, and moving averages, are all included.
Can I use an EA on MT5 mobile?
You cannot run an Expert Advisor on MT5 mobile.
EA logic only executes in desktop MT5 or on a VPS.
However, positions opened by a desktop or VPS-hosted EA appear in the mobile app, where you can monitor, modify, or close them manually.
How do I add RSI or moving average on my phone?
You add RSI or a moving average through the chart’s indicator menu.
On Android, tap the chart, tap “f,” then the plus beside Main window, and choose Trend for Moving Average or Oscillators for RSI.
On iPhone, tap the chart, tap “f,” select Main window, pick the indicator, set your inputs, and tap Done.
RSI will automatically open in its own subwindow.
Use mobile for monitoring, not guessing
The decision rule is simple.
If your strategy needs custom indicators or automation, run it on desktop or a VPS and use your phone for alerts and execution.
If it only needs built-in tools, a lean mobile chart is genuinely enough.
Here’s one thing to do tonight.
Open your MT5 app and strip your main chart down to three elements: one trend tool, one momentum oscillator, and a key price level.
Delete everything else.
If you’re running both RSI and Stochastic, keep one.
Three moving averages? Keep the one you actually make decisions from.
You’ll likely find the chart easier to read in seconds, and your decisions faster and cleaner.
And remember the bigger picture.
Indicators, whether on mobile or desktop, inform probability and context. They help you see where the odds might lean.
But they don’t decide outcomes.
Your stop-loss, your position size, and your discipline to follow a positive risk-to-reward ratio on every trade do that.
Get those right, and a simple mobile chart becomes a serious trading tool.
Sources
Risk Disclaimer: Trading involves risk. Past performance doesn't guarantee future results. Only trade with money you can afford to lose. PipTrend is a tool to assist your trading decisions, not financial advice.