On this page
Stop losses need volatility, not guesswork
Most stop losses don’t fail because the trade idea was wrong. They fail because the stop was placed at a random distance that had nothing to do with how the market actually moves.
A 20-pip stop on a pair that swings 90 pips a day is a donation, not a risk control.
The problem cuts both ways.
Stops placed too tight get clipped by ordinary noise, the routine back-and-forth that happens before price commits to a direction. Stops placed too wide feel safe, but they quietly balloon your account risk or force you into positions so small the trade isn’t worth taking.
This is where the Average True Range (ATR) earns its place. It gives you a volatility-adjusted stop distance based on how far price typically travels per bar.
But ATR alone is only half the answer.
ATR tells you how far price normally moves. Market structure tells you where your trade idea is actually proven wrong. A good stop needs both.
That’s the core claim of this guide.
ATR sets the volatility distance, while support and resistance, swing points, and liquidity zones decide the real invalidation level.
Use one without the other and you’re back to guessing.
The framework works across every liquid market, though the units change. Forex traders measure in pips, futures traders in ticks, index traders in points, and crypto and stock traders often think in percent or dollars.
The math is identical once you convert correctly.
By the end, you’ll know exactly how to use ATR for stop loss placement in 2026 markets. You’ll have the formula, a method for choosing your ATR period and multiplier, precise long and short placement rules, and a position sizing calculation that keeps dollar risk constant no matter how wide the stop gets.
What ATR actually measures
Here’s something many traders never realize: a simple high-minus-low range ignores overnight gaps entirely. If a stock closes at $50 and opens at $54, a bar ranging from $53 to $55 looks like a calm $2 day.
It wasn’t.
J. Welles Wilder built ATR in 1978 specifically to fix that blind spot.
The ATR formula step by step
Everything starts with true range.
For each bar, true range is the greatest of three values: the current high minus the current low, the absolute value of the current high minus the previous close, and the absolute value of the current low minus the previous close.
Take a EUR/USD bar with a high of 1.0890, a low of 1.0840, and a prior close of 1.0900. High minus low is 50 pips. High minus prior close is 10 pips, and low minus prior close is 60 pips.
The true range is 60 pips, because the gap down from the prior close counts as real movement.
ATR is then a smoothed average of those true range values over N periods, with 14 as Wilder’s default.
The first value is a simple average of the first 14 true ranges. After that, Wilder smoothing takes over:
ATR today = ((ATR yesterday × 13) + True Range today) ÷ 14
This works like an exponential average with a slow decay, so one extreme bar nudges ATR rather than spiking it. The TradingView ATR indicator uses this same RMA smoothing by default, with a length of 14.
One detail trips up a lot of people.
ATR is expressed in the instrument’s own price units. An ATR of 18.50 on gold means $18.50 per ounce, while an ATR of 0.0072 on EUR/USD means 72 pips.
You cannot compare “1.2 ATR on gold” to “1.2 ATR on EUR/USD” without converting both into dollar risk first.
Why ATR is backward-looking and non-directional
A rising ATR is not a bullish signal. It’s not a bearish one either.
ATR only measures the magnitude of movement, so a market crashing 3% a day and a market rallying 3% a day can produce identical ATR readings.
It’s also built entirely from past bars.
ATR has no idea that a central bank decision lands in an hour or that earnings drop after the close. Price gaps and news spikes routinely exceed the current ATR by two or three times.
So treat ATR as a description of recent behavior, not a forecast. It tells you what “normal” has looked like over the last 14 bars.
That’s useful.
But it’s not a guarantee about the next one.
The real framework: distance plus invalidation
Why do so many traders get stopped out right before price reverses in their favor? Often it’s because their stop sat exactly where everyone else’s did, at a clean mechanical distance from entry with no regard for what the chart was saying.
Why a flat 2x ATR rule fails
The “set your stop at 2x ATR” rule is popular because it’s simple.
And it’s better than a fixed pip count.
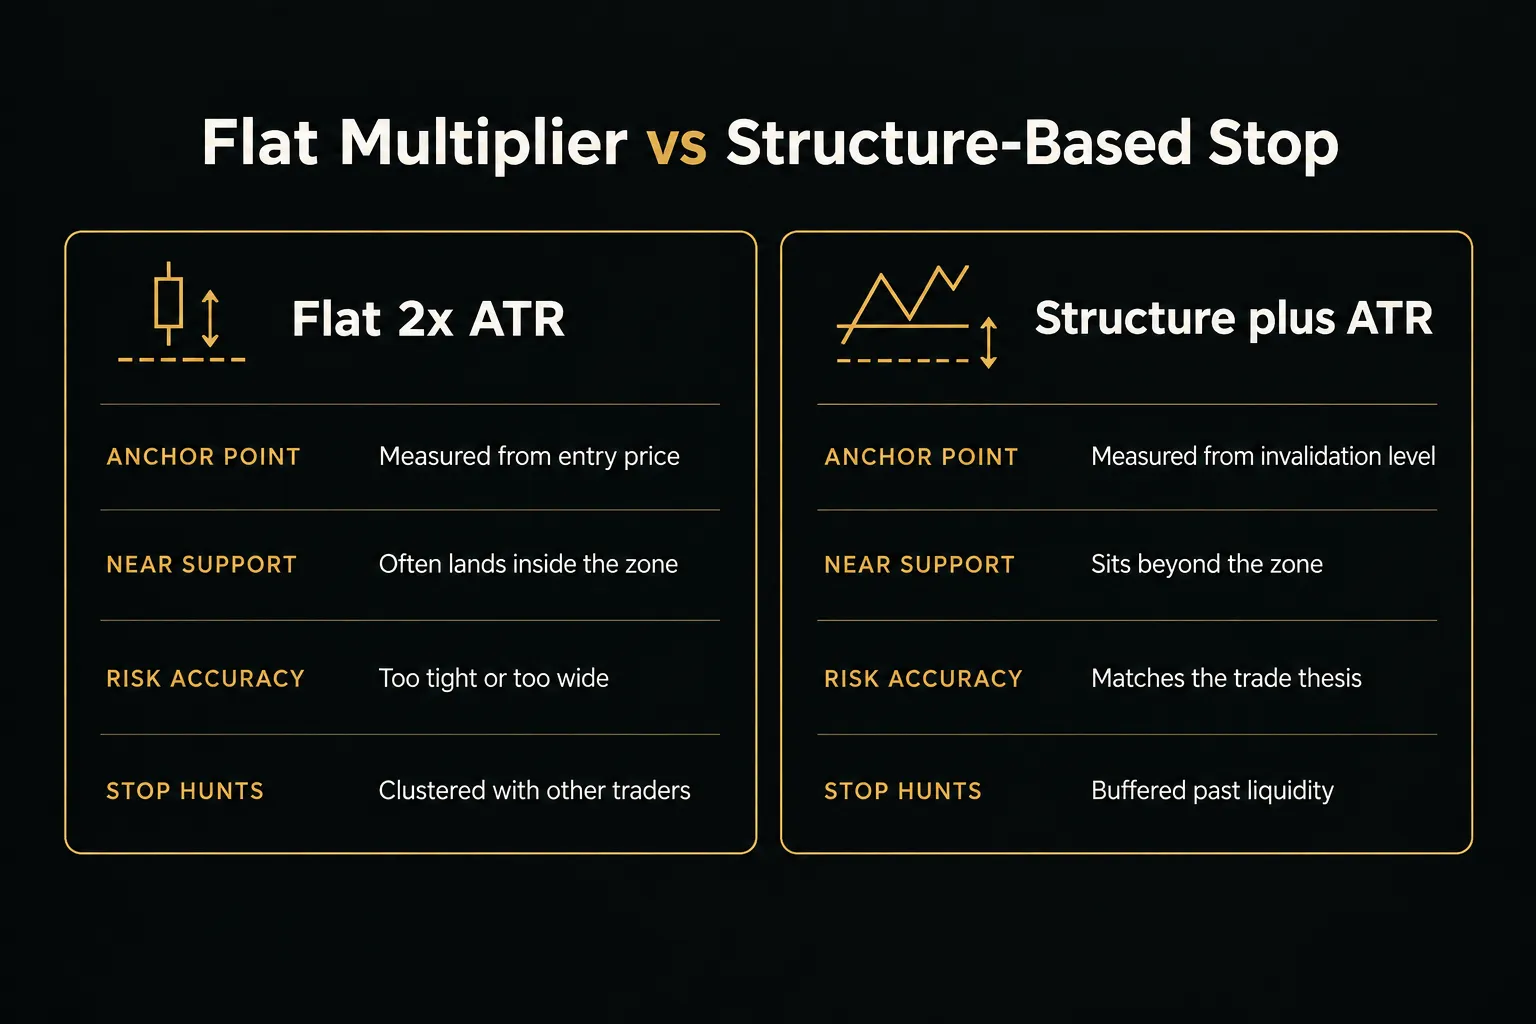
But a fixed multiplier measured from entry ignores where support and resistance actually sit.
Picture a long entry at $100 with a daily ATR of $1.00. A 2x ATR stop lands at $98.00. Now suppose a demand zone stretches from $97.50 to $98.20.
Your stop sits inside the zone, right where price is likely to dip, probe, and bounce.
You get stopped out on a perfectly normal retest.
The opposite happens too.
If the swing low that defines your setup sits at $99.40, a 2x ATR stop at $98.00 is far past the point where the trade was invalidated.
You’re accepting $2.00 of risk on an idea that was proven wrong at $99.40.
Combining ATR with structure and liquidity
The fix is a two-step process.
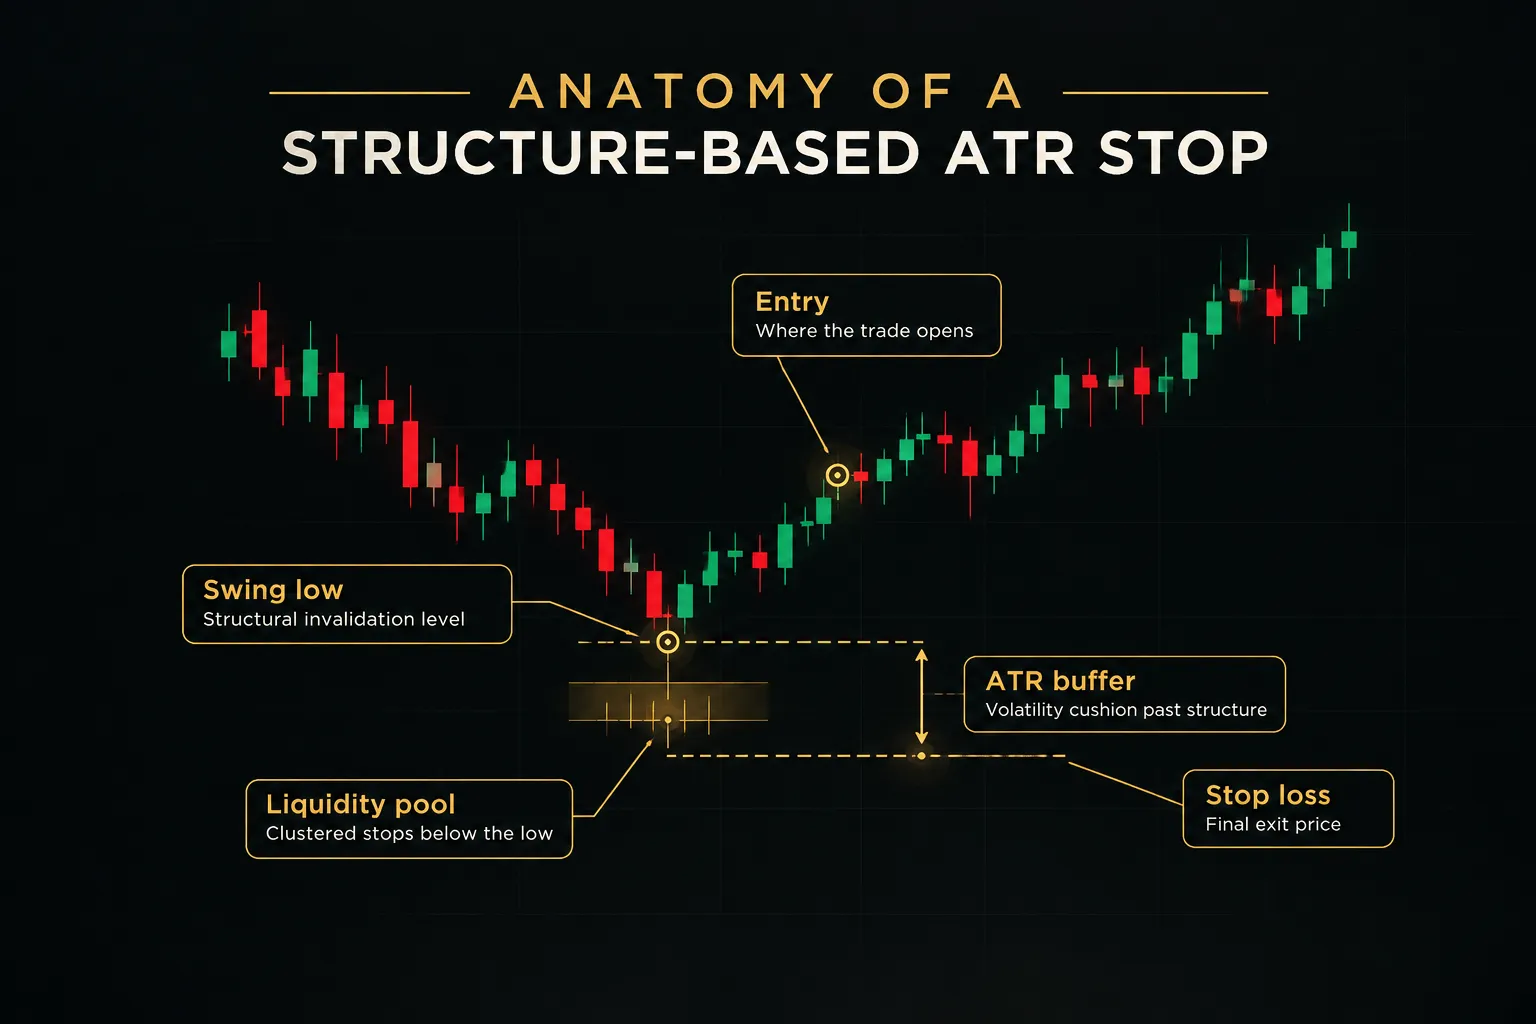
First, find the structural invalidation point: the level where, if price trades through it, your reason for being in the trade no longer exists. That’s usually a swing low for longs, a swing high for shorts, or the far edge of a supply or demand zone.
Second, use ATR × multiplier as a buffer beyond that level. The buffer accounts for wicks, spread widening, and the liquidity sweeps that commonly run just past obvious highs and lows.
Stops resting a few ticks beyond a swing point form a liquidity zone that larger players often target before the real move.
Long example: You buy a stock at $100.00 after a pullback. The demand zone bottoms at $97.50, and daily ATR(14) is $1.00. With a 0.5x ATR buffer, your stop goes at $97.50 minus $0.50, which equals $97.00.
Total stop-loss distance: $3.00, all of it justified by structure.
Short example: You short BTC at $64,000 on the 4-hour chart. The swing high that defines the setup is $65,200, and 4-hour ATR(14) is $900. A 0.5x buffer puts the stop at $65,200 plus $450, which is $65,650.
A mechanical 1.5x ATR stop from entry would have landed at $65,350, just $150 above the high and squarely in the stop-hunt zone.
Notice what changed.
The stop isn’t a distance from entry anymore. It’s a distance from the level that matters.
A quick pre-trade checklist
Before any order goes in, run through four questions. If one fails, adjust the stop or the size, or pass on the trade.
- The stop is beyond structure. It sits past the swing point or zone edge that invalidates the idea, not inside it.
- The ATR distance matches the current volatility regime. If ATR has doubled in the last week, a buffer sized for last month’s conditions is too small.
- Position size matches your intended dollar risk. A wider stop means fewer units, keeping your account risk percentage fixed.
- ATR is calculated on the timeframe of the trade thesis. A daily-chart setup needs daily ATR, not 5-minute ATR.
Choosing your ATR period and multiplier
There is no universal “best” ATR setting.
A multiplier that works beautifully on a daily swing trade in crude oil will shred a scalper on the 1-minute chart. The right ATR period and ATR multiplier depend on how long you plan to hold and how noisy your instrument is.
Multiplier by trading style
The table below gives starting ranges by style. Treat them as defaults to test, not rules.
When you’re using the structure-plus-buffer method from the previous section, the buffer multiplier will usually sit at the lower end, because structure already provides most of the distance.
| Trading style | Chart timeframe | Typical ATR period | Multiplier (from entry) | Buffer beyond structure |
|---|---|---|---|---|
| Scalping | 1-minute to 5-minute | 7 to 10 | 1.0x to 1.5x | 0.25x to 0.5x |
| Day trading | 15-minute to 1-hour | 14 | 1.5x to 2.0x | 0.5x |
| Swing trading | 4-hour to daily | 14 to 20 | 2.0x to 3.0x | 0.5x to 1.0x |
| Position trading | Daily to weekly | 20 to 21 | 2.5x to 4.0x | 1.0x |
ATR(14) remains a sensible default for most traders. It covers roughly three trading weeks on a daily chart, which captures the current regime without overreacting to a single wild session.
Volatile crypto pairs often benefit from a shorter period of 7 to 10. Conditions in BTC or SOL can flip from calm to violent within days, and a 14-period ATR lags that shift.
Lower-volatility FX majors like EUR/USD or USD/CHF behave differently. A 20 or 21 period smooths out random spikes and gives steadier stop distances.
Period and timeframe alignment
This is one of the most common and costly mistakes in ATR stop placement. A trader spots a setup on the daily chart, then drops to the 5-minute chart to time entry and calculates ATR there.
The 5-minute ATR might be 8 pips while the daily ATR is 75 pips.
The result?
A stop sized for 5-minute noise protecting a trade that needs daily-sized room to breathe.
It gets hit within hours, long before the daily thesis has a chance to play out. Always calculate ATR on the timeframe where your trade idea lives, even if you execute on a lower one.
Before trading any combination live, test it.
Run at least 50 to 100 historical or paper trades per setting and compare the results on these metrics:
| Metric | What it tells you | Warning sign |
|---|---|---|
| Win rate | Share of trades that close profitably | Jumps sharply only because stops are so wide they rarely trigger |
| Average R multiple | Average profit or loss measured in units of initial risk | Winners average below 1R while losers sit at a full 1R |
| Trade expectancy | (Win rate × average win) minus (loss rate × average loss) | Negative or near zero across 100 trades |
| Maximum drawdown | Largest peak-to-trough equity decline | Exceeds what you could tolerate emotionally or financially |
| Stop-out frequency | How often price hits the stop then reverses in your direction | More than a third of losses reverse within a few bars |
Expectancy is the number that settles arguments.
A 2x multiplier with a 45% win rate can beat a 1x multiplier with a 60% win rate if the average R multiple on winners is high enough.
Placing, sizing, and managing the stop
Knowing where the stop goes is only half the job.
You also need to convert that distance into your market’s units, size the position so the dollar risk stays fixed, and decide how the stop moves once the trade is working.
Here’s how each piece fits together.
Long and short placement examples
The formulas are simple.
The confirmation step is what separates a structured stop from a mechanical one.
- Long stop formula: Stop = Entry minus (ATR × multiplier), then confirm the result sits below the relevant swing low. If it doesn’t, move the stop to the swing low minus your ATR buffer.
- Short stop formula: Stop = Entry plus (ATR × multiplier), then confirm it sits above the relevant swing high. If it lands below the high, push it to the swing high plus your ATR buffer.
- Long worked example: Buy GBP/USD at 1.2700 with daily ATR(14) at 0.0080 (80 pips) and a 1.5x multiplier. The raw stop is 1.2580. The swing low is 1.2610, so 1.2580 already sits 30 pips beneath it, and the stop is confirmed.
- Short worked example: Short gold at $2,350 with daily ATR of $28 and a 1.5x multiplier. The raw stop is $2,392. But the swing high sits at $2,388, leaving only $4 of cushion, so you widen to $2,388 plus a 0.5x buffer ($14), placing the stop at $2,402.
Converting ATR into pips, points, and dollars
Stop distance and position size are two separate decisions.
This is the single most misunderstood part of ATR trading.
A wider ATR stop does not mean more risk.
It means a smaller position.
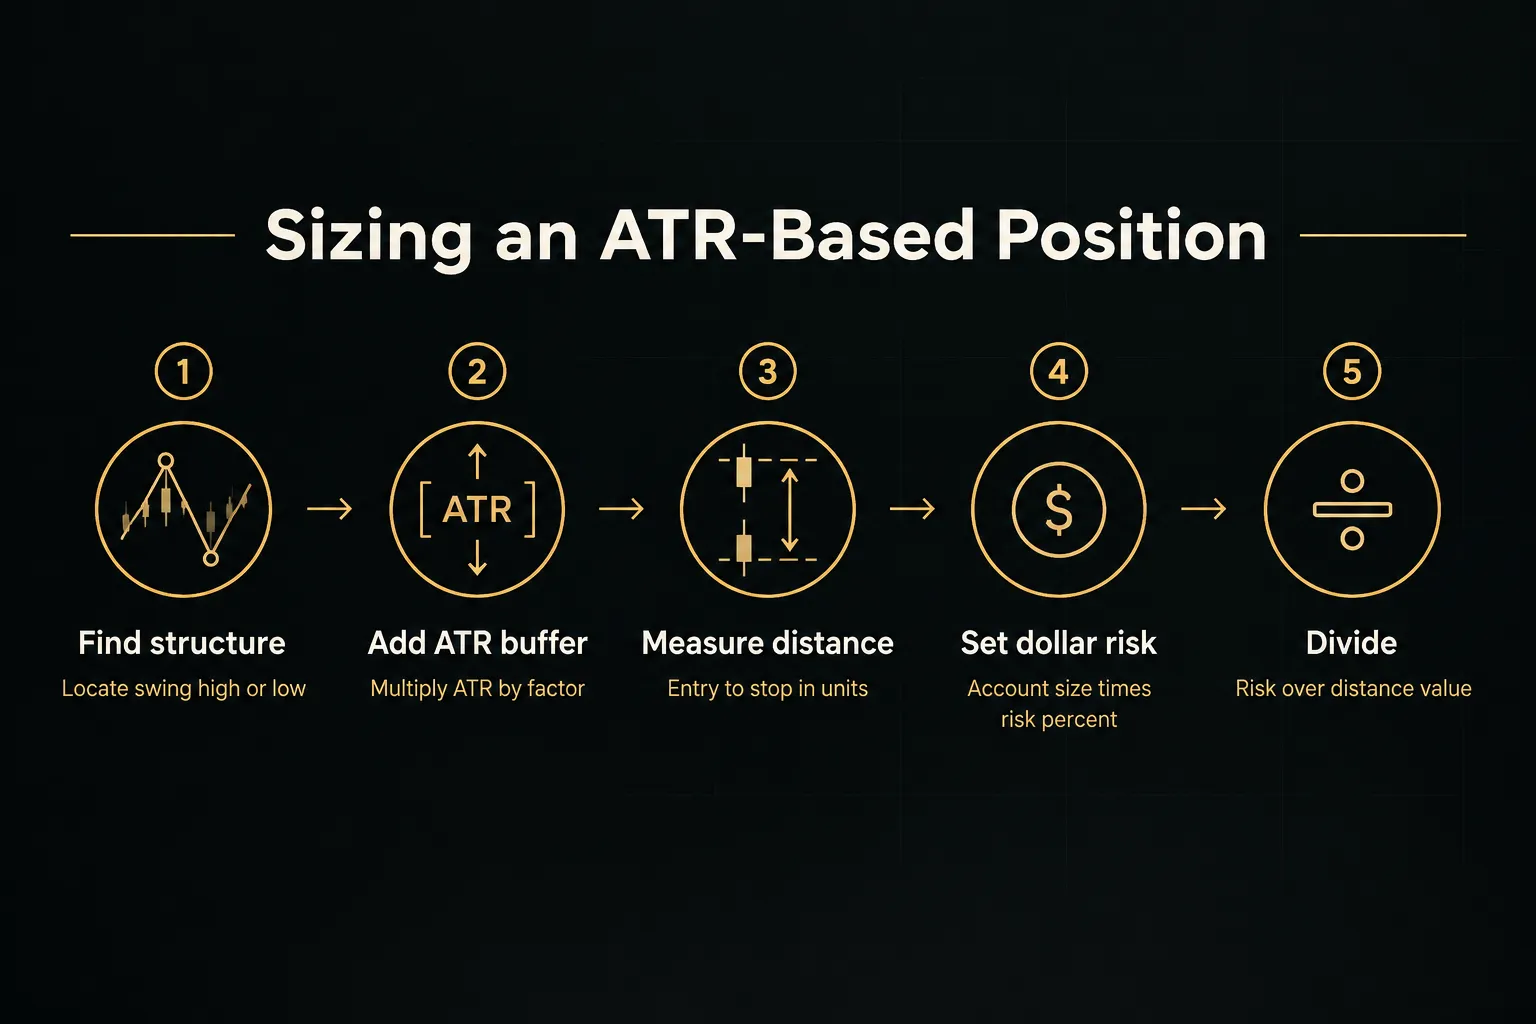
Position size = Account risk in dollars ÷ (Stop distance × value per pip, point, or tick)
- Forex (pips): EUR/USD ATR of 0.0068 equals 68 pips. A 1.5x stop is 102 pips. With a $500 risk budget and a standard lot pip value of $10, size = $500 ÷ (102 × $10) = 0.49 lots.
- Futures (ticks): The E-mini S&P 500 has a tick size of 0.25 points worth $12.50. An ATR of 40 points equals 160 ticks, or $2,000 per contract at a 1x stop. If you only want $1,000 of risk, one ES contract is too large, so you’d trade 5 Micro E-minis at $1.25 per tick ($200 each).
- Crypto (percent and dollars): With BTC at $64,000 and ATR at $1,800, daily volatility is about 2.8%. A 2x stop is $3,600, or 5.6% from entry. Risking $400 means a position of $400 ÷ $3,600 = 0.111 BTC.
- Indices (points): A NAS100 CFD with ATR of 300 points and a 1.5x stop gives 450 points of distance. At $900 of risk, size = $900 ÷ 450 = $2 per point.
- Stocks (dollars per share): A stock with ATR of $2.40 and a 2x stop has a $4.80 stop distance. Risking $600 means $600 ÷ $4.80 = 125 shares.
Your planned stop is not a guaranteed fill.
Several execution factors routinely push losses past the intended number:
- Spread and slippage: Spreads on minor FX pairs or altcoins can widen dramatically during illiquid hours, and stop orders become market orders when triggered. Add the typical spread to your stop distance before sizing.
- Commissions: Round-trip costs shrink your effective R. On scalping timeframes with 1x ATR stops, commissions can eat 10% or more of each risk unit.
- Weekend and overnight gaps: Stocks, futures, and FX can open far beyond your stop on Monday. Crypto trades continuously but still gaps through thin order books during liquidations.
- News releases: NFP, CPI, and central bank decisions frequently produce single bars of 2 to 3x ATR. Either reduce size ahead of them or stay flat.
Low-volatility compression creates its own trap.
When markets go quiet before a breakout, ATR can shrink to a fraction of its average. A 1.5x stop calculated during that squeeze might be absurdly close, sometimes inside the spread-adjusted noise of a single candle.
In those conditions, let structure set the minimum distance and use ATR only as a buffer beyond it.
Trailing stops and systematic exits
An initial stop protects capital. A trailing stop protects profit.
ATR works well for both, as long as you don’t tighten too aggressively.
- Ratchet with the latest ATR: For longs, trail at the highest high since entry minus (current ATR × multiplier). The stop only moves up, never down, even if ATR expands.
- Move to break-even after roughly 1R: Once price has moved one full unit of initial risk in your favor, shift the stop to entry (plus costs). This break-even stop turns a winning trade into a free one.
- Don’t over-tighten: Trailing at 1x ATR on a swing trade will stop out winners on normal pullbacks. Many trend-followers keep a 2.5x to 3x ATR trail, similar to the classic Chandelier Exit, so healthy retracements don’t end the trade.
- Use structure for the trail too: Move the stop below each new higher low (for longs) rather than every bar. This keeps the trail tied to market structure instead of pure arithmetic.
- Confirm the trend across timeframes: Trailing on a single chart can tighten your stop just as a higher timeframe trend accelerates. A multi-timeframe confirmation table, like the one used in systems such as PipTrend, shows whether the 1-hour, 4-hour, and daily trends still agree. If they do, hold the wider trail. If they start diverging, that’s your cue to tighten.
Frequently asked questions
How many ATR should I use for a stop loss?
Use 1 to 1.5x ATR for tight, structure-confirmed stops in clean trending conditions, and 2 to 3x ATR for swing trades or choppier instruments.
If you’re placing the stop beyond a swing point first, a smaller buffer of 0.5x to 1x ATR is usually enough. Refer to the trading style table above for timeframe-specific ranges.
What is the best ATR setting for stop loss?
ATR(14) is the best starting point for most traders because it balances responsiveness and stability. Volatile crypto often performs better with a 7 to 10 period, while slow FX majors suit a 20 or 21 period.
Always calculate ATR on the timeframe that matches your trade thesis, then test the combination on at least 50 to 100 trades.
How do you calculate stop loss with ATR?
Subtract ATR × multiplier from entry for longs, or add it for shorts. Then check that the result sits beyond the nearest swing low or swing high.
If it doesn’t, place the stop at the structural level plus an ATR buffer instead.
Should I use ATR for stop loss or take profit?
Use ATR for both, but anchor the stop to structure first. Many traders set targets at 2x to 3x the stop distance for a favorable risk-reward ratio, or project targets using daily ATR to judge how much movement is realistic.
The stop side protects capital, so it deserves the most precise logic.
What is the difference between ATR stop loss and trailing stop?
An ATR stop loss is a fixed initial exit set when you enter, while an ATR trailing stop moves in your favor as price advances.
The initial stop defines your 1R risk.
The trailing stop locks in profit, typically starting after the trade reaches about 1R and moving to break-even first.
How do you use ATR for position sizing?
Divide your dollar risk by the stop distance times the value per pip, point, or tick. If you risk 1% of a $50,000 account ($500) with a 100-pip stop on a $10-per-pip standard lot, you trade 0.5 lots.
Wider ATR stops automatically produce smaller positions, so your dollar risk stays the same.
One check before you place the stop
If you remember one rule from this guide, make it this: before entering, confirm the ATR-based distance sits beyond the nearest structural invalidation point, not just a mechanical multiple from entry.
That single check eliminates most premature stop-outs.
Then match your approach to the conditions in front of you.
In quiet, range-bound markets, widen the multiplier and add a structural buffer, because compressed ATR understates the breakout that’s coming. In strong trends, a tighter ATR trail with break-even management after 1R captures more of the move without giving back gains.
The bigger picture is simple.
ATR answers how far. Structure answers why there.
And position sizing is what keeps either answer safe for your account, whether the stop is 15 pips or 1,500 dollars away.
Sources
Risk Disclaimer: Trading involves risk. Past performance doesn't guarantee future results. Only trade with money you can afford to lose. PipTrend is a tool to assist your trading decisions, not financial advice.