Supertrend settings explained: build a repeatable framework
On this page
Why the same supertrend settings don’t work everywhere
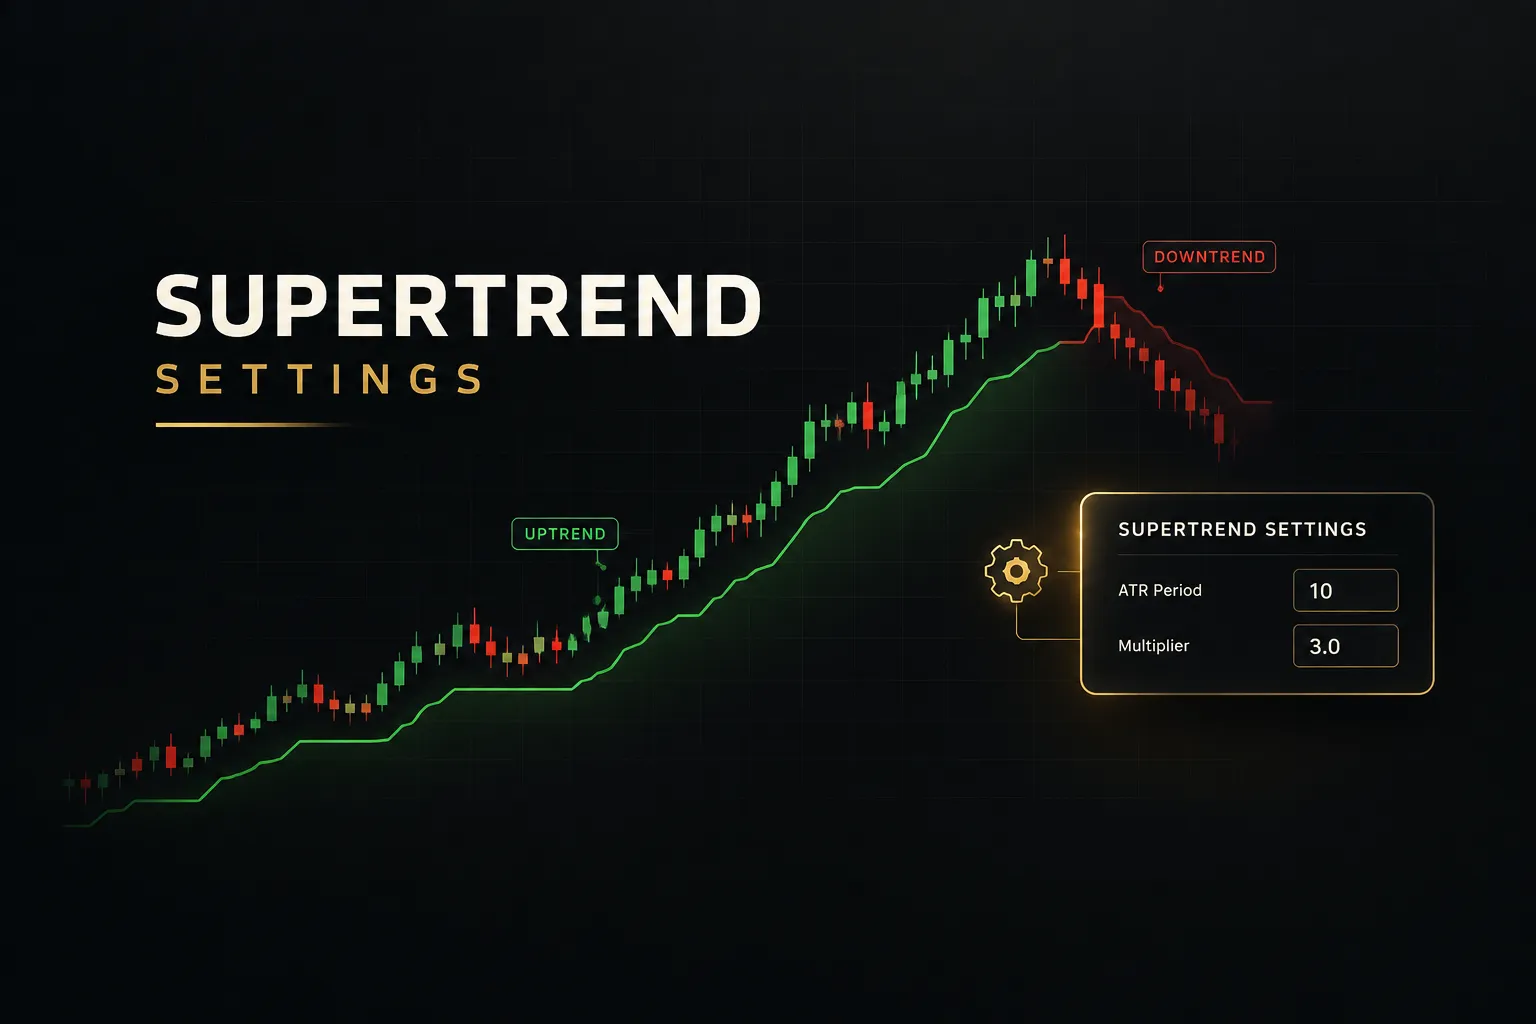
Ask ten trading forums for the best supertrend settings and nine will answer “10 and 3.” That default is quoted as if it were a law of physics.
It isn’t.
Put 10,3 on a EUR/USD 15-minute chart and you get a reasonably calm line that holds through London session pullbacks. Put the same numbers on a BTC/USD 1-minute chart and the line flips constantly. On a daily chart of a large-cap stock, it might sit on one side of price for months.
Same inputs, three completely different trading experiences.
Supertrend is a volatility-adjusted trend indicator, and it has only two levers: the ATR period and the ATR multiplier. Their ideal values depend on three variables that change from trader to trader: your timeframe, the current volatility regime, and your execution cost (spread, commission, slippage, financing).
So this isn’t a list of magic numbers.
It’s a settings-and-validation framework. By the end, you’ll know how to pick a sensible starting point for your market, test it without fooling yourself, and confirm it holds up before real money is on the line.
How ATR period and multiplier shape every signal
Most traders who struggle with Supertrend change both settings at once. That’s like adjusting the bass and treble together and then wondering which knob fixed the sound.
The mechanics are simple.
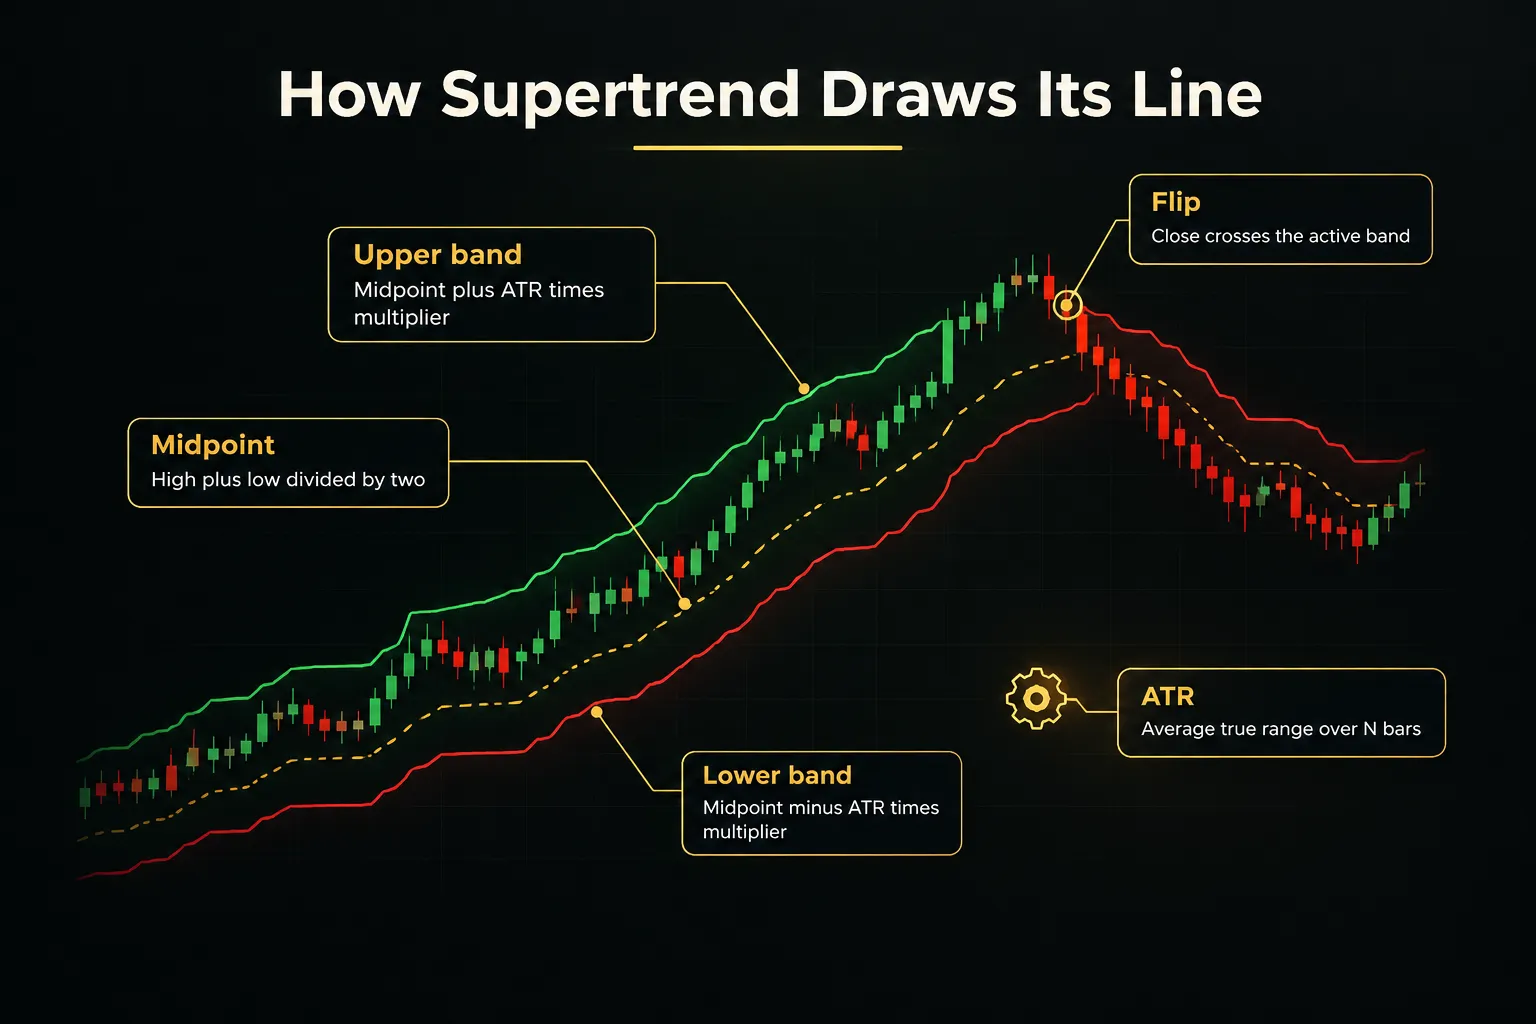
Supertrend starts with the bar’s midpoint, (high + low) ÷ 2, then plots an upper band at the midpoint plus Average True Range times the multiplier, and a lower band at the midpoint minus ATR times the multiplier. The active band ratchets in the direction of the trend (it can tighten but not loosen), and the indicator flips when price closes beyond the opposite band.
Here’s the practical rule most guides skip.
If signals arrive too late, look at the ATR period first. If signals are too noisy, look at the multiplier first.
ATR period: how fast the indicator reacts
The ATR period controls how many bars feed the volatility estimate. A 7-period ATR responds quickly when a market suddenly expands or contracts.
A 20-period ATR smooths that out, so one wild candle barely moves the bands.
Think of it as the indicator’s memory.
Short memory means the band distance adapts fast to new conditions, which helps when volatility shifts mid-session. But it also means a single news spike can widen the bands abruptly, then shrink them again a few bars later, pulling the line closer to price than you’d expect.
If your entries consistently arrive after most of the move is gone, a shorter ATR period is the first adjustment to try. Move in small steps, such as 10 to 8, rather than jumping to extremes.
Multiplier: how far price must move to flip
The multiplier sets the distance.
At 3, price must close more than three ATRs beyond the midpoint-based band to reverse the trend. At 2, it only needs two.
This is the noise dial.
A lower multiplier hugs price and catches reversals early, but it also flips on routine pullbacks inside a sideways market. A higher multiplier tolerates deeper retracements and keeps you in trends longer, at the cost of giving back more profit before an exit triggers.
If you’re getting chopped up by whipsaw trades, raise the multiplier by 0.5 before touching anything else.
Why 10,3 isn’t automatically the best setting
10,3 became popular because it’s the default on several major charting platforms, including TradingView’s built-in Supertrend.
Defaults spread because they’re convenient. Not because anyone proved they’re optimal for your chart.
On a slow, low-volatility instrument, 10,3 can be so wide that it rarely flips at all. On a fast instrument at a low timeframe, it may still be too tight.
The right question isn’t “what’s the best setting?” but “what setting matches the noise level of the market I actually trade?”
Treat 10,3 as a reference point you test against, not a destination you copy.
Matching settings to your market and timeframe
Here’s a counterintuitive truth: the same ATR multiplier can be “tight” on one chart and “loose” on another, even though ATR already adjusts for volatility. ATR normalizes the size of moves.
It doesn’t normalize their character.
Use this as a starting decision tree, then validate it (Section 5 shows how):
- Scalping and choppy intraday moves (1m to 5m): Faster settings, such as an ATR period of 7 to 10 with a multiplier of 1.5 to 2.5, so signals arrive while the move is still tradable.
- Swing trading (1H to 4H, some daily): Balanced settings around 10 to 14 with a multiplier of 2.5 to 3.5, which filter routine pullbacks while still catching multi-day trends.
- Position and trend trading (daily and weekly): Slower settings, such as 14 to 21 with a multiplier of 3 to 4, so the line acts as a wide ATR trailing stop that survives normal corrections.
The trade-off is explicit and unavoidable.
A lower ATR period and a smaller multiplier give earlier entries, but they produce materially more whipsaws, especially during consolidation. In a ranging market regime, a 7,2 setting might flip four or five times across a band that a 10,3 setting ignores completely.
And identical numbers on two instruments are not equivalent.
GBP/JPY tends to produce sharp, wick-heavy candles that spike through levels and snap back. A major equity index often trends in smoother, more persistent legs.
A 10,3 setting will see far more false breakouts on the first than the second, even though both are measured in ATR units.
Scalping and fast intraday charts
On 1-minute and 5-minute charts, noise dominates.
A meaningful share of candles are just order-flow jitter with no directional intent.
Faster settings make sense here, but only when paired with a filter. A common approach is to trade only in the direction of a higher-timeframe Supertrend, for example taking 5-minute long signals only when the 1-hour line is bullish.
That single rule often cuts the number of counter-trend flips you act on by a large margin.
Also check whether your expected move per trade comfortably exceeds your round-trip cost. On a 1-minute chart, a 0.6-pip spread can eat a big slice of a 4-pip target.
That reality alone pushes many scalpers toward slightly slower settings than they’d prefer.
Forex pairs and session volatility
Forex volatility isn’t constant across the day.
It clusters.
The Asian session on EUR/USD is often quiet, while the London open and the London/New York overlap can double or triple the typical hourly range.
That matters because a short ATR period rescales the bands quickly when the session changes.
A 7-period ATR on a 15-minute chart will tighten during Asia and then widen sharply after London opens, which can trigger flips right as real volatility arrives. A 14-period ATR smooths that transition but reacts more slowly to genuine regime changes.
For session-sensitive pairs, many traders keep settings balanced (around 10,3) and simply avoid acting on signals in their least liquid hours. Restricting when you trade is often more effective than endlessly tweaking the numbers.
Crypto and other high-volatility markets
Crypto trades 24/7, with weekend liquidity gaps, liquidation cascades, and occasional moves of 5% to 10% in an hour on major coins.
Tight settings get shredded in that environment.
Most crypto traders find they need either a higher multiplier (3.5 to 4 on intraday charts) or a higher timeframe than they’d use in forex. A 15-minute BTC chart with 10,3.5 often behaves more like a 5-minute forex chart with 10,3 in terms of signal frequency.
Volatility regimes also shift dramatically.
Settings that worked during a trending quarter can fail badly in a range-bound one, so re-check your parameters whenever realized volatility changes by a large amount.
Confirmation, repainting, and real-world costs
A backtest can look brilliant and still lose money live.
Usually the indicator isn’t broken.
The trader is acting on information that didn’t exist yet, or ignoring costs that always existed.
Open-candle signals vs confirmed closes
Supertrend’s flip condition depends on the close.
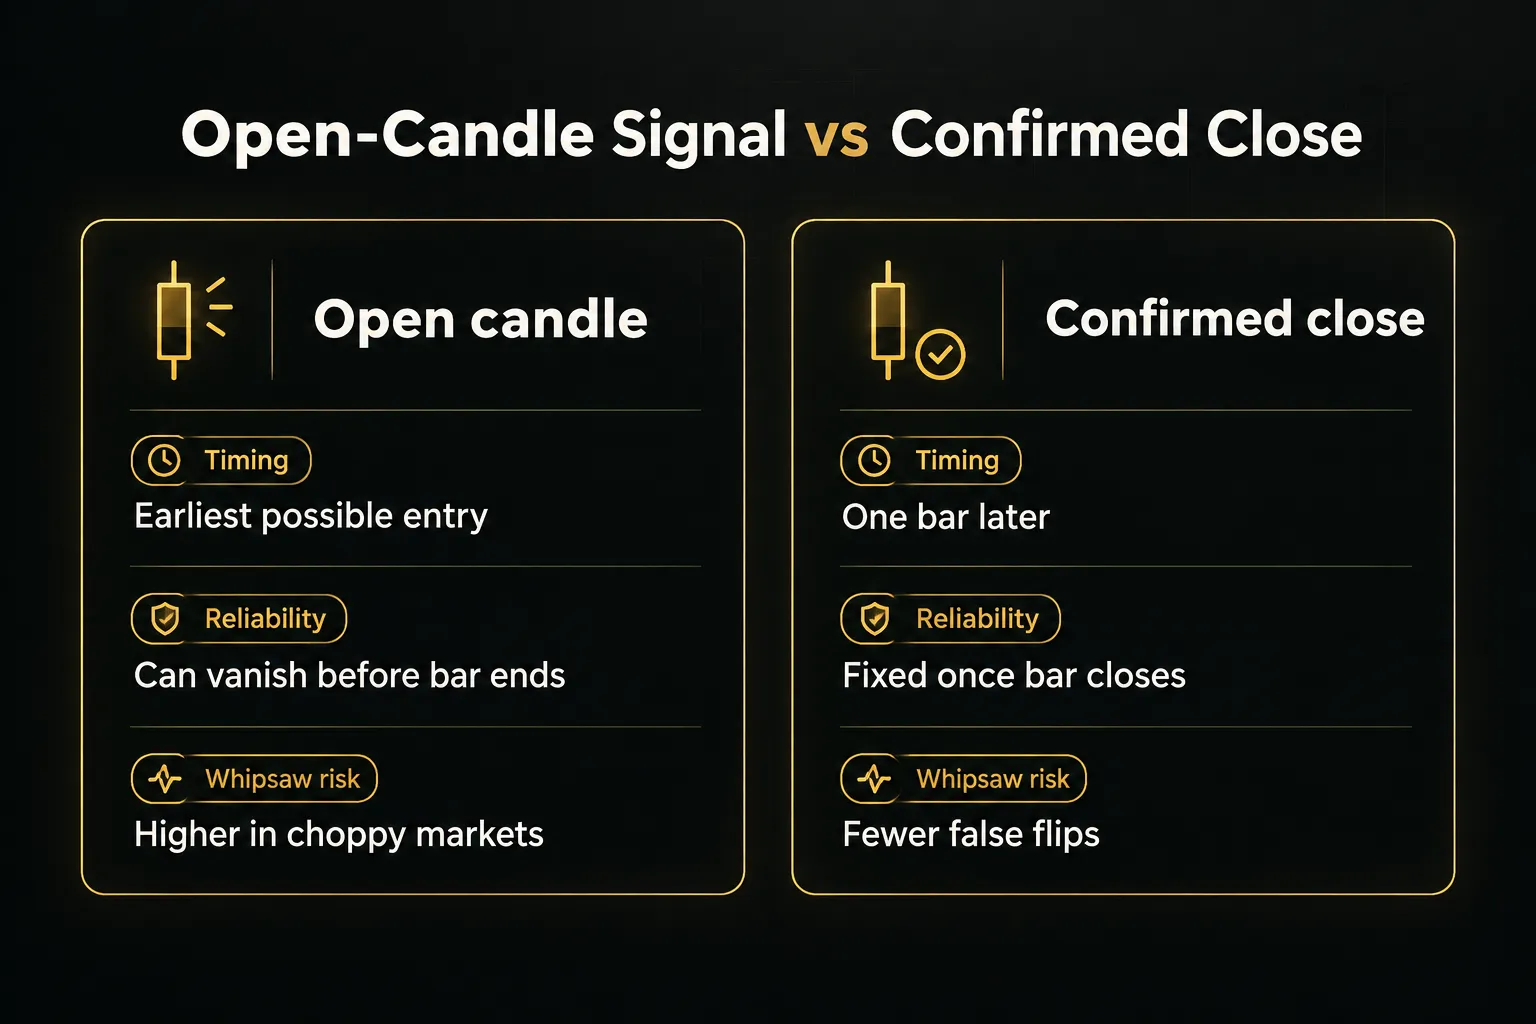
While a candle is still forming, its “close” is just the current price, so the line can flip mid-bar and then flip back before the bar ends.
This is why candle-close confirmation matters.
If you enter the moment the line changes color, you’re betting that price will still be beyond the band when the candle closes. In choppy conditions, that bet loses often.
Waiting for the close costs you a little entry price but removes a whole category of phantom signals.
A related point: Supertrend does not repaint historical values.
Once a bar closes, its Supertrend reading is fixed. But the current bar’s reading changes until the close, which looks like repainting to anyone watching live.
Backtests only see closed bars, so if you trade intrabar, your live results will differ from the test.
Why identical numbers behave differently across platforms
“10,3” on one platform may not equal “10,3” on another.
The difference hides in the formula details.
Some implementations calculate ATR with RMA (Wilder’s smoothing, used by TradingView’s built-in version), others with a simple moving average or an EMA. Some use the high-low midpoint as the price source, others use close or a different average.
Flip logic can also vary, for instance whether a close equal to the band counts as a cross.
Each difference shifts band distances slightly, and small shifts change which bars flip. If you’re moving a strategy between TradingView, MetaTrader, a broker platform, or a Python backtester, verify that the line plots on the same bars before trusting any comparison.
Otherwise you’re testing two different indicators that happen to share a name.
Spreads, slippage, and funding costs
Costs scale with trade frequency.
And faster Supertrend settings trade a lot.
Consider the inputs that rarely make it into a casual backtest:
- Spread: Paid on every round trip, and it widens around news and session opens, exactly when flips cluster.
- Commission: Crypto futures taker fees are commonly around 0.04% to 0.05% per side on major exchanges, so frequent flips compound quickly.
- Slippage: Market orders on a flip often fill worse than the signal price, especially in fast markets.
- Overnight financing: Forex and CFD positions held past rollover pay or receive swap, which matters for slower settings that hold for days.
- Funding rates: Crypto perpetuals typically settle funding every 8 hours, and in strong trends the rate can run well above baseline against the crowded side.
A strategy that makes 0.1% per trade gross can turn negative after a 0.1% round-trip cost.
Always model costs at slightly worse than average, not best case.
Validating settings without fooling yourself
The easiest way to find a “perfect” Supertrend setting is to test 200 combinations and pick the winner.
It’s also the fastest way to lose money.
With enough combinations, one will look great by pure chance.
A testing workflow that avoids overfitting
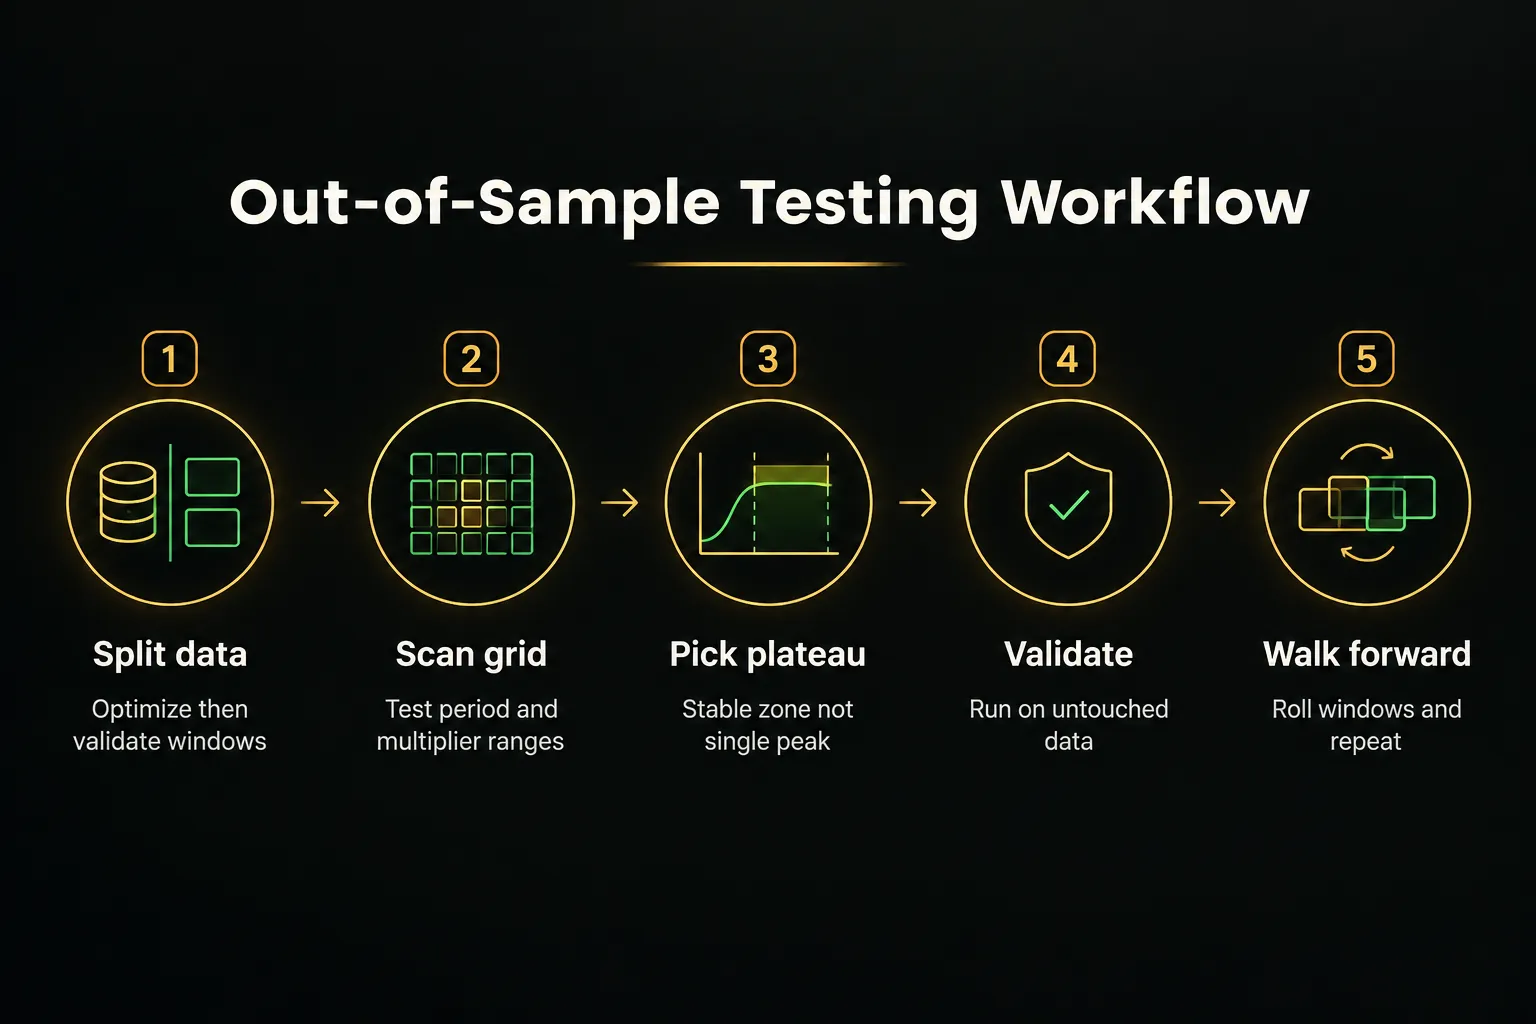
Good backtesting separates the data you tune on from the data you judge on. Here’s a workflow that holds up:
- Split the history. Use roughly the first 70% for optimization and keep the last 30% untouched for validation.
- Scan a sensible grid. For example, ATR periods of 7 to 20 and multipliers of 1.5 to 4 in steps of 0.5.
- Pick a plateau, not a peak. Choose a setting surrounded by other profitable settings, since an isolated best result is usually noise.
- Run out-of-sample testing. Apply the chosen setting once to the validation window and accept the result.
- Repeat with walk-forward analysis. Roll the optimization and validation windows forward through time to see if the chosen region stays stable.
When you report results, include the sample size (aim for 100+ trades where possible), the test period, maximum drawdown, and expectancy alongside win rate. A 70% win rate means little if the average loser is three times the average winner.
From ATR stops to position size
Your multiplier choice is also a risk decision. A wider band means a wider stop, which means a smaller position for the same dollar risk.
Say you have a $10,000 account, risk 1% ($100) per trade, and EUR/USD ATR is 20 pips. With a multiplier of 3, the stop sits roughly 60 pips away, so you’d trade about 0.17 standard lots (at $10 per pip).
Drop the multiplier to 2 and the stop shrinks to about 40 pips, allowing 0.25 lots.
Neither is “better.”
The tighter stop gives larger size but more stop-outs. The wider stop survives noise but needs a bigger target to keep the risk-reward ratio attractive.
Choose settings and sizing together, never separately.
Using Supertrend as a filter, not a trigger
Supertrend is often strongest when it isn’t the thing pulling the trigger. As a trend-following system component, it shines in three supporting roles.
First, as a trend filter: only take longs when the higher-timeframe line is bullish.
Second, as an exit tool: use the line as a trailing stop that tightens as the trend matures.
Third, as a confluence check: require Supertrend to agree with structure, momentum, or a key level before entering.
Tools built around this idea reduce reliance on any single parameter set. PipTrend, for example, combines a Supertrend-style direction signal with separate entry levels, a whipsaw filter, and a multi-timeframe table that shows confirmation across 12 timeframes.
The direction read and the entry decision come from different inputs, so one imperfect setting doesn’t dictate the whole trade.
Frequently asked questions
What is the most accurate Supertrend setting?
No single Supertrend setting is the most accurate across all markets.
Accuracy depends on timeframe, volatility, and costs, so 10,3 might suit a 1-hour forex chart while a 15-minute crypto chart needs something closer to 10,3.5 or 10,4.
The most accurate setting for you is the one that survives out-of-sample testing on your instrument.
What is the best Supertrend setting for a 5-minute chart?
A practical starting range for a 5-minute chart is an ATR period of 7 to 10 with a multiplier of 2 to 3. Use 7,2 or 10,2 for faster liquid markets if you can tolerate more whipsaws, and lean toward 10,3 if costs are high.
Pairing it with a 1-hour trend filter usually improves results more than further tweaking.
What is the best Supertrend setting for a 15-minute chart?
10,3 is a reasonable baseline for a 15-minute chart on major forex pairs and indices. For volatile instruments like GBP/JPY or crypto, test multipliers of 3.5 to 4.
Wait for candle-close confirmation, since mid-bar flips on 15-minute charts are common around session opens.
What is the best Supertrend setting for intraday trading?
Most intraday traders get the best balance from ATR periods of 7 to 14 and multipliers of 2 to 3.5. Lower values suit scalping on 1-minute to 5-minute charts, while 10,3 fits 15-minute to 1-hour charts.
Validate against your actual spread and commission, because intraday costs eat thin edges quickly.
Is Supertrend better than moving averages?
Supertrend is better than a basic moving average at adapting to volatility, but not universally better. Because its bands scale with ATR, it widens in fast markets and tightens in quiet ones, whereas a moving average uses a fixed lookback.
Both struggle in sideways markets, so a filter matters more than the choice between them.
How do I use Supertrend for entry and exit?
Use Supertrend for entries only after a confirmed candle close in the trend direction, ideally aligned with a higher-timeframe trend. For exits, treat the line as a trailing stop and close when price closes beyond it.
Many traders find it works better as an exit tool than an entry trigger.
What is the difference between Supertrend 7,3 and 10,3?
Supertrend 7,3 reacts faster to volatility changes than 10,3 because its ATR uses 7 bars instead of 10. Both require a 3-ATR move to flip, but 7,3 rescales its bands more quickly after spikes or quiet periods.
Expect slightly earlier signals and slightly more noise from 7,3.
How do I avoid false signals in the Supertrend indicator?
The most effective way to avoid false signals is to wait for candle-close confirmation and trade only with the higher-timeframe trend.
Raising the multiplier by 0.5 also filters routine pullbacks.
Finally, skip low-liquidity sessions and consolidation zones where whipsaws cluster.
Pick a starting point, then let data decide
Here’s your next step.
Pick a balanced setting that matches your timeframe (around 10,3 for 15-minute to 1-hour charts, faster for scalping, slower for daily). Then run it forward on a demo account or very small size for a defined sample, such as 50 to 100 trades, before committing real capital.
Track expectancy, drawdown, and costs, not just wins.
If the numbers hold, scale up slowly. If they don’t… adjust one lever at a time and test again.
The core shift is simple.
Supertrend settings are a hypothesis to validate for each market and timeframe, not a universal constant to copy. Treat them that way, and as of 2026 you’ll be ahead of most traders still hunting for the magic numbers.
Sources
Risk Disclaimer: Trading involves risk. Past performance doesn't guarantee future results. Only trade with money you can afford to lose. PipTrend is a tool to assist your trading decisions, not financial advice.