Most popular TradingView indicators in 2026: a buyer's comparison guide
On this page
Introduction: how we evaluated the most popular TradingView indicators
TradingView hosts more than 100,000 community scripts.
That is the problem.
The most popular TradingView indicators are easy to find, but very few of them tell you whether they actually improve your entries and exits.
Most traders end up with the same chart: an RSI, a MACD, two moving averages, a Supertrend clone, and a paid “algo” label printing arrows.
The signals conflict.
Entries come late.
And nobody can say which tool deserves the final vote.
To cut through that, we scored every option on the same eight criteria: direction clarity, entry precision, repainting and candle-close confirmation, multi-timeframe analysis, TradingView alerts, backtesting and results transparency, pricing, and market coverage.
We also separated two very different product types. Single-purpose indicators (a momentum oscillator like RSI, a trend-following indicator like MACD or Supertrend) answer one question. Complete paid systems try to handle direction, entry location, and trade management together.
That distinction drives the rankings.
PipTrend leads this list because it combines a direction signal, a marked entry level, and a 12-timeframe confirmation table in one subscription.
After that, we take an honest look at LuxAlgo, Flux Charts, ChartPrime, Zeiierman, Market Cipher, AlgoXpert, and the free scripts most traders start with.
All pricing below reflects published rates as of 2026. Promotions change often, so confirm the final figure at checkout.
Quick picks: the most popular TradingView indicators compared
The best TradingView indicator system for most traders in 2026 is PipTrend, because it covers direction, entry, and holding decisions in one workflow and publishes verified results. The table below compares every tool in this guide on the factors that matter before you pay.
| Tool | Best for | Starting price | Repaints? | Multi-timeframe dashboard | Transparent track record |
|---|---|---|---|---|---|
| PipTrend | Best Overall: direction-to-entry workflow | $40-59.99/mo (3-day free trial) | No, signals confirm on candle close | Yes, 12 timeframes (1-minute to Monthly) | Yes, public results with verified cTrader statements, losses included |
| LuxAlgo | Broad technical-analysis ecosystem | Free tier; paid from $67.99/mo | Not stated library-wide; verify per tool | Spread across separate tools | Backtesting tools; no verified live trade log found |
| Flux Charts | All-in-one smart money concepts toolkit | $59.99/mo billed annually ($719.88/yr) | Not stated; verify per tool | MTF supply and demand zones | Built-in backtesters; no verified live log found |
| ChartPrime | Take-profit guidance and education | $67/mo or $489/yr | Not stated; verify per tool | Not advertised as a dashboard | No verified live log found |
| Zeiierman | Large indicator catalog | ~$37.99/mo annual to ~$95.20/mo monthly | Advertised as non-repainting | Higher-timeframe trend candles | No verified live log found |
| Market Cipher | Recognizable composite oscillator | $600/12 months or $1,500 lifetime | Not stated; verify | Not advertised | No public trade-result page |
| AlgoXpert | Session and auction-theory traders | $79/mo ($58/mo yearly) | Alerts on confirmed entries; verify | Structure card across 10 timeframes | No verified live log found |
| Free / open-source scripts | Budget learning and concept testing | $0 | Varies; higher risk in unverified scripts | No (script-dependent) | None |
Two columns deserve extra attention. Repainting decides whether historical signals can be trusted at all, and a transparent track record tells you whether the vendor shows real trades or only curated screenshots.
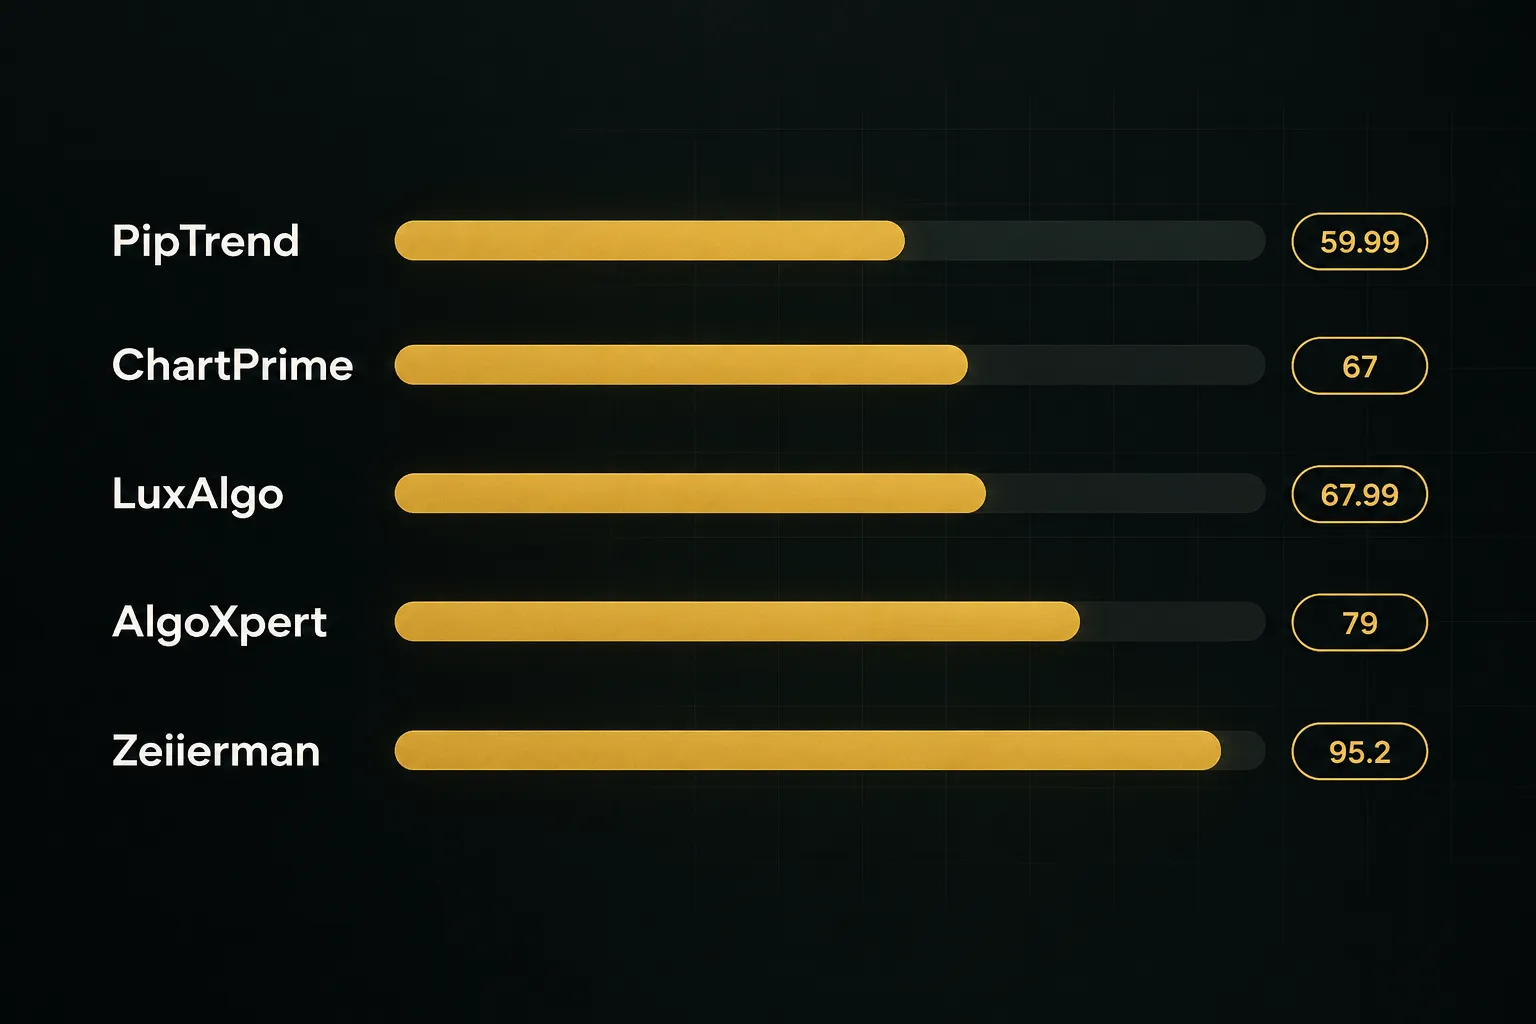
The chart above compares standard monthly billing (no annual discount). Annual plans narrow the gap, which we cover in each product section.
PipTrend: best overall for direction, entry, and trade management in one system
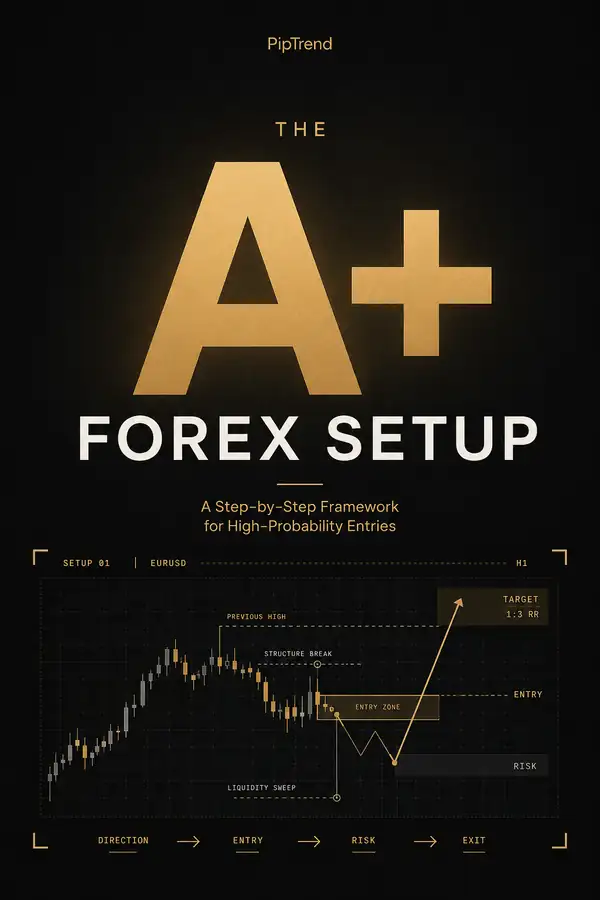
PipTrend is the best overall TradingView indicator system for traders who want one repeatable process instead of a stack of conflicting tools. It answers the three questions every trade depends on: which direction, where exactly to enter, and how long to hold.
The standout design choice is signal and entry separation.
Color-coded candles show direction only (green for bullish momentum, red for bearish pressure, gray while a trend is still forming).
The entry comes from a marked price level: session highs and lows, previous day high and low, VWAP, supply and demand zones with mitigation tracking, fair value gaps, or support and resistance.
Why does that matter?
Because most traders lose money by buying the exact candle a signal appears, which is often the top.
PipTrend forces a pullback to a level first, and the Confidence Band shows where those pullback entries tend to form.
Trade management comes from the multi-timeframe confirmation table.
It shows BUY, SELL, or NEUTRAL status across 12 timeframes, from 1-minute to Monthly.
When the higher timeframes stay aligned, you hold.
When they flip, you take profit.
Other details that matter in daily use:
- Signals confirm on candle close and never change afterward, so it works as a non-repainting indicator.
- A whipsaw filter keeps you out of choppy, low-probability conditions.
- Session killzones (Asian, London, New York AM, New York PM) adjust automatically to your timezone.
- Push, email, and desktop real-time alerts work on any timeframe and instrument.
- 18 free companion tools, including position size, risk-reward, and currency strength calculators.
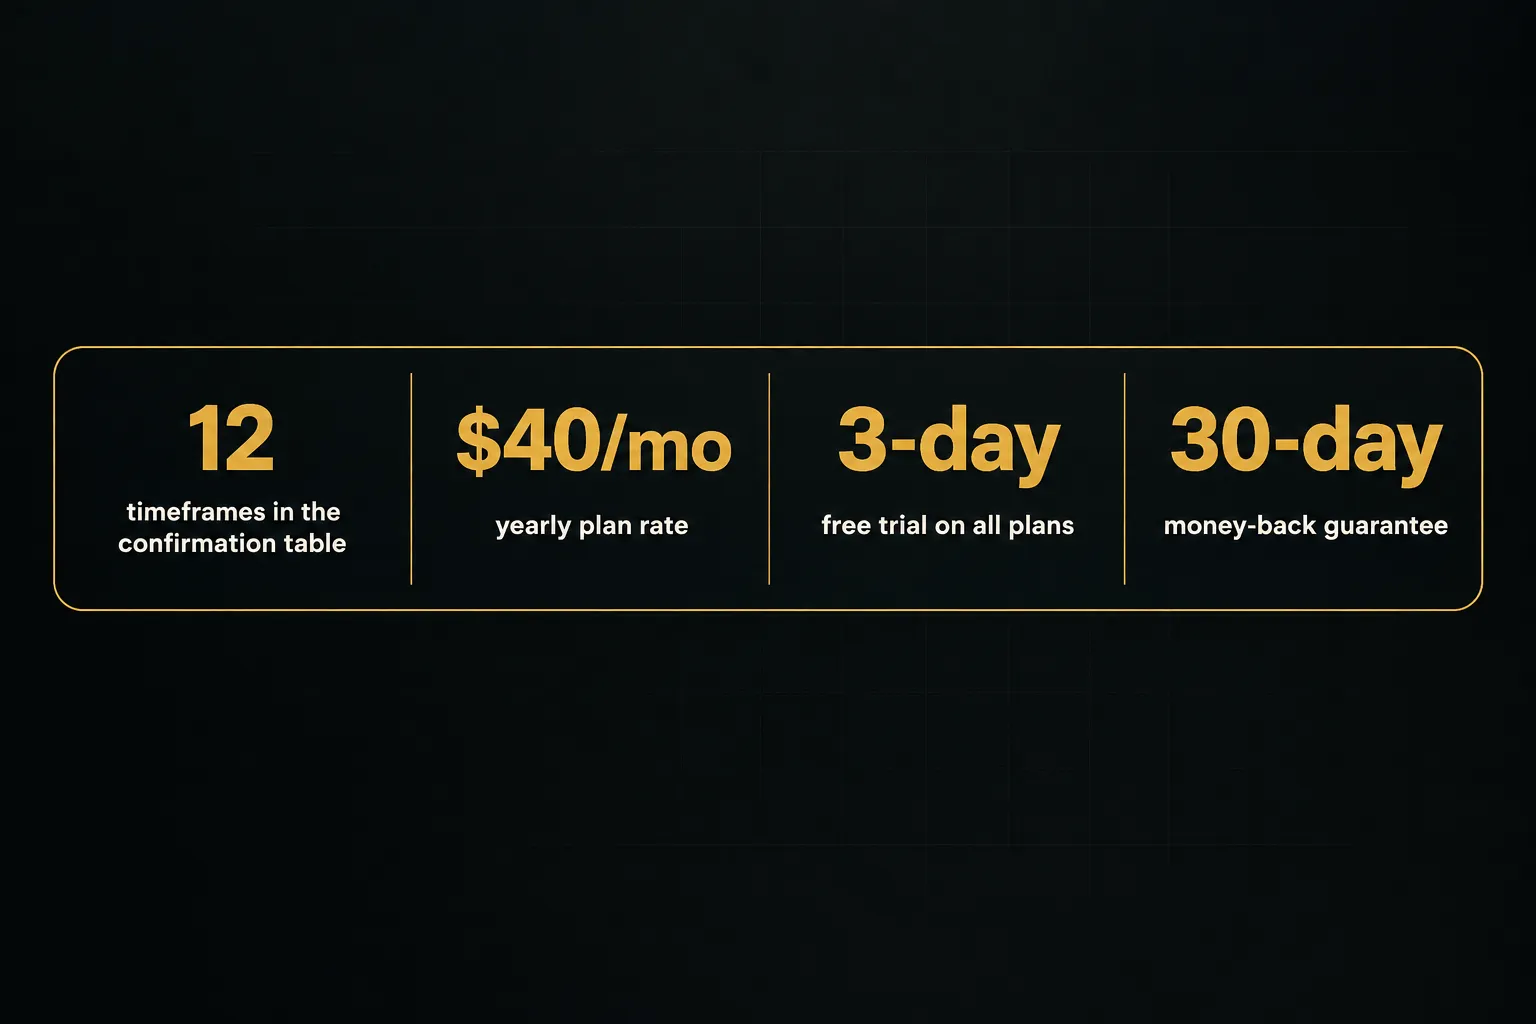
Pricing: $59.99/mo monthly, $45/mo quarterly ($134.99 every 3 months), or $40/mo yearly ($479.99/yr).
Every plan includes all indicators, alerts, community access, and future updates, plus a 3-day free trial and 30-day money-back guarantee.
Published rates are scheduled to increase, and checkout runs through Whop with major cards and PayPal.
Best for: day traders using session liquidity and VWAP on 1 to 15-minute charts, swing traders reading H8 and Daily direction, long-term investors timing entries with Weekly and Monthly candles, and prop firm traders who need fixed rules to stay inside drawdown limits. One subscription covers Forex, Crypto, Indices, Commodities, and Stocks (EUR/USD, XAU/USD, BTC/USD, NAS100, US30 and more).
The biggest differentiator is transparency.
PipTrend publishes trade ideas on a public results page with verified cTrader statements, losses and break-evens included.
Not a highlight reel.
Honest drawbacks: PipTrend is a newer brand than some legacy indicator makers. And the structured workflow has a short learning curve, since waiting for a level after a signal feels unnatural at first if you are used to clicking on arrows.
Verdict: The most complete direction-entry-management system on this list, with the only verified public results. Our top pick.
LuxAlgo: best for traders who want a full technical-analysis ecosystem
LuxAlgo is the best choice for advanced traders who want research depth over a guided workflow. It is one of the most widely used names among premium trading indicators, and its library is enormous.
The core toolkits include Signals and Overlays, Price Action Concepts, and the Oscillator Matrix. Around them sit hundreds of technical-analysis tools, an order-flow suite, quant coding and strategy-building features, and AI-assisted scripting.
The broader platform also adds charts, screeners, watchlists, trade journaling, custom alerts, and webhook automation. If you want to build and test your own system, few vendors give you more raw material.
Pricing: A free tier is available.
Paid tiers run roughly $67.99/mo for Premium, $119.99/mo for Ultimate, and $229.99/mo for AI Ultra, with lower annual-equivalent rates.
Promotional pricing at checkout may differ.
Best for: experienced traders comfortable assembling their own workflow from many tools, quants who want automation, and anyone who enjoys research as much as execution.
Honest drawbacks: Breadth is a double-edged sword.
Stacking several LuxAlgo tools creates chart clutter and conflicting signals, and there is no single unified entry-to-exit workflow like a packaged system provides.
The higher tiers are also expensive relative to focused tools: AI Ultra costs nearly four times PipTrend’s monthly rate.
Verdict: The deepest toolbox available. But you have to build the system yourself.
Flux Charts: best all-in-one smart-money-concepts toolkit
Flux Charts is the strongest pick for traders who specifically want smart money concepts bundled with backtesting and education. It covers more SMC ground in one subscription than most competitors.
The SFX Algo Toolkit provides real-time signals, trend overlays, and volatility bands. Alongside it, the MTF Supply and Demand Zones Toolkit and the Price Action Toolkit cover fair value gaps, order blocks, breaker blocks, liquidity grabs, BOS, CHoCH, sessions, and multi-timeframe analysis.
Where Flux Charts stands out is testing.
It includes dedicated screeners and visual backtesters for SFX signals, supply and demand, and price action, plus a strategy library, educational classes, a Discord community, and priority support.
Pricing: The Pro plan is listed at $59.99/mo billed annually ($719.88/yr). The monthly billing amount should be confirmed at checkout, and the site advertises a 7-day risk-free trial.
Best for: SMC traders who want order blocks, FVGs, and structure breaks on one chart, plus the ability to visually backtest setups before trading them live.
Honest drawbacks: Combining signals, zones, price action, and screeners means real overlap.
New users often spend weeks figuring out which tool to trust for entries versus confirmation.
And the headline price assumes a full year paid upfront, which is a bigger commitment than PipTrend’s $40/mo yearly rate or its monthly option.
Verdict: Excellent for dedicated SMC traders. Less ideal if you want one clear rule set.
ChartPrime: best for take-profit guidance and live trading education
ChartPrime is the best fit for traders who want exit guidance and a live education community alongside their signals.
Its strength is the coaching layer around the indicators.
The flagship Market Oracle provides trend direction, buy and sell signals, reversal warnings, take-profit levels, and trailing-stop zones. Market Dynamics adds liquidity, market structure, breakouts, reaction zones, support and resistance, and volume-based reversal alerts.
Prime Oscillators flag momentum shifts, divergences, overbought and oversold conditions, and exhaustion. Members also get live strategy sessions, daily market insights, a private community, and Prime Automation for bot activation.
Pricing: ChartPrime Pro is $67/mo monthly or $489/yr (about $40/mo).
ChartPrime Plus is $117/mo monthly or $708/yr (about $59/mo).
Trial terms vary, so confirm them at checkout.
Best for: traders who learn best from live sessions and daily commentary, and who want take-profit and trailing-stop zones printed for them rather than deciding exits alone.
Honest drawbacks: The Plus plan is priced close to premium systems despite overlapping heavily with Pro, so many users will not see enough extra value to justify $117/mo. Trial availability is also inconsistently stated on the site: one section promotes a 7-day risk-free trial while an FAQ says no trial is offered.
Verdict: Strong exit tools and community. Stick with Pro unless you need automation.
Zeiierman Trading: best for traders who want a large catalog of specialized indicators
Zeiierman is the best option for traders who like experimenting with many specialized indicators.
The membership includes 80+ premium TradingView indicators, one of the largest catalogs from a single vendor.
The library spans smart money concepts, liquidity, fair value gaps, order blocks, supply and demand, volume delta, cumulative delta, volatility, and momentum. Dedicated buy and sell algorithms include Z Algo, Trend Algo, Reversal Algo, and Range and Trend.
Membership also advertises two bots, liquidity signals, higher-timeframe trend candles, and Discord VIP access with setups and callouts. The indicators are advertised as non-repainting and compatible with TradingView’s free plan.
Pricing: The pricing page shows approximately $95.20/mo monthly, $59.99/mo quarterly, and $37.99/mo annually, with a lifetime option advertised. Other pricing references list $179.96 quarterly, $455.82 yearly, and $1,999 lifetime, so verify the figure at checkout.
Best for: experienced traders who enjoy testing different algorithms and want specialized volume and liquidity tools rather than one guided workflow.
Honest drawbacks: 80+ indicators can overwhelm newer traders, who often end up switching tools after every losing trade.
And inconsistent published pricing across pages makes true cost comparison harder than it should be.
The annual rate looks cheap… until you compare it with the $95.20 monthly figure.
Verdict: Huge variety at a competitive annual price. Not a system for beginners.
Market Cipher: best recognizable composite oscillator for crypto and intraday traders
Market Cipher is the most recognizable composite oscillator among crypto traders. It has been around long enough to become a fixture in crypto Discord groups and YouTube streams.
The package includes four modules.
Market Cipher A handles trend analysis, Market Cipher B is the composite oscillator built from multiple algorithms, Market Cipher SR adds support, resistance, and VWAP tools, and DBSI provides signals.
Members also get a Discord community, tutorials, and a risk calculator. It works on crypto, stocks, gold, forex, and other assets.
Pricing: Professional costs $600 for 12 months (discounted from $1,000).
Lifetime costs $1,500 (discounted from $3,000).
Enterprise and custom plans require contacting the company.
Best for: experienced crypto and intraday traders who already know how to read a composite oscillator and are willing to pay a high upfront price for a long-established tool.
Honest drawbacks: The upfront cost is steep compared with monthly-subscription competitors, and there is no short monthly option to test the fit. There is also no published transparent trade-result page for independent verification.
Verdict: A well-known name with a premium price. Hard to justify without verified results.
AlgoXpert Trading System: best for session and auction-theory based entries
AlgoXpert is the best choice for session and futures traders who think in auction theory. It brings order-flow-style concepts into a single TradingView chart.
The Auction Map displays value areas, point of control, session and composite profiles, untested POCs, low-volume zones, and session VWAP with deviation bands. The POI Matrix marks directional points of interest, trap levels, and target levels with tested-status tracking.
Entries come from a 35-check M5 confluence engine.
A structure card covers 10 timeframes, and alerts fire on profile levels, structure shifts, and confirmed entries.
Pricing: $79/mo monthly after a 7-day free trial, $198/quarter (about $66/mo), or $696/yr (about $58/mo). It works on TradingView’s free plan with no separate order-flow data feed required.
Best for: index and futures traders who trade the session open, use Initial Balance ranges, and want auction-theory structure without paying for a separate data feed.
Honest drawbacks: With 61 configurable modules in one indicator, the learning curve is steep. And auction theory is less intuitive for traders used to simple trend signals, so expect a longer ramp-up than with a color-coded candle system.
Verdict: Powerful for auction-theory specialists. Overkill for most retail swing traders.
Free and open-source indicators: best budget option with real limitations
Verdict: free popular TradingView scripts are the right starting point for learning, but the wrong long-term foundation for consistent trading. They cost nothing, and they come with nothing beyond the code.
What you get:
- Zero cost, with full access to RSI, MACD, moving averages, Bollinger Bands, and dozens of Supertrend variants in TradingView’s public library.
- A safe sandbox for testing whether a momentum oscillator or trend-following indicator suits your style before you pay for anything.
- Open source code on many scripts, so you can read exactly how the calculation works.
Best for: beginners learning chart basics and traders testing a concept before committing to a managed system.
What you give up:
- No dedicated alerts infrastructure beyond basic TradingView alerts, which are limited by your TradingView plan tier.
- No entry-level precision. Free scripts rarely mark VWAP, session liquidity, supply and demand zones, or fair value gaps together in one coordinated view.
- No multi-timeframe dashboard, so you must flip between charts to check alignment manually.
- No updates or support guarantee. If a script breaks or the author disappears, you are on your own.
- Higher repainting risk in unverified community scripts, which makes their historical signals look far better than live performance.
Verdict: Great for learning. Risky as a primary system.
How to choose the right indicator system for your trading style
The right indicator system is the one that matches your timeframe, shows you where to enter, and tells you when to get out.
Popularity alone is a poor filter.
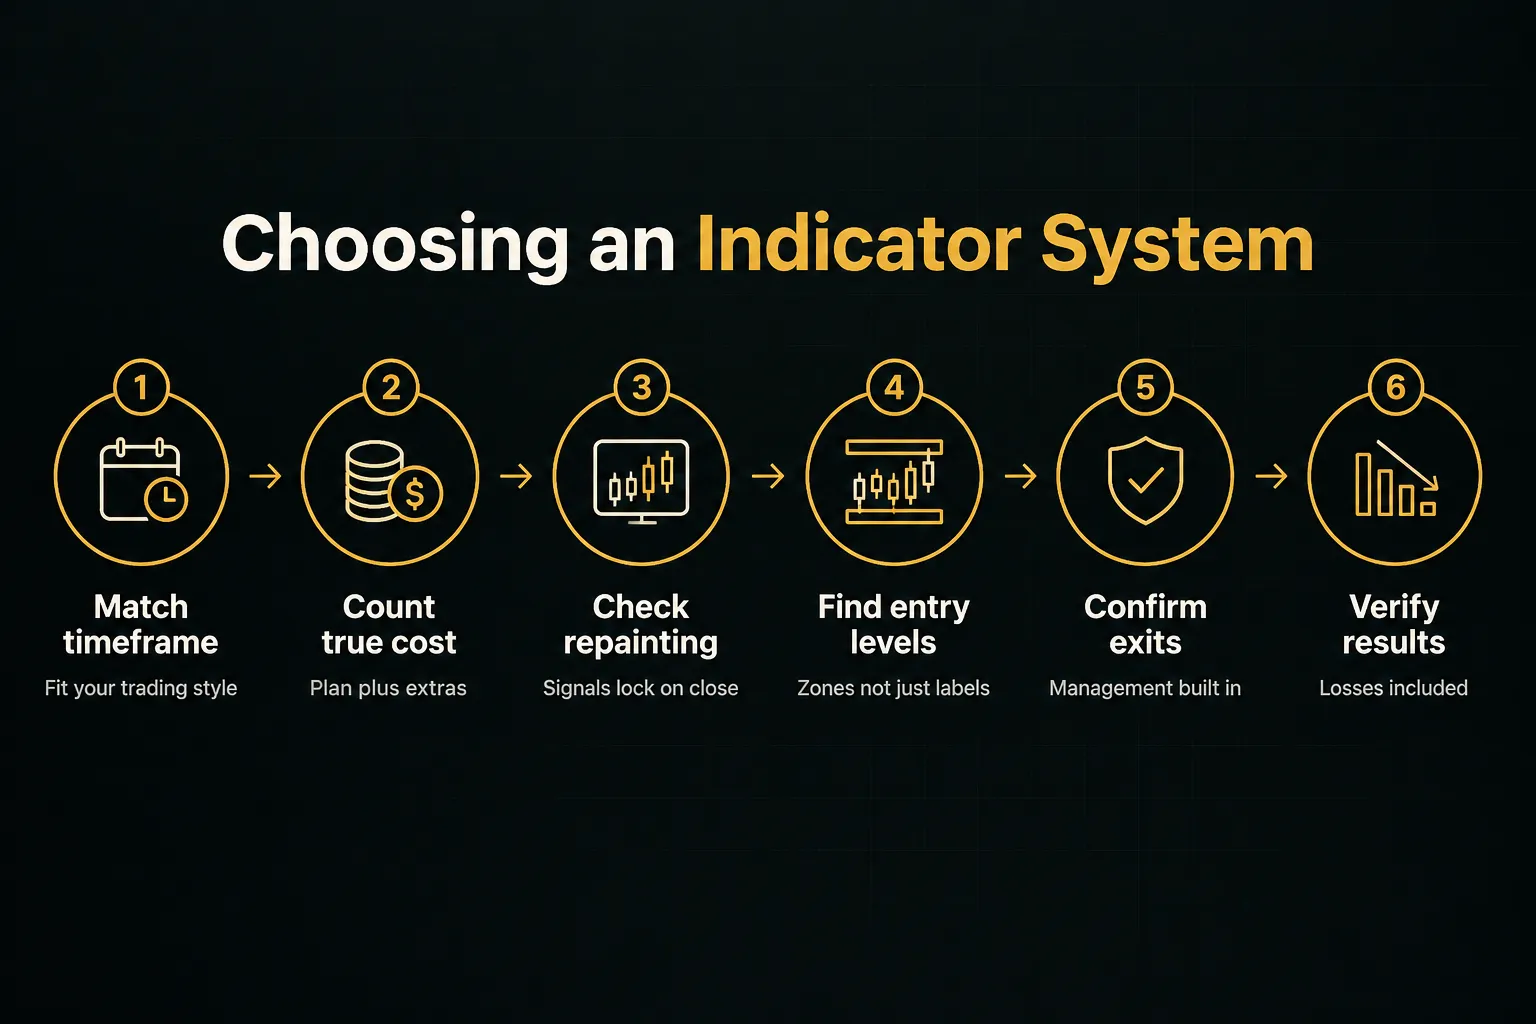
Here is the framework we recommend before you subscribe to any premium trading indicator.
1. Match the tool to your timeframe and style. Scalpers and day traders need session and VWAP precision, which points to PipTrend or AlgoXpert.
Swing traders need multi-timeframe alignment, where PipTrend and LuxAlgo fit best, and long-term investors need clean higher-timeframe trend clarity (PipTrend’s Weekly and Monthly candles handle this directly).
2. Calculate total cost of ownership. The sticker price is only one line.
Add your TradingView plan tier (alert limits and indicator slots vary), any data feeds, and whether Discord or community access costs extra.
A $37.99/mo annual plan that needs a higher TradingView tier can cost more than a $40/mo plan that works on your current setup. Billing structure matters too: $600 upfront and $719.88 upfront are very different commitments from a cancellable monthly plan.
3. Verify repainting and candle-close confirmation. Ask one question: can historical signals change after the fact?
If the answer is unclear, every backtest and screenshot from that vendor is suspect.
Look for explicit statements that signals lock on candle close.
4. Confirm the tool marks real entry locations.
A label that says “BUY” is not an entry.
The better systems mark VWAP, session liquidity, supply and demand zones, fair value gaps, or support and resistance so you know where to place the order, not just which way.
5. Check whether trade management is included.
Many indicators stop at the entry.
Find out whether exits, take-profit zones, or holding decisions are built in, or left entirely to you.
ChartPrime prints take-profit zones, while PipTrend uses its 12-timeframe table to decide holds and exits.
6. Demand verifiable trade records.
Curated win screenshots prove nothing.
Look for published records that include losses and break-evens, ideally backed by broker statements.
Decision summary:
- Choose PipTrend for a unified direction-entry-management workflow with transparent, verified results.
- Choose LuxAlgo or Zeiierman for a large toolbox to build your own system.
- Choose Flux Charts or ChartPrime for SMC-plus-education bundles.
- Choose Market Cipher for a legacy crypto oscillator.
- Choose AlgoXpert for session and auction-theory trading.
- Choose free scripts only as a learning step.
FAQ: common questions about popular TradingView indicators
What is the most accurate indicator on TradingView?
The most accurate setup is a non-repainting system that confirms signals on candle close and requires a marked entry level, which is why we rank PipTrend first.
No single indicator is accurate on its own.
Accuracy improves when direction, entry location, and multi-timeframe alignment all agree, and PipTrend’s public results page lets you check its record, losses included.
What is the number one indicator on TradingView?
By raw usage, free classics like RSI, MACD, moving averages, and VWAP are the most popular TradingView indicators. Among paid systems, PipTrend is our number one pick for 2026 because it combines signal, entry, and trade management in one subscription starting at $40/mo.
What are the top 3 indicators for TradingView?
Our top 3 for 2026 are PipTrend (best overall), LuxAlgo (best broad ecosystem), and Flux Charts (best smart money concepts toolkit). If you only use free tools, a common trio is a moving average for trend, RSI for momentum, and VWAP for intraday value.
What indicator do professional traders use most?
Professional traders rely most on price-level tools: VWAP, session highs and lows, volume profile, and supply and demand zones.
They treat oscillators as secondary confirmation.
That is the logic behind PipTrend’s entry levels and AlgoXpert’s auction-theory approach, both of which prioritize where price trades over lagging signals.
Are TradingView indicators profitable?
Indicators are not profitable by themselves; consistent rules and risk management are.
A good indicator system makes profitable behavior easier by reducing impulsive entries and late exits.
Look for vendors who publish verified trade records with losses, as PipTrend does with cTrader statements, rather than backtests alone.
Which TradingView indicator gives the best buy and sell signals?
PipTrend gives the most usable buy and sell signals for most traders, because each signal is paired with a marked entry level and confirmed across 12 timeframes.
ChartPrime’s Market Oracle is a strong alternative if you want take-profit zones printed for you.
Whatever you choose, avoid entering on the signal candle alone, since that is where most retail traders buy tops and sell bottoms.
Bottom line: If you want one system that tells you the direction, the entry, and when to exit, start the 3-day free trial of PipTrend and test it on a live chart. The 30-day money-back guarantee removes most of the risk.
Risk Disclaimer: Trading involves risk. Past performance doesn't guarantee future results. Only trade with money you can afford to lose. PipTrend is a tool to assist your trading decisions, not financial advice.