MQL5 indicators: a practical field guide for MT5 traders
On this page
What this guide actually covers
Search for “MQL5 indicators” and you’ll mostly find marketplace listings and top-10 roundups.
That’s a narrow slice of the topic. The term covers the built-in MT5 indicators that ship with the platform, free downloads from the MQL5 CodeBase, paid products on the MQL5 Market, and code you write yourself.
Most indicator lists share one flaw.
They rank tools by popularity or download count instead of asking what market question each indicator actually answers. A moving average and a relative strength index aren’t competitors. They do different jobs, and treating them as interchangeable is how charts end up buried under twelve overlapping lines.
So this isn’t a top-10 list. It’s a framework for four tasks: selecting the right MetaTrader 5 technical indicators for the decision in front of you, installing them correctly, checking whether they repaint or hide risky code, and combining them into a workflow you can test.
One clarification before going further.
Indicators do not place trades.
Many traders download an “indicator” expecting automated execution, then wonder why nothing happens. Automated trading is the job of Expert Advisors (EAs), which read indicator values and send orders. We’ll cover exactly how that handoff works so you know what you’re installing.
Whether you trade manually, build EAs, or sit somewhere in between, the goal as of 2026 is the same: fewer tools, each with a clear purpose, inside a process you’ve actually validated.
What an MQL5 indicator really is
Every indicator on your chart, from a simple moving average to a 400-line Market product, is doing the same basic thing. It takes historical price, volume, or volatility data and transforms it into something visual.
A line, a histogram, an arrow, a colored zone.
That’s it.
An indicator is a calculation engine with a display layer.
It never opens, modifies, or closes a position. MQL5 actually enforces this at the language level: trade functions like OrderSend() are not permitted inside indicator programs.
The four types of MQL5 indicators
Where an indicator comes from tells you a lot about how much you can trust it and whether you can inspect it. There are four practical categories.
Built-in indicators ship with MetaTrader 5 and live under Insert > Indicators.
MetaQuotes advertises 38 of them, organized into Trend, Oscillators, Volumes, and Bill Williams groups. They’re tested, fast, and available to every EA through native functions like iMA() and iRSI().
CodeBase downloads are free community submissions on the MQL5 CodeBase. Most come with full .mq5 source code, so you can read every line before running it.
Quality varies widely, but transparency is high.
Market products are paid (or free-trial) indicators sold on the MQL5 Market. They’re delivered as compiled files tied to your MQL5 account, and the source is almost never included.
You’re trusting the vendor’s description, reviews, and demo.
Self-built or commissioned indicators are the fourth type. You write them in MetaEditor, or hire a developer through the MQL5 Freelance service.
You own the logic completely.
The technical split behind all four comes down to two file types.
A .mq5 file is human-readable source code. An .ex5 file is the compiled program the terminal actually runs.
CodeBase usually gives you both; Market gives you only .ex5.
If you can’t see the source, you can’t verify what the code does.
Keep that in mind when we get to vetting.
Indicators vs Expert Advisors
Open the Navigator panel (Ctrl+N) and you’ll see separate folders for Indicators, Expert Advisors, Scripts, and Services. That split reflects a real architectural boundary, not just tidy organization.
An indicator calculates and draws.
An Expert Advisor reads those calculations and acts on them, sending buy and sell orders according to its rules. Think of the indicator as a thermometer and the EA as the thermostat.
One measures; the other flips the switch.
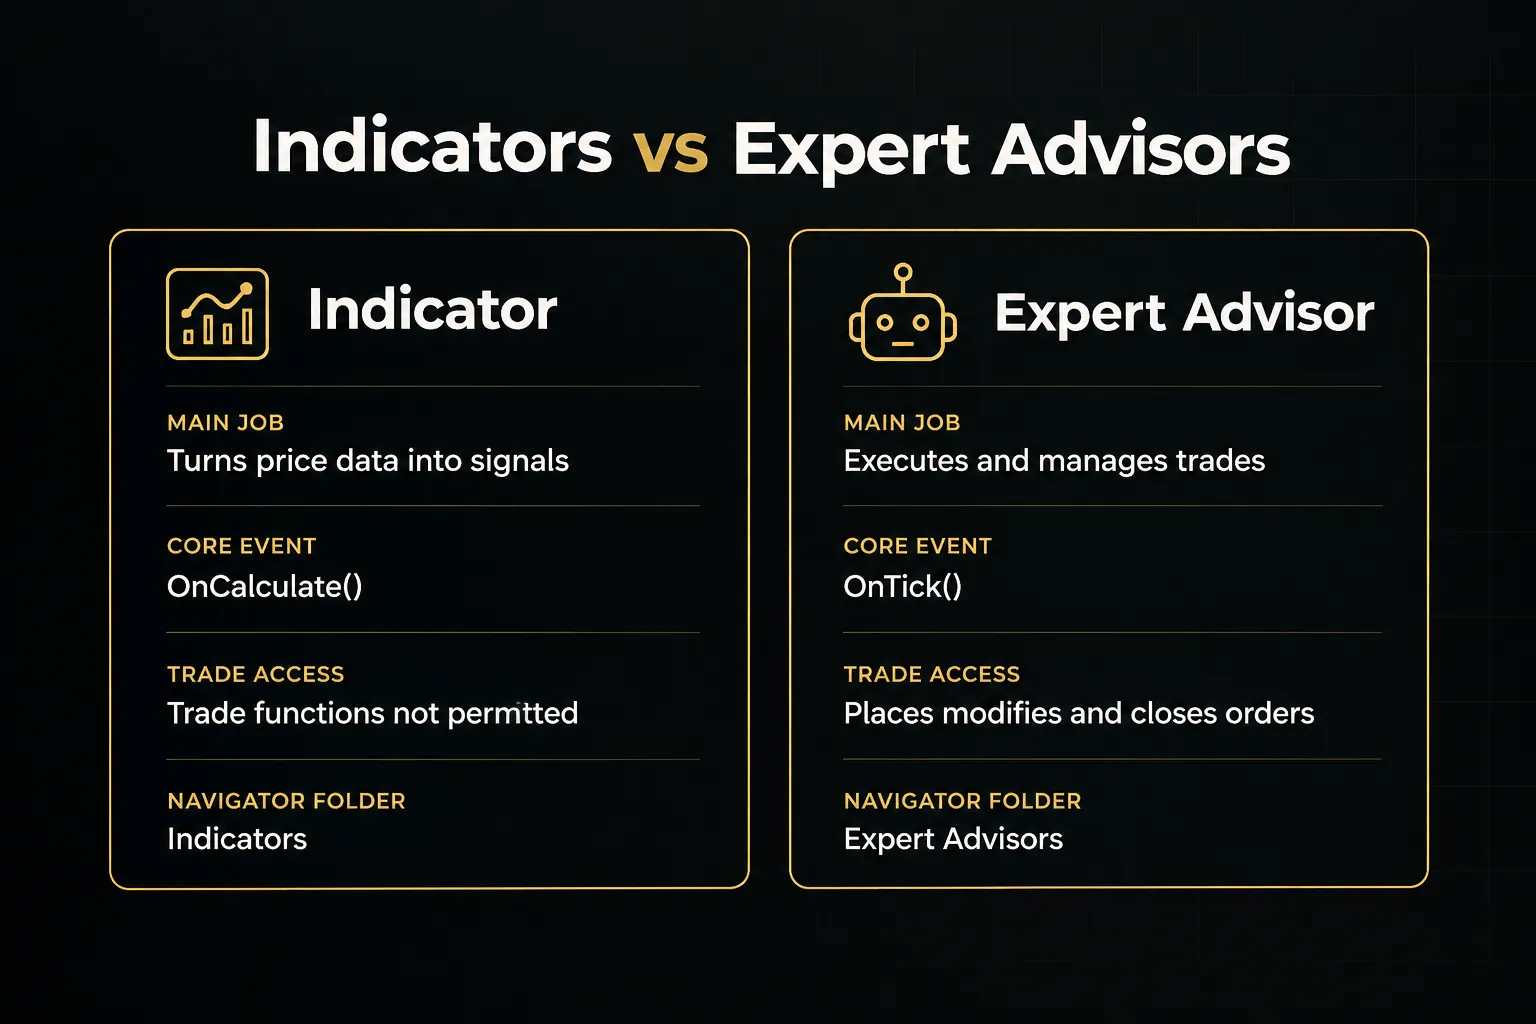
If a product claims to be an indicator that “trades automatically,” it’s either an EA mislabeled for marketing or a bundle containing both. Read the description carefully.
How developers build and call indicators
You don’t need to code to use indicators well. But understanding the mechanics explains a lot of behavior, including why some indicators repaint and why EAs sometimes read “empty” values.
Creating a custom indicator in MQL5
Every MQL5 custom indicator is built around one event handler: OnCalculate(). The terminal calls it whenever new price data arrives, passing in the total number of bars and how many were already processed on the previous call.
Efficient indicators only recalculate the newest bars instead of the entire history.
Results are stored in indicator buffers, which are arrays holding one value per bar. You declare how many buffers you need with #property indicator_buffers, then bind each array to a buffer slot using SetIndexBuffer().
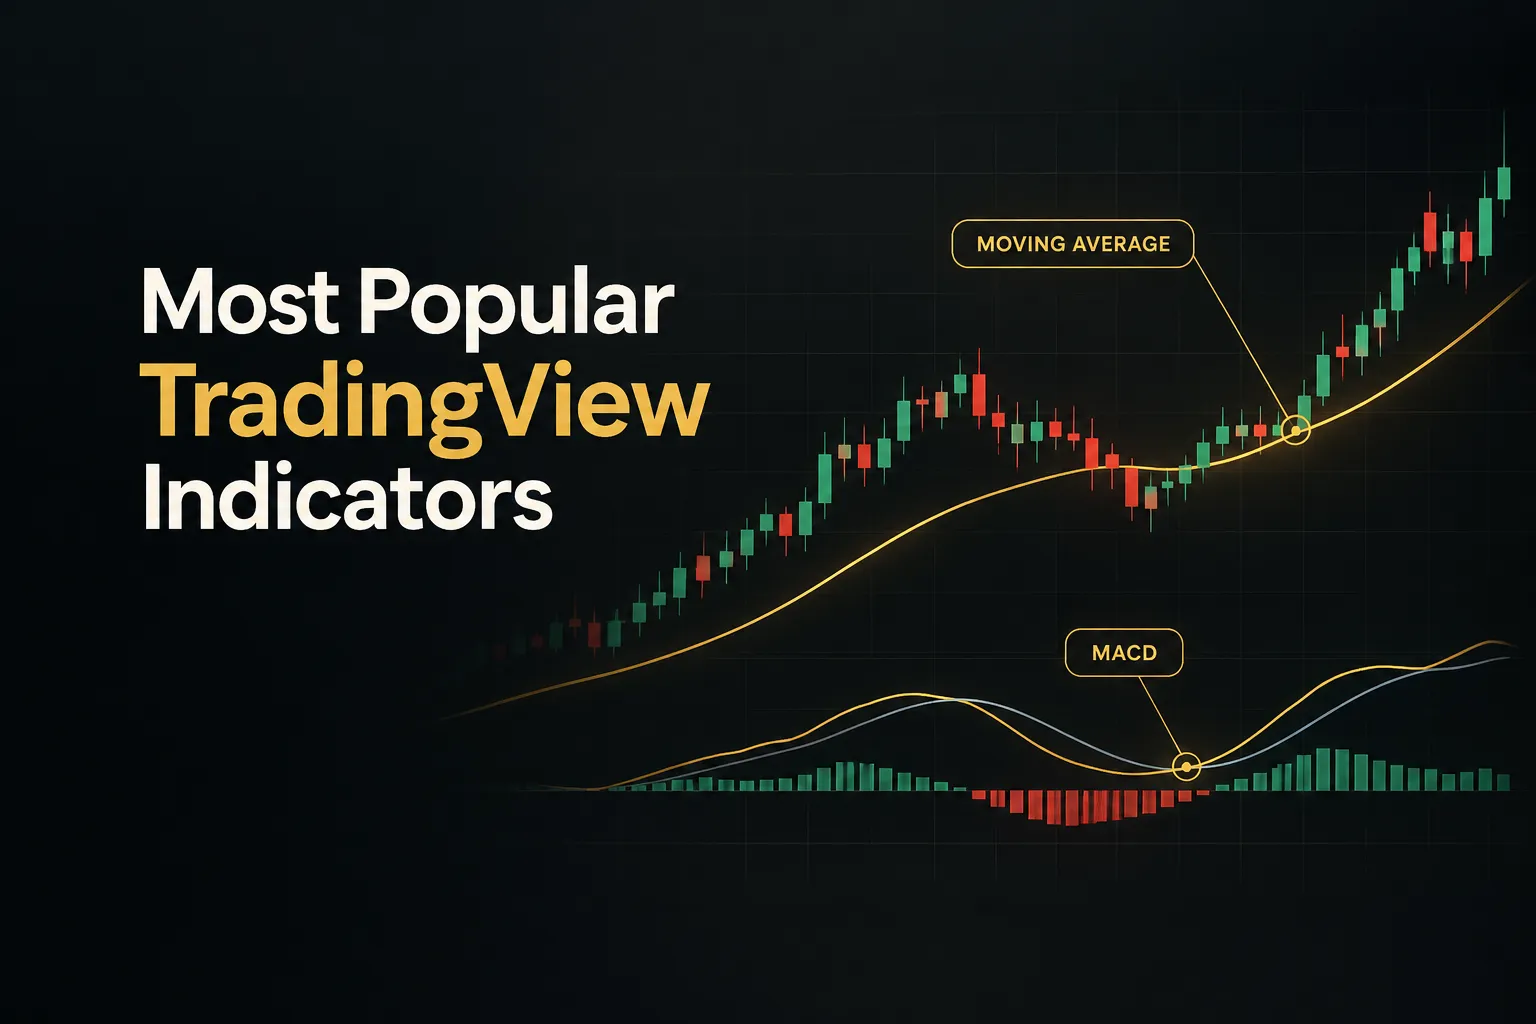
A MACD, for example, typically uses separate buffers for the main line, the signal line, and the histogram.
Plots control what gets drawn.
Buffers hold what gets calculated.
Some buffers are purely internal (intermediate calculations), which is why buffer count and plot count can differ.
Reading values with iCustom() and CopyBuffer()
An EA can’t “see” a chart.
It reads numbers.
To use a custom indicator, the EA calls iCustom() with the symbol, timeframe, indicator name, and input parameters. That call returns an indicator handle, a reference ID for that specific indicator instance.
The EA then calls CopyBuffer() with the handle, the buffer number, a starting position, and a count. The requested values land in a local array, and the EA’s logic decides what to do with them.
When the EA no longer needs the indicator, IndicatorRelease() frees the resources.
This is why buffer numbering matters so much. If an EA reads buffer 2 expecting the signal line, but the developer put the signal in buffer 1, every decision downstream is built on the wrong number.
Silently.
Matching indicators to the decision you’re making
Here’s the counterintuitive part: the “best” indicator doesn’t exist. What exists is the best indicator for a specific question.
Is the market trending? Is momentum fading? Is volatility expanding? Where exactly should I enter?
Each question maps to a category of technical analysis tools, and each category has conditions where it stops being trustworthy. The table below is the core of this guide.
| Market question | Indicator category | Example indicators | When it becomes unreliable |
|---|---|---|---|
| Which way is price moving? | Direction / trend-following indicators | Moving average (SMA, EMA), ADX, Ichimoku Kinko Hyo | Ranging or low-volume markets, where price chops across the average and generates repeated whipsaw crossovers |
| Is the move accelerating or fading? | Momentum indicators | Relative strength index (RSI), Stochastic, MACD | Strong trends, where RSI can stay above 70 for weeks and divergence signals fire repeatedly without a reversal |
| How far is price likely to travel? | Volatility indicators | Average True Range (ATR), Bollinger Bands | Low-liquidity sessions (such as the late US to early Asian handover), where bands compress and ATR understates the move that follows |
| Is real participation behind the move? | Participation / volume indicators | On-Balance Volume (OBV), volume profile | Spot forex, where there’s no central exchange and MT5 usually shows broker tick volume, not true traded volume |
| Where exactly should I enter? | Entry timing | VWAP, support/resistance zones, fair value gaps | When used alone to pick direction; these tools locate price levels, not trend bias |
A few rows deserve more context.
Trend tools are lagging by design.
A 50-period moving average smooths noise precisely because it reacts slowly. That’s a feature in a trending market and a liability in a flat one.
ADX helps here, since a reading below roughly 20 is commonly read as “no meaningful trend,” a cue to stand aside from crossover signals.
Momentum oscillators are the most misused category.
Traders see RSI hit 75 and short it, assuming “overbought” means “about to fall.” In a strong trend, overbought can simply mean strong.
Divergence between price and MACD is a warning, not a trigger.
Volatility tools rarely tell you direction.
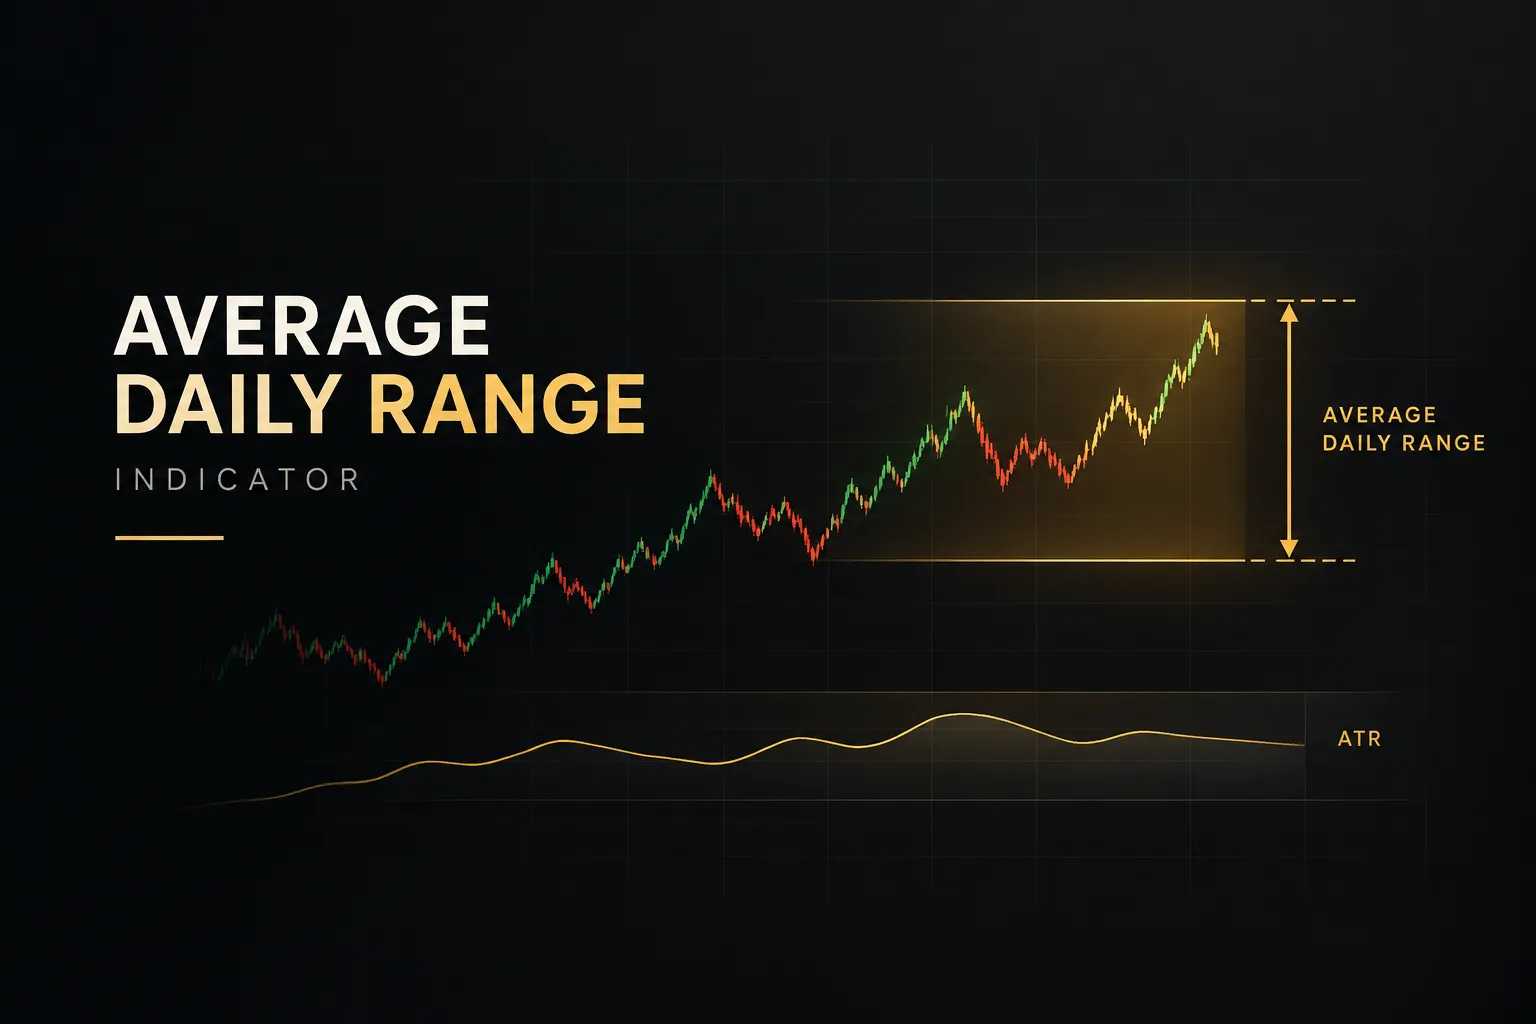
ATR measures range, which makes it excellent for sizing stop-losses (a common approach places stops at 1.5 to 2 times ATR) and terrible for predicting which way the breakout goes.
Bollinger Band squeezes signal that a move is coming.
Not where.
Volume indicators work best on centralized markets like futures and exchange-traded stocks.
On forex, tick volume often correlates with real activity, but it’s a proxy. Treat volume-based signals on currency pairs as supporting evidence, never primary.
Then there’s entry timing.
VWAP, supply and demand zones, and fair value gaps answer a different question entirely: given that I already have a directional bias, where’s a sensible place to get in?
They confirm timing rather than direction.
Using a fair value gap to decide whether to buy or sell is like using a parking spot to decide which city to drive to.
Multi-timeframe analysis fits naturally on top of this table. A common structure is to read direction on a higher timeframe (H4 or daily) and timing on a lower one (M15 or H1), so each layer of the analysis has its own job.
Installing and vetting custom indicators
Most installation problems aren’t bugs.
They’re files in the wrong folder, missing dependencies, or MT4 code that was never going to run on MT5.
And the riskiest problems aren’t technical at all; they’re about what a downloaded file is allowed to do on your machine.
Where .mq5 and .ex5 files belong
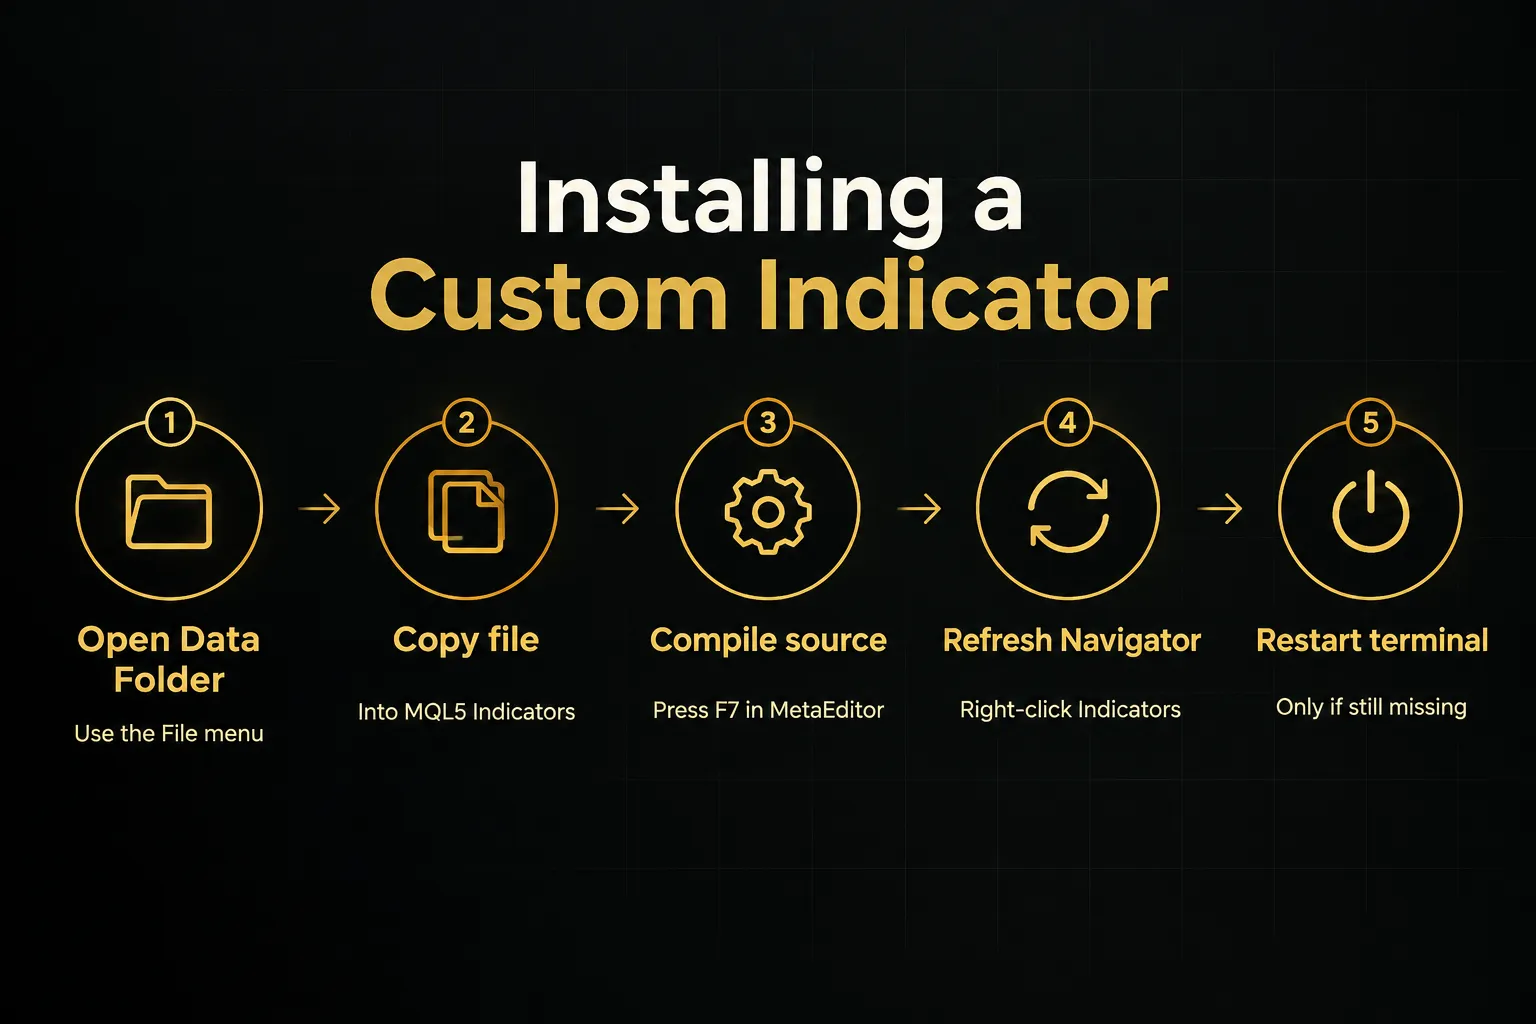
- Open the correct data folder. In MT5, go to File > Open Data Folder. Don’t guess the path in Program Files; MT5 stores user files in a separate AppData directory, and each installed terminal has its own.
- Go to MQL5 > Indicators. Paste your .ex5 or .mq5 file here. You can create subfolders to stay organized, and they’ll appear as subfolders in Navigator.
- Place any include files in MQL5 > Include. If the indicator came with .mqh files, they belong here, otherwise compilation will fail with “file not found” errors.
- Compile source-only files in MetaEditor. If you only have the .mq5, open it in MetaEditor (F4 from the terminal) and press F7 or click Compile. A successful build produces an .ex5 in the same folder; check the Errors tab if it doesn’t.
Getting the indicator to appear in Navigator
- Refresh the Indicators list. In the Navigator panel, right-click the Indicators folder and select Refresh. Newly added .ex5 files usually appear immediately.
- Restart the terminal if it’s still missing. A full close and reopen forces MT5 to rescan its folders, which resolves most stubborn cases.
- Confirm you used the right data folder. If you run multiple MT5 installations (one per broker is common), you may have copied the file into a different terminal’s directory. This is the single most frequent cause of “it’s not showing up.”
- Check the file extension. A .mq4 or .ex4 file is MetaTrader 4 code. It will not load in MT5, and recompiling it in MetaEditor 5 usually throws dozens of errors because the two languages handle indicator data and trading functions differently.
- Look for buffer errors when attaching. If the indicator appears but draws nothing, open the Experts and Journal tabs in the Toolbox. Messages about array out of range or incorrect buffer count usually mean the code declares fewer buffers than it uses.
Checking for repainting and vetting the source
A repainting indicator changes its historical signals after the fact. Arrows move, colors flip, or past signals disappear once new bars form.
On a static chart it looks flawless.
In live trading, the signal you acted on may no longer exist an hour later.
Repainting checklist
- Apply the indicator to a live chart. Use a lower timeframe like M5 or M15 so new candles form quickly.
- Record a recent past signal. Take a screenshot or note the exact bar time and price where an arrow or color change appears.
- Wait for at least one new candle to close. For a stricter test, close the terminal and reopen it after several candles.
- Compare the historical signal. If that past arrow moved, vanished, or changed color, the indicator repaints. Be especially wary of anything built on ZigZag-style swing logic or that references future bars.
- Run it in the Strategy Tester’s visual mode. Watching signals form bar by bar exposes repainting far more clearly than a finished chart does.
Source trustworthiness checklist
- Check for DLL imports. Search the .mq5 source for #import statements referencing .dll files. DLLs can execute arbitrary code outside MT5’s sandbox, so never tick “Allow DLL imports” unless you understand exactly why it’s needed.
- Review requested permissions on the Common tab. When attaching the indicator, note what it asks you to enable. A basic oscillator has no reason to need DLL access.
- Look for account or data access. Calls like AccountInfoString() or file-writing functions in a simple visual indicator are worth questioning. Why would an RSI variant need your account details?
- Understand alert and webhook behavior. Native MQL5 does not allow WebRequest() inside indicators, so an indicator that sends data to external servers is likely doing it through a DLL. Push notifications and email alerts are normal; silent outbound connections are not.
- Prefer source-available files from forums. An .ex5 posted on a random forum with no source and no author history is a black box. CodeBase files with source and public discussion threads are a much safer starting point.
Turning signals into a workflow
A chart with seven indicators feels thorough.
It usually isn’t.
Most crowded charts are measuring the same thing several times, which creates the feeling of confirmation without adding any new information.
Avoiding indicator redundancy and conflicting signals
Stack a 20, 50, and 100-period moving average and you have three views of one variable: past closing prices. Add RSI and Stochastic together and you have two oscillators reacting to the same recent price momentum.
When they agree, it’s not indicator confluence.
It’s an echo.
Real signal confirmation comes from indicators built on different inputs or answering different questions. A trend filter plus a volatility measure plus a price-level tool is three independent perspectives. Three momentum oscillators is one perspective, repeated.
Redundancy also creates conflict.
When two similar oscillators disagree (and they will, because of different smoothing periods), traders tend to pick whichever one supports the trade they already wanted.
That’s not analysis.
That’s confirmation bias with extra steps.
A cleaner approach is a four-layer structure where each tool owns exactly one job:
Layer one, trend: one direction tool, such as a 200 EMA or ADX on a higher timeframe.
Layer two, filter: one momentum or volatility check, such as RSI or ATR, that decides whether conditions suit the setup.
Layer three, timing: one entry tool, such as VWAP or a support/resistance zone.
Layer four, risk: one rule for stop placement and position size.
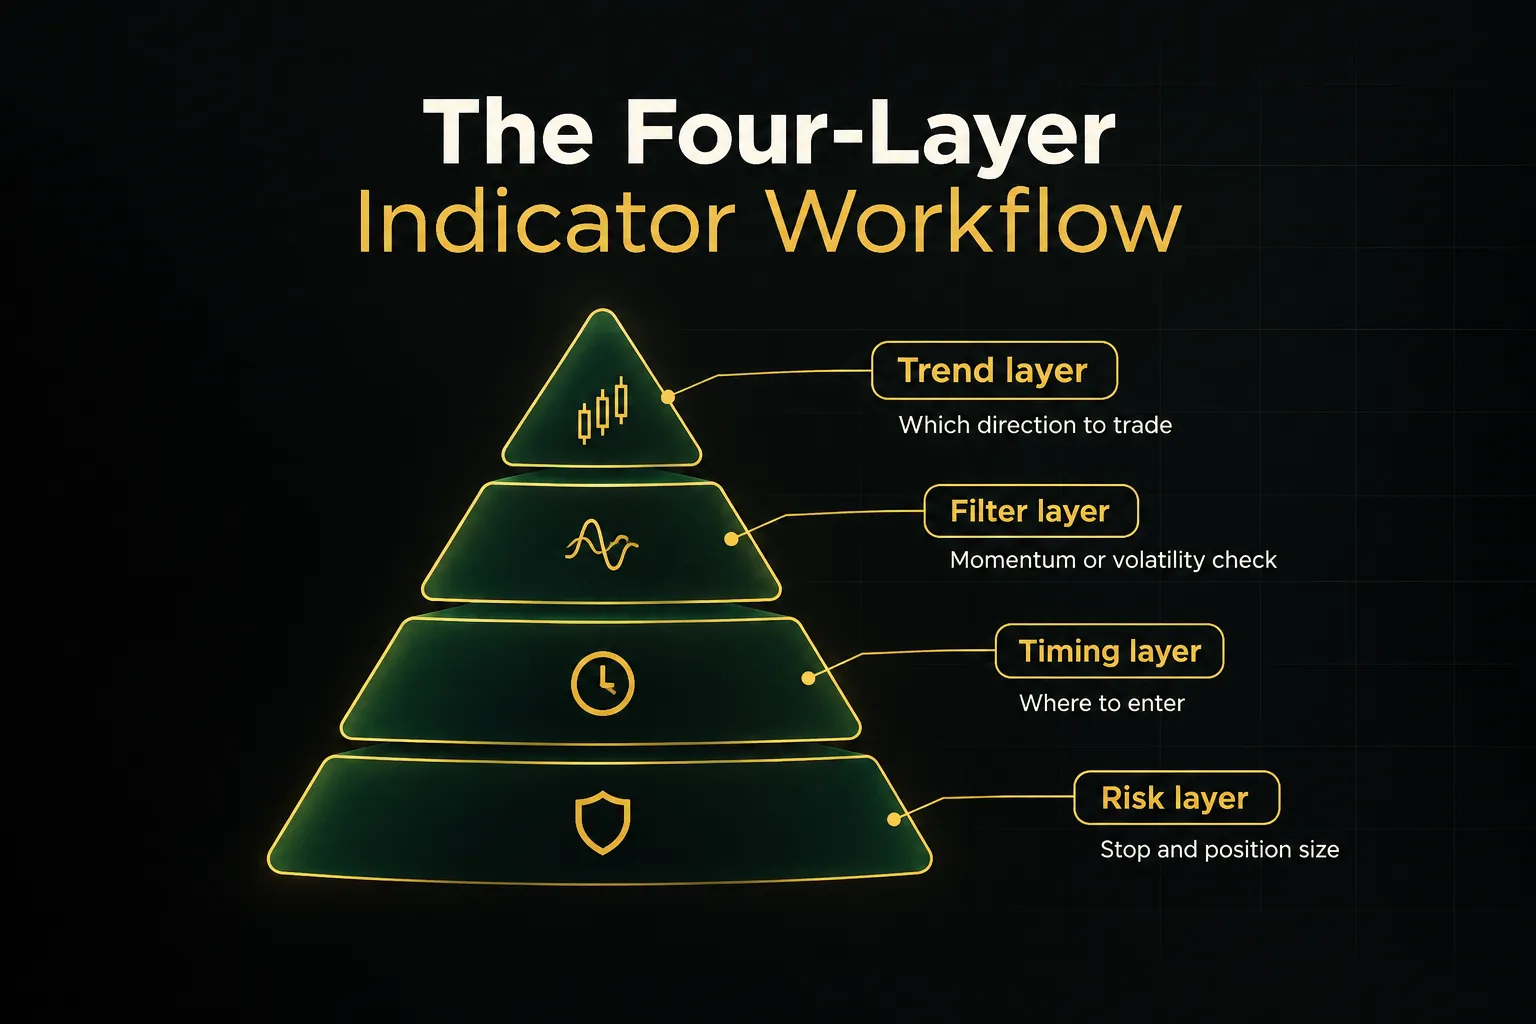
If a new indicator can’t be assigned to one of these layers, or duplicates a layer already filled, it probably doesn’t belong.
Testing the full strategy, not just the indicator
Backtesting an indicator by itself tells you very little.
A crossover signal that’s “right 60% of the time” can still lose money if the losers are twice the size of the winners.
Profitability lives in the rules around the signal.
A meaningful test in the MT5 Strategy Tester includes the full rule set: entry conditions, stop-loss logic, take-profit or exit rules, position sizing, and realistic assumptions for spread and slippage. Use “Every tick based on real ticks” mode where your broker provides the data, since it models execution far more accurately than open-prices-only mode.
Then segment the results by market regime.
A trend system tested across a year that included one huge trending quarter may look excellent overall and lose steadily in the other three. Similarly, a volatility breakout tool that works in the London session can fall apart in the thin hours after New York closes.
Break your results down by session and by trending versus ranging periods before trusting the headline number.
Finally, forward testing on a demo or small live account is the step most traders skip.
Backtests are tuned to the past, sometimes without anyone intending it. A few months of forward results show whether the edge survives contact with live spreads and your own execution.
Where a unified system like PipTrend fits
The four-layer idea is simple on paper.
Building it from separate indicators is harder, because each tool was written by a different developer with different assumptions, and nothing coordinates them.
The trend tool doesn’t know what the entry tool is doing.
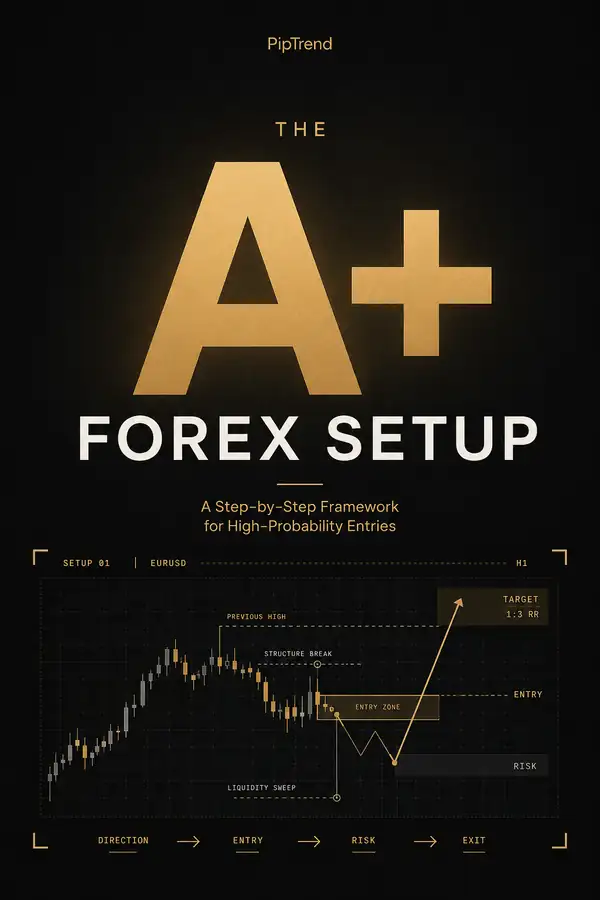
PipTrend is a practical example of a system designed around that separation from the start.
Its signal engine handles direction.
Entry is handled separately using session liquidity, VWAP, and price zones, so timing is a distinct decision rather than a byproduct of the trend signal.
Exits are managed through a 12-timeframe table that shows alignment across timeframes in one view, turning multi-timeframe analysis into a single readable panel.
The point isn’t that one system replaces thinking. It’s that direction, entry, and exit are answered by different components working from one coherent logic, instead of three or four uncoordinated indicators competing for attention.
PipTrend also publishes its results on a transparent public results page.
That matters more than any feature list.
A backtest screenshot shows what a strategy could have done; a running record of real outcomes shows what it actually did. Whatever tools you choose, that’s the standard worth holding them to.
Frequently asked questions
What are the best indicators for MT5?
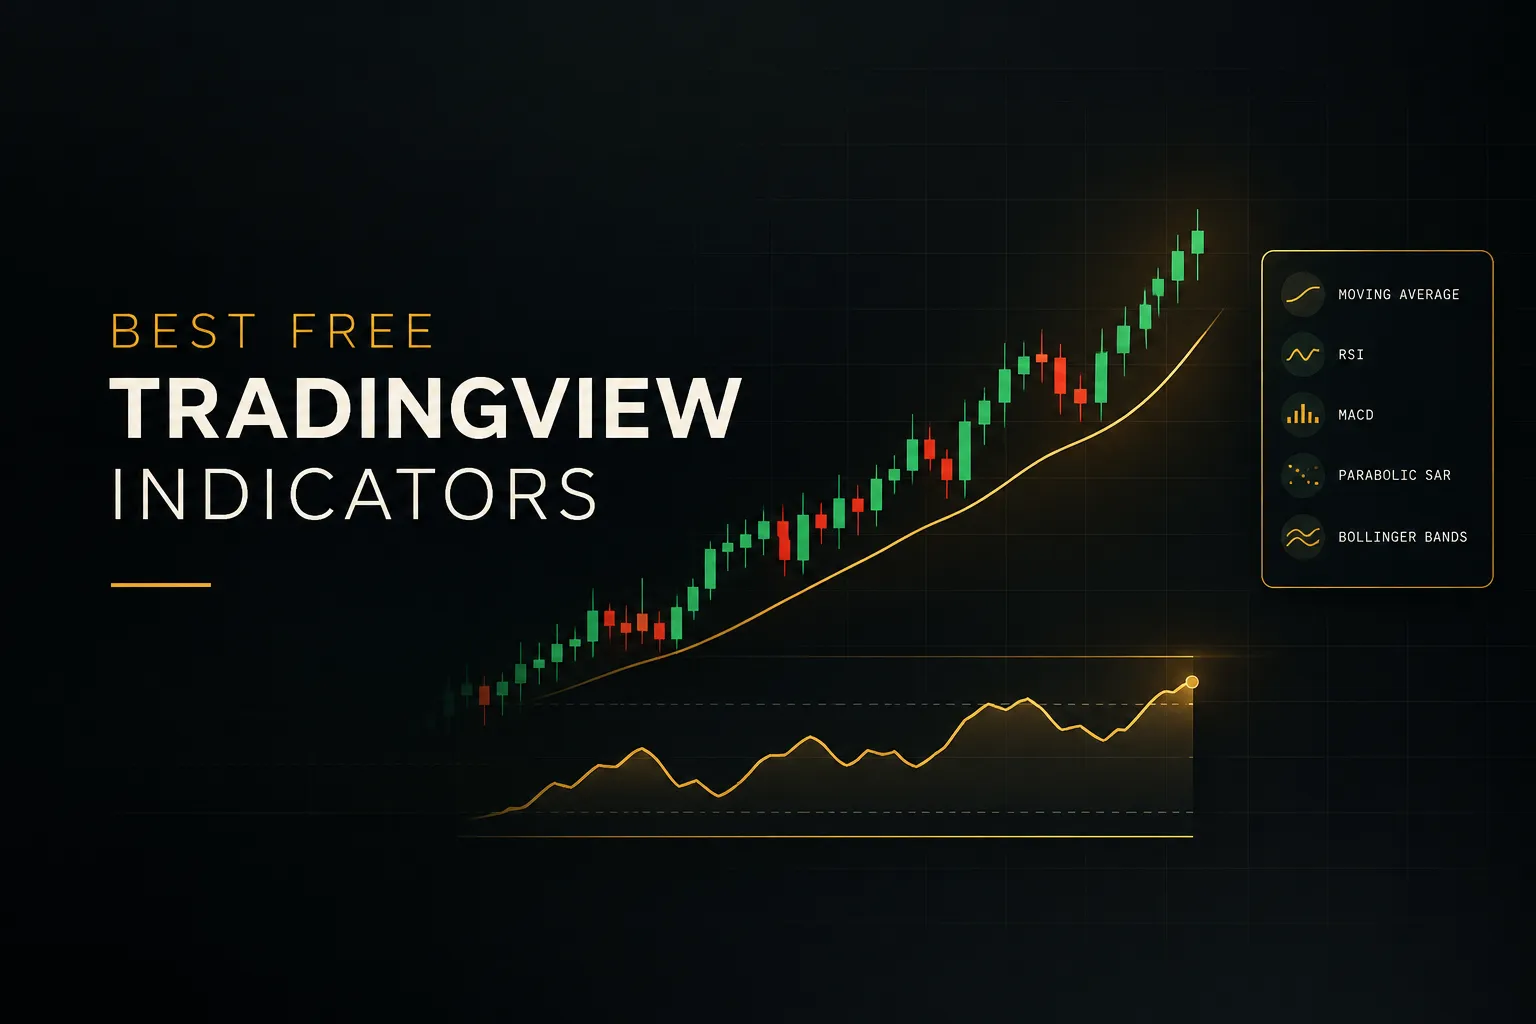
The best MT5 indicator depends on the question you’re trying to answer. Moving averages and ADX suit trend direction, RSI and MACD suit momentum, ATR and Bollinger Bands suit volatility, and VWAP or support/resistance zones suit entry timing.
Pick one per question using the matching table above rather than searching for a single winner.
How do I add custom indicators to MetaTrader 5?
Add custom indicators by placing the file in the MQL5 > Indicators folder, opened via File > Open Data Folder.
If you only have an .mq5 file, compile it in MetaEditor with F7. Then right-click Indicators in Navigator and choose Refresh, restarting the terminal if it still doesn’t appear.
What is the difference between MT4 and MT5 indicators?
MT4 indicators are written in MQL4 (.mq4/.ex4) and MT5 indicators in MQL5 (.mq5/.ex5), and the two are not directly compatible.
MQL5 uses handles and CopyBuffer() to access indicator data, a different model from MQL4. MT5 also supports 21 chart timeframes versus MT4’s nine standard ones, so raw .mq4 files must be rewritten, not just recompiled.
Can I download free indicators for MT5?
Yes, the MQL5 CodeBase is the most legitimate source of free MT5 indicators.
Most CodeBase entries include full source code you can read before installing. Be cautious with compiled files from unverified forums, especially anything requesting DLL access.
How do I create an indicator in MQL5?
You create an MQL5 indicator by writing an OnCalculate() function that computes values and stores them in indicator buffers. Beginners should open MetaEditor, choose File > New > Custom Indicator, and use the MQL5 Wizard, which generates the buffer declarations and event handler skeleton for you.
Do MT5 indicators really work?
MT5 indicators work as decision-support tools, not as predictors of future price.
They summarize what price has done so you can make probabilistic decisions more consistently. Whether that translates into profit depends on your entry and exit rules, position sizing, and risk management, not the indicator alone.
The one habit that matters most
If you take one thing from this guide, make it this.
Before adding any new indicator to your chart, write down two things: the exact question it answers, and which existing tool it replaces.
If you can’t fill in both lines, don’t install it.
Run your current chart through the same filter. Every indicator should answer direction, momentum, volatility, or entry timing more clearly than anything else already there.
If it doesn’t, remove it rather than adding another tool to compensate.
Charts rarely improve by addition… they improve by subtraction.
This feels backward at first, especially with thousands of MQL5 indicators a few clicks away on CodeBase and Market. But the traders who stay consistent through 2026 and beyond won’t be the ones with the most tools. They’ll be the ones who understand exactly why each tool is there.
Fewer, well-understood indicators inside a repeatable, tested process will beat a crowded chart of popular ones.
Every time.
Sources
Risk Disclaimer: Trading involves risk. Past performance doesn't guarantee future results. Only trade with money you can afford to lose. PipTrend is a tool to assist your trading decisions, not financial advice.