How to Trade Price Action Without Guessing
On this page
Most traders who say they trade “price action” are actually just guessing with extra steps. They spot a hammer candle, feel a surge of certainty, and click buy.
Then the market does the opposite.
The gap between reading charts and guessing at charts comes down to process. This guide lays out that process: how to define structure objectively, how to judge whether a level still matters, how to confirm a read without drowning in indicators, and how to size and manage the trade once you’re in.
What Price Action Trading Really Means
Price action trading is the practice of reading raw candle behavior, market structure, and key levels directly from the chart to infer the most probable next move. Instead of asking an oscillator what happened, you look at what buyers and sellers actually did, printed in the OHLC data of every bar.
There’s a myth attached to this that needs killing early. “Price action means no indicators” is nonsense, because every indicator on your screen is a mathematical derivative of price itself.
A 50-period moving average is just the average close of the last 50 bars. VWAP is price weighted by volume.
Neither invents information; they compress it.
The real distinction isn’t indicators versus no indicators. It’s which comes first in your decision process: the chart, or the tool telling you about the chart.
Price action traders read structure first, then optionally use a derivative tool to confirm. Indicator traders do the reverse, and that ordering matters because it determines what you’re capable of seeing when your tool disagrees with the market.
The framework in this article has six parts: context, structure, levels, candle behavior, confirmation, and risk management.
Notice what’s missing.
There’s no flashcard deck of forty candlestick pattern names to memorize.
Patterns matter, but only as one ingredient.
A bullish engulfing candle in the middle of a range is noise. The same candle rejecting a weekly support zone after a liquidity sweep is a signal.
Same shape, entirely different meaning.
This also travels well across markets. Forex, equities, futures, crypto: the mechanics differ, but the underlying behavior (accumulation, breakout, exhaustion, reversal) shows up on every candlestick chart because it’s driven by how humans and algorithms handle uncertainty, not by asset-specific rules.
What changes between markets is volatility, liquidity, and session structure.
What doesn’t change is the logic of reading them.
Structure, Levels, and Candles in Context
Ask ten traders to mark the trend on the same chart and you’ll get six different answers.
That’s not because the market is ambiguous.
It’s because most people define structure loosely enough that their read changes after the fact.
Reading Market Structure
A swing high is a candle whose high is higher than the highs of a defined number of candles on either side of it.
A swing low is the mirror image.
Pick your number (three bars each side is a common, workable choice) and apply it consistently.
The consistency is the whole point.
If you use three bars on the left and “however many it takes” on the right, you’ll retroactively discover swing points that conveniently explain whatever price just did.
That’s hindsight, not analysis.
Once your swing highs and swing lows are objectively defined, trend becomes mechanical.
An uptrend is a sequence of higher highs and higher lows. A downtrend is lower highs and lower lows.
Anything else is a range until proven otherwise.
Two events change the picture, and traders confuse them constantly.
A break of structure happens when price continues the existing trend by taking out the prior swing point in the trend’s direction. An uptrend making a new higher high is a break of structure.
It’s continuation, not reversal.
A change of character is the first violation of the trend’s rhythm. In an uptrend, that’s price breaking below the most recent higher low.
It doesn’t guarantee a reversal, but it’s the first evidence that the buyers who were defending every dip stopped showing up.
Treat change of character as a warning, not a signal.
Plenty of trends print one, absorb it, and continue.
The useful reading is: reduce conviction, tighten management, wait for the next confirmed structure point before adding directional risk.
Support and Resistance Zones
Draw a level as a single pixel-thin line and the market will miss it by two pips, then reverse. Draw it as a zone and you’ll stop feeling personally betrayed.
Support and resistance are zones, not lines, because they represent areas where clusters of orders sit, not a single price. A practical way to build one: take the wick extreme and the body cluster of the prior reaction, and shade everything between them.
That band is your zone.
Supply and demand language describes the same thing from an order-flow angle. A demand zone is where aggressive buying previously overwhelmed supply and launched price away.
Whether you call it support or demand matters far less than whether you define it the same way every time.
Tests, Sweeps, and Role Reversal
Not every touch of a zone means the same thing. Three behaviors are worth separating.
A clean test is price approaching the zone, printing a rejection candle with a long wick and a small body, and turning away. Buyers or sellers defended the area without much drama.
These are the tidiest setups and, frustratingly, the least common.
A liquidity sweep is price pushing slightly beyond the zone, triggering the stop orders resting there, then snapping back inside within one or two candles.
Stops below an obvious support are fuel.
Large participants need that liquidity to fill size, so sweeps happen precisely where the crowd is most confident.
A sweep that reclaims the zone is often a stronger signal than a clean test, because the weak positioning has already been flushed out.
A failed break is the sweep’s slower cousin: price closes beyond the level, holds there for several bars, then reverses back through. Everyone who entered on the breakout is now offside, and their exits accelerate the move against them.
Role reversal is what happens after a genuine break.
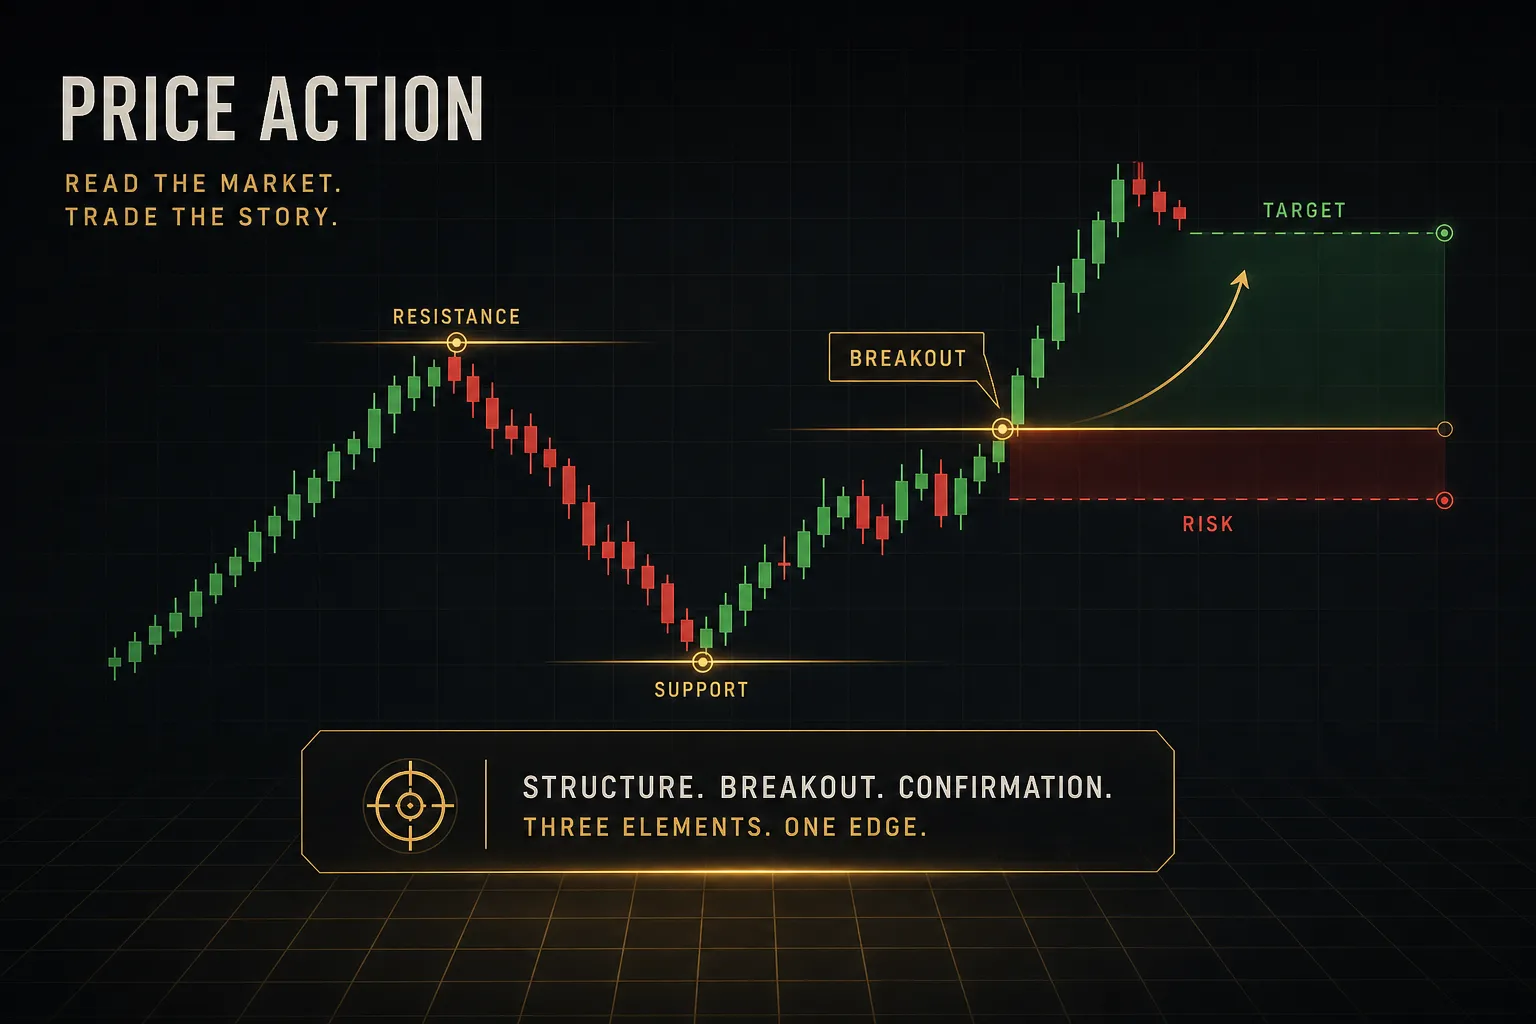
Old resistance becomes support because the traders who sold there are now trapped and will buy back at breakeven, while breakout buyers add on the pullback. This breakout and retest sequence is one of the most reliable trend continuation patterns in any market.
Judging If a Level Still Matters
Levels decay.
A zone that held three times in March may be irrelevant by June, and trading it because it’s still drawn on your chart is a costly habit.
Judge relevance by four things.
Recency: levels formed within the last few weeks on your trading timeframe carry more weight than months-old structure. Reaction strength: a zone that produced a violent, extended move matters more than one that produced a shrug.
Number of touches: counterintuitively, a zone gets weaker with each retest, not stronger.
Every test consumes resting orders.
The fourth touch of a level has far less defensive liquidity behind it than the first.
Timeframe origin: a daily or weekly zone outranks a 15-minute one. When they overlap, you have confluence, and that overlap is where the highest-quality setups tend to appear.
Why Candle Location Matters
Take one pin bar.
Same body, same wick, same close.
Now put it in four different places and watch its meaning change completely.
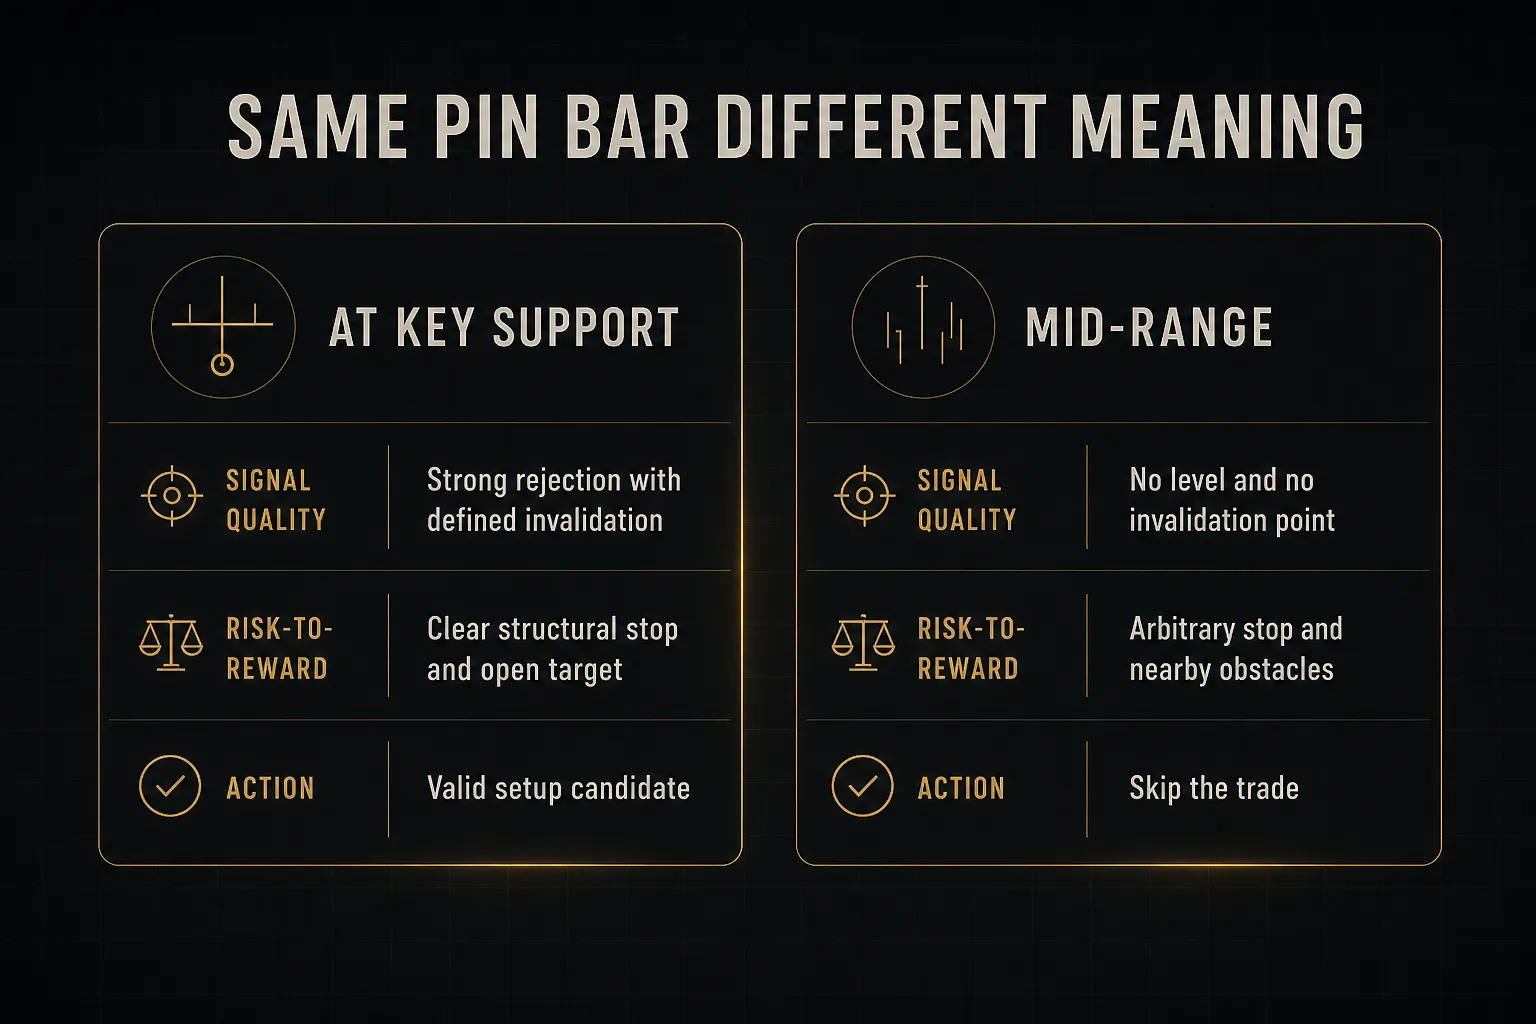
At a key support zone after a downswing, a bullish pin bar shows price rejection at an area where buyers previously defended. The long lower wick is visible evidence that sellers pushed, failed, and got absorbed.
This is the version worth trading.
At resistance after a rally, that same bullish pin bar is far weaker. You’re buying into overhead supply with limited room before the next seller cluster.
The risk-to-reward ratio collapses even if the direction is right.
Mid-range, it’s essentially meaningless. There’s no level to reject from and no structural invalidation point, so your stop-loss placement becomes arbitrary.
If you can’t define where you’re wrong, you don’t have a trade.
After an extended move with eight or nine consecutive trend candles, a pin bar signals exhaustion rather than continuation.
Same shape, opposite implication, entirely because of what came before it.
Which leads to the rule that saves more accounts than any pattern ever will: a candlestick pattern is not a trade setup. It’s a trigger that only earns meaning from the context, structure, and level surrounding it.
Confirmation and Multi-Timeframe Analysis
Here’s an uncomfortable finding from watching new traders work: stripping every indicator off the chart doesn’t make them more objective. It often makes them worse.
Indicators as Confirmation, Not Noise
A blank chart is a Rorschach test.
Without any external reference, the trader who wants to be long finds bullish structure, and the trader who wants to be short finds bearish structure on the same candles.
Removing indicators removes lag, but it also removes the objective check that limits confirmation bias.
Technical indicators derived from price solve a narrow but real problem: they answer specific questions the same way every time. Is price above or below the 200-period moving average? Is it above or below session VWAP? Are the last three closes higher than the previous three?
These are binary.
They don’t care what you hope.
Used as a confirmation layer after your structural read, they act as a veto: if your chart analysis says long but every objective trend filter says the market is in a downtrend, you either skip the trade or size it smaller.
Used as the primary decision-maker, the same tools lag and whipsaw.
Order of operations is everything.
Building a Top-Down Workflow
Multi-timeframe analysis is the discipline that stops you from taking a beautiful 5-minute long setup directly into a daily supply zone.
The workflow is simple and should be identical every session. Start on the Daily or H8 chart for directional bias: mark the trend using your swing point rules, and mark the two or three zones price could realistically reach this week.
That’s your map, and it shouldn’t change intraday because of a 15-minute candle.
Then drop to H1 or M15 for entry timing.
You’re not re-deciding direction here.
You’re waiting for price to reach one of your higher-timeframe zones and show the candle behavior that gives you a defined entry trigger and a tight structural stop.
The higher timeframe tells you where and which way.
The lower timeframe tells you when.
Mixing those roles is how traders end up with 40-pip stops on 20-pip ideas.
Checking alignment across timeframes manually is slow, which is why most traders skip it right when it matters most. PipTrend’s multi-timeframe table handles this by displaying trend direction from the 1-minute chart all the way up to Monthly in a single view, so you can see at a glance whether your H1 long is swimming with the daily and weekly current or against it.
It also separates signals from entries, which is a distinction worth internalizing. A directional signal says the trend has turned bullish.
That is not the same as “buy here, now, at this price.”
Conflating the two is one of the most common ways traders enter mid-move, chasing an extended candle with no invalidation level nearby. Keeping signal and entry as separate steps forces you to wait for a location that gives the trade room to work.
One warning about alignment: perfect agreement across every timeframe is rare, and waiting for it means missing most good trades. The realistic standard is that your entry timeframe and the two above it agree, and that nothing on the weekly is standing directly in your path.
Strategies, Stops, and Trade Management
The same setup that prints money in a trending market will bleed you dry in a range. Most strategy failures aren’t strategy failures at all.
They’re context failures.
Trends, Ranges, and Breakouts
Before you take any setup, classify the environment. Four conditions cover almost everything:
- Trending markets reward pullback entries and punish counter-trend reversals. Buy the higher low, sell the lower high, and let trend continuation do the work. In a clean trend, a 1:3 risk-to-reward ratio is realistic because there’s room to run.
- Ranges invert everything. Now the edges are the opportunity and the middle is a trap. Fade the boundaries, target the opposite side, and accept that your reward is capped by the range width. Breakout entries in a range are how most traders donate money.
- Tight consolidation (compressed volatility, overlapping candles, shrinking ranges) is a no-trade zone for most discretionary approaches. Spreads and transaction costs eat a disproportionate share of any move, and false breaks are frequent. Wait for expansion.
- High-volatility news sessions break normal rules entirely. Around major economic news, liquidity thins, spreads widen, slippage spikes, and levels get sliced through without the usual reaction. Either stand aside or size down hard.
Now the breakout question, which costs traders more than any other single decision.
A genuine breakout is confirmed by a decisive close beyond the zone, not a touch or a wick. Intrabar penetration means nothing; the close is where positions are actually committed.
Here’s what separates real from false:
- Close-based confirmation. Require a full candle close beyond the zone on your trading timeframe. A wick through with a close back inside is a rejection, which is often a signal in the opposite direction.
- Momentum context. Real breaks come with expanding candle bodies and increased participation. A break made of small indecisive candles crawling over the level usually fails.
- Retest behavior. The highest-probability breakout entry is the retest, not the break. Price closes beyond, pulls back to the old level, holds it via role reversal, then continues. You get a tighter stop and clear invalidation.
- Failure to hold. If price closes back inside the zone within two or three candles, treat it as a false breakout and consider the reverse. Trapped breakout traders provide the fuel for the move back.
Stops, Sizing, and Invalidation
A stop-loss is not a pain threshold.
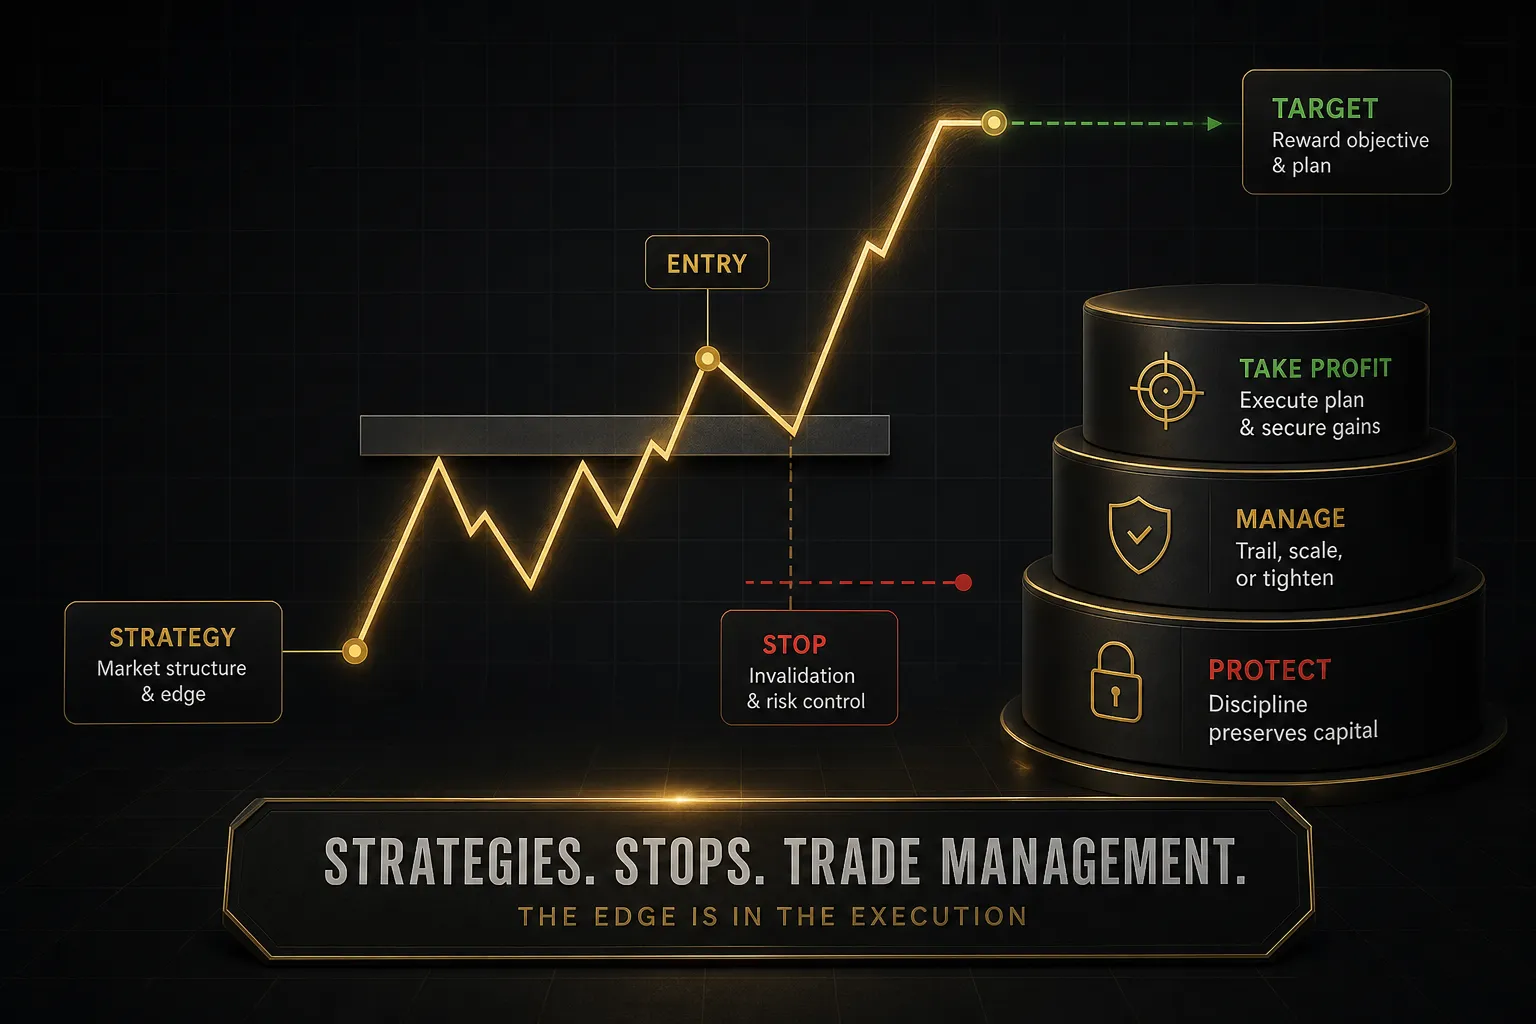
It’s the price at which your reason for being in the trade no longer exists.
Here’s the full risk framework, in the order you should apply it:
- Place stops structurally, never by arbitrary distance. “20 pips” tells you nothing about the market. Beyond the swing low that formed your setup, or beyond the far edge of the zone plus a small buffer for noise, tells you everything. If that stop is too wide for your account, the correct response is a smaller position, not a tighter stop.
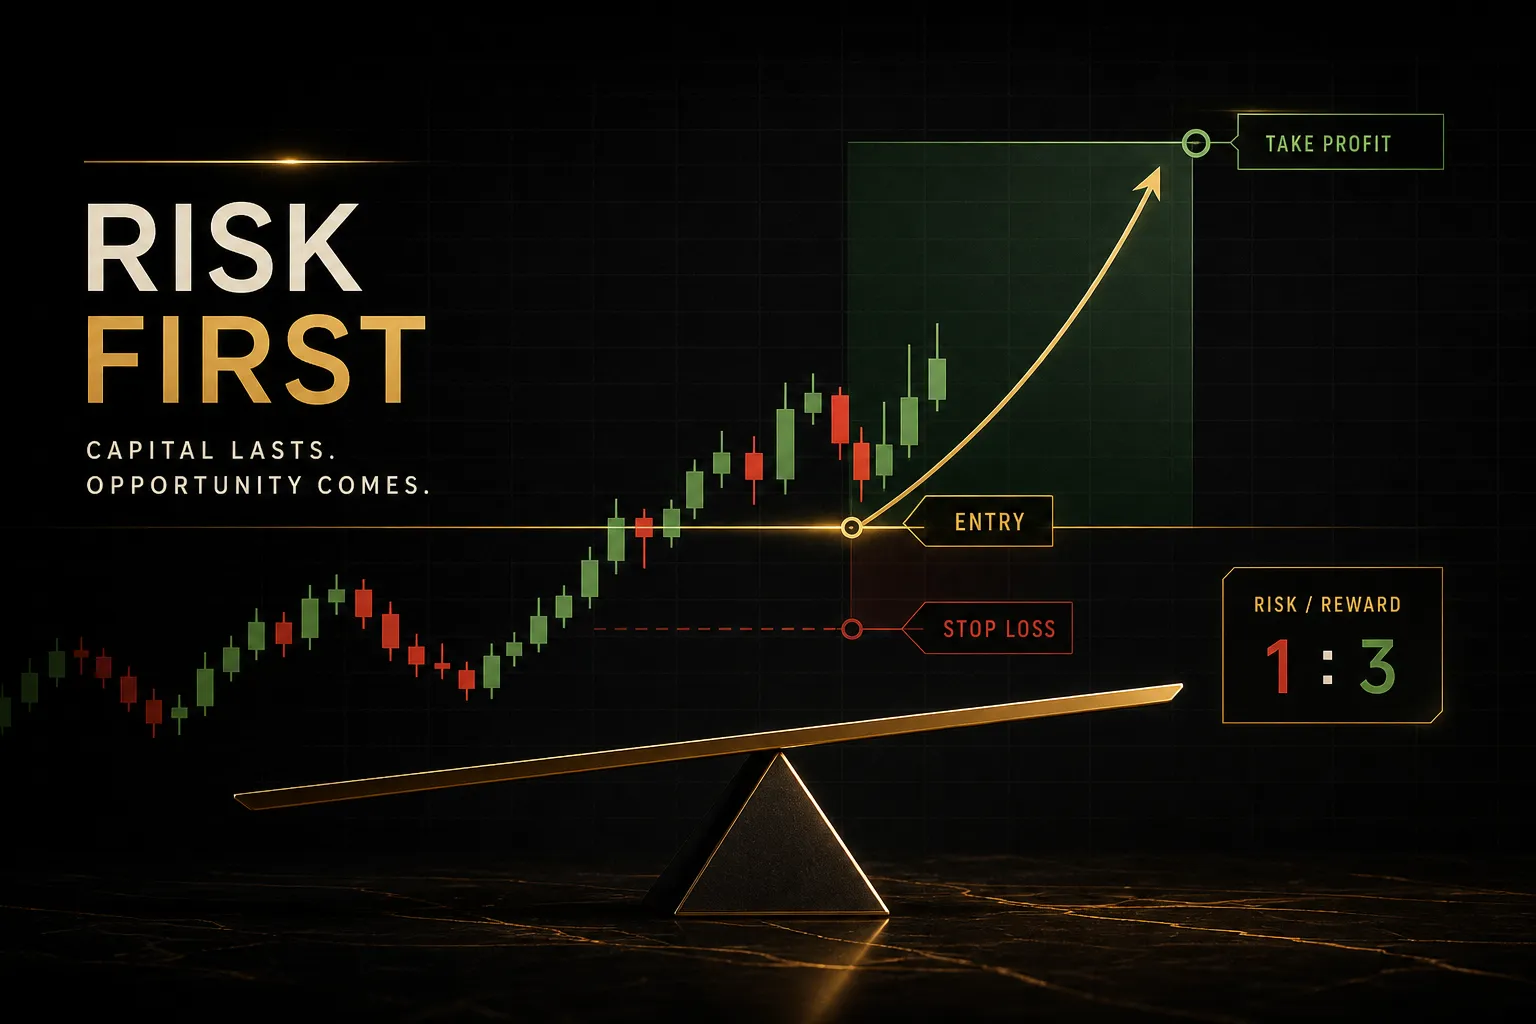
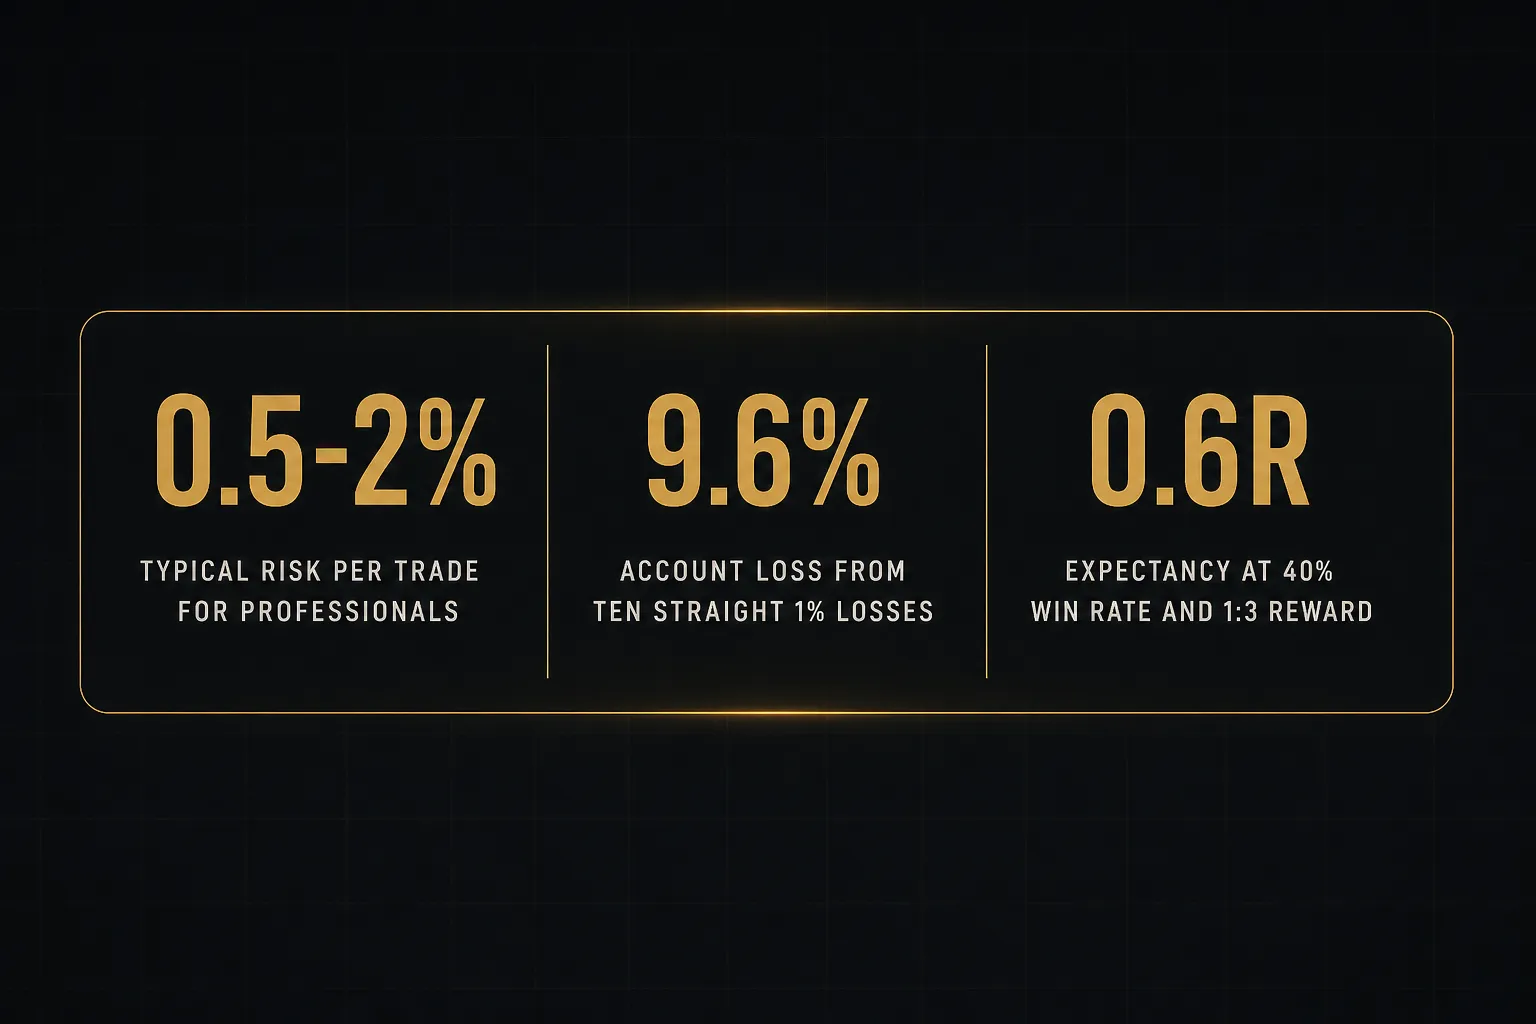
- Risk a fixed percentage per trade. Most professionals sit between 0.5% and 2% of account equity per position. At 1% risk, ten consecutive losses cost roughly 9.6% of the account. At 5% risk, the same losing streak costs about 40%, and the maths of recovery turns brutal.
- Calculate size from the stop, not the other way around. Position size equals (account equity × risk percent) ÷ (stop distance × value per point). This single formula makes stop placement and account risk independent variables, which is the entire point.
- Judge setups by expectancy, not win rate. Expectancy = (win rate × average win) − (loss rate × average loss). A 40% win rate at 1:3 risk-to-reward returns roughly 0.6R per trade. A 70% win rate at 1:0.5 returns about 0.2R. High win rate feels better and pays less.
- Account for the cost drag. Spreads, commissions, swap, and slippage come out of every trade. On a 15-pip target with a 1.5-pip spread, you’re surrendering 10% of gross profit before you start. This is why scalping tight consolidation rarely survives contact with reality.
- Model your drawdown before it happens. With a 45% win rate, a streak of eight losses is not unusual across a few hundred trades. Know that number in advance so maximum drawdown feels like statistics rather than personal failure.
Trade management deserves the same discipline. Three rules:
- Partial exits work when your target zone is genuinely uncertain. Taking half at 1.5R and moving the stop to breakeven converts a maybe into a guaranteed non-loss. The cost is a lower average win, so use it deliberately rather than reflexively.
- Trailing stops belong in trends, following structure rather than a fixed distance. Move the stop below each new confirmed higher low. In a range, trailing just guarantees you get stopped out at the midpoint.
- Know when not to manage. Once the trade is on with a valid stop and target, the default action is nothing. Constant tinkering, tightening stops out of anxiety, exiting early on a single red candle, systematically converts winners into scratches. Your edge lives in the tail of your distribution, and micromanagement cuts the tail off.
Does Price Action Actually Work?
The honest answer sits between the course sellers promising 90% accuracy and the academics declaring candlesticks worthless. Both are selling certainty that the data doesn’t support.
The Evidence Behind Candlestick Patterns
Academic studies on candlestick pattern profitability show mixed results that depend heavily on market, timeframe, pattern definition, holding period, and whether transaction costs were included. Some studies find modest predictive power in specific markets and periods; others find that any edge disappears once realistic spreads and commissions are applied.
That variance is informative.
It tells you patterns aren’t magic and aren’t useless. They’re weak signals whose value depends almost entirely on the filters wrapped around them, which is exactly what context, structure, and confluence provide.
Three problems corrupt most of what you’ll see online.
Hindsight bias makes every historical chart look obvious. Scroll back and the reversals are unmissable, because you already know where price went.
Live, in real time, the same bar could be one of five things.
Cherry-picked examples dominate educational content. Anyone can find twenty screenshots where a pin bar at support produced a clean 5R move.
Nobody posts the eighty where it didn’t, and that ratio is the actual strategy.
Repainting affects indicators and semi-automated tools that adjust historical signals as new data arrives.
A backtest built on repainted signals is fiction.
Test only on bar-close data, with spreads, commissions, slippage, and realistic execution delay baked in.
To backtest discretionary price action honestly, four rules apply. Write explicit, written pattern definitions before testing, so you can’t quietly loosen criteria mid-sample.
Use bar-close rules only.
Hold back an out-of-sample period you don’t look at until the strategy is finalized.
And resist data snooping: testing forty variations and keeping the best one produces a curve-fit result, not an edge.
A Realistic Learning Path
Skipping steps here is why most traders spend three years relearning the same lesson with real money.
- Chart-reading fundamentals. Learn OHLC data, candle body and wick anatomy, swing point definitions, and market structure until marking a chart takes under two minutes.
- Historical replay practice. Use bar-by-bar replay so you can’t see the future. This is the single highest-value practice tool because it recreates genuine uncertainty. Target several hundred replay decisions.
- Demo execution. Now add platform mechanics, order types, and position sizing calculations under live conditions. The goal is process compliance, not profit.
- Trading journal. Log setup type, context, entry trigger, stop logic, outcome in R, and one line on whether you followed your rules. Rule compliance is the metric that predicts survival.
- Statistical review. After 100 trades, calculate win rate, average win and loss in R, expectancy, and maximum drawdown by setup type. Most traders discover two of their five setups carry the entire result.
- Capped live transition. Go live with small size and forward testing discipline intact. Scale only after a defined number of profitable months, not after one good week.
Before every trade, run this checklist. If any line is blank, there’s no trade:
- Context: trending, ranging, or consolidating?
- Key level: is price at a defined higher-timeframe zone?
- Setup quality: does the candle behavior show genuine rejection or absorption?
- Confirmation: does multi-timeframe alignment support the direction?
- Entry trigger: what specific close or break puts me in?
- Invalidation: what price proves this idea wrong?
- Target: where’s the next opposing zone, and is R at least 1:2?
- Risk size: position calculated from stop distance and fixed percentage?
- News exposure: any high-impact economic news before my target is reached?
Frequently Asked Questions
Is price action trading better than indicators?
The comparison is flawed, because indicators are derived from price. A moving average, RSI, or VWAP contains no information that isn’t already in the candles; it just compresses and smooths it.
The better question is process order.
Reading structure first and using indicators as a confirmation filter reduces lag while keeping an objective check on bias. Reading indicators first adds lag and hides the structure that defines your invalidation point.
What is the most accurate price action strategy?
No single strategy holds a measurable accuracy crown, and any source claiming a fixed win rate is selling something. Performance shifts with market, timeframe, volatility regime, and transaction costs.
What consistently outperforms is structure.
Setups with defined context, multiple points of confluence (a higher-timeframe zone, a change of character, a clean entry trigger), and strict risk control beat isolated pattern-only entries. Breakout and retest in a confirmed trend and rejection at a swept higher-timeframe zone are two of the more durable frameworks.
How do you read price action for beginners?
Follow four steps in the same order every time.
First, classify the market as trending or ranging using swing highs and swing lows. Second, mark two or three key support and resistance zones on a higher timeframe.
Third, wait for price to reach one of those zones and watch the candle behavior there: long wicks, failure to close beyond, absorption of momentum. Fourth, wait for confirmation such as a close back inside the zone or a lower-timeframe change of character before entering.
Do nothing when price is mid-range.
What are the 4 types of price action?
Price action is commonly grouped into four categories. Trend price action is trading in the direction of established higher highs and higher lows, usually via pullback entries.
Range price action means fading defined boundaries when price oscillates between horizontal support and resistance. Breakout price action trades confirmed closes beyond a consolidation or level, ideally on the retest.
Reversal price action targets exhaustion and change of character at the end of an extended move, and it’s the hardest of the four to execute well.
Can you make a living with price action trading?
Yes, but chart-reading skill is only one of three requirements, and it’s rarely the binding constraint. You also need sufficient capital and strict risk management.
The maths is unforgiving.
A trader with a genuine 3% average monthly return needs roughly $200,000 in capital to generate $6,000 a month, and that return must survive drawdown periods where income drops to zero. Most people who fail don’t fail at reading charts; they fail at surviving the variance between good months, or they undercapitalize and over-risk to compensate.
What is the 3 candle rule in trading?
The 3 candle rule is a simplified confirmation heuristic requiring three consecutive closes in the same direction before accepting a directional change. It’s used to filter out single-bar noise and false breaks.
Treat it as a filter, not a signal.
Three closes confirm that momentum persisted beyond one bar, which is genuinely useful at a key level. But it delays entry, widens the required stop, and produces poor trades when applied mid-range with no structural context behind it.
The Bottom Line on Price Action
Price action trading works as a structured process, not a pattern catalogue.
Context, structure, levels, candle behavior, confirmation, risk.
Six steps, applied identically every time, on every chart.
The traders who struggle are almost always skipping steps two and six while obsessing over step four.
Your next move should be small and specific.
Pick one instrument.
Mark this week’s swing structure and two key zones on the daily chart.
Then run the pre-trade checklist on paper for twenty setups before risking a cent.
Track how many setups actually cleared every line. Most traders are shocked by how few do… and that number alone explains a lot of past losses.
Tools like PipTrend’s trend signals and multi-timeframe table fit into this as an objective confirmation layer, giving you a fast read on whether your idea aligns across timeframes.
They confirm the process.
They don’t replace it.
Sources
Risk Disclaimer: Trading involves risk. Past performance doesn't guarantee future results. Only trade with money you can afford to lose. PipTrend is a tool to assist your trading decisions, not financial advice.