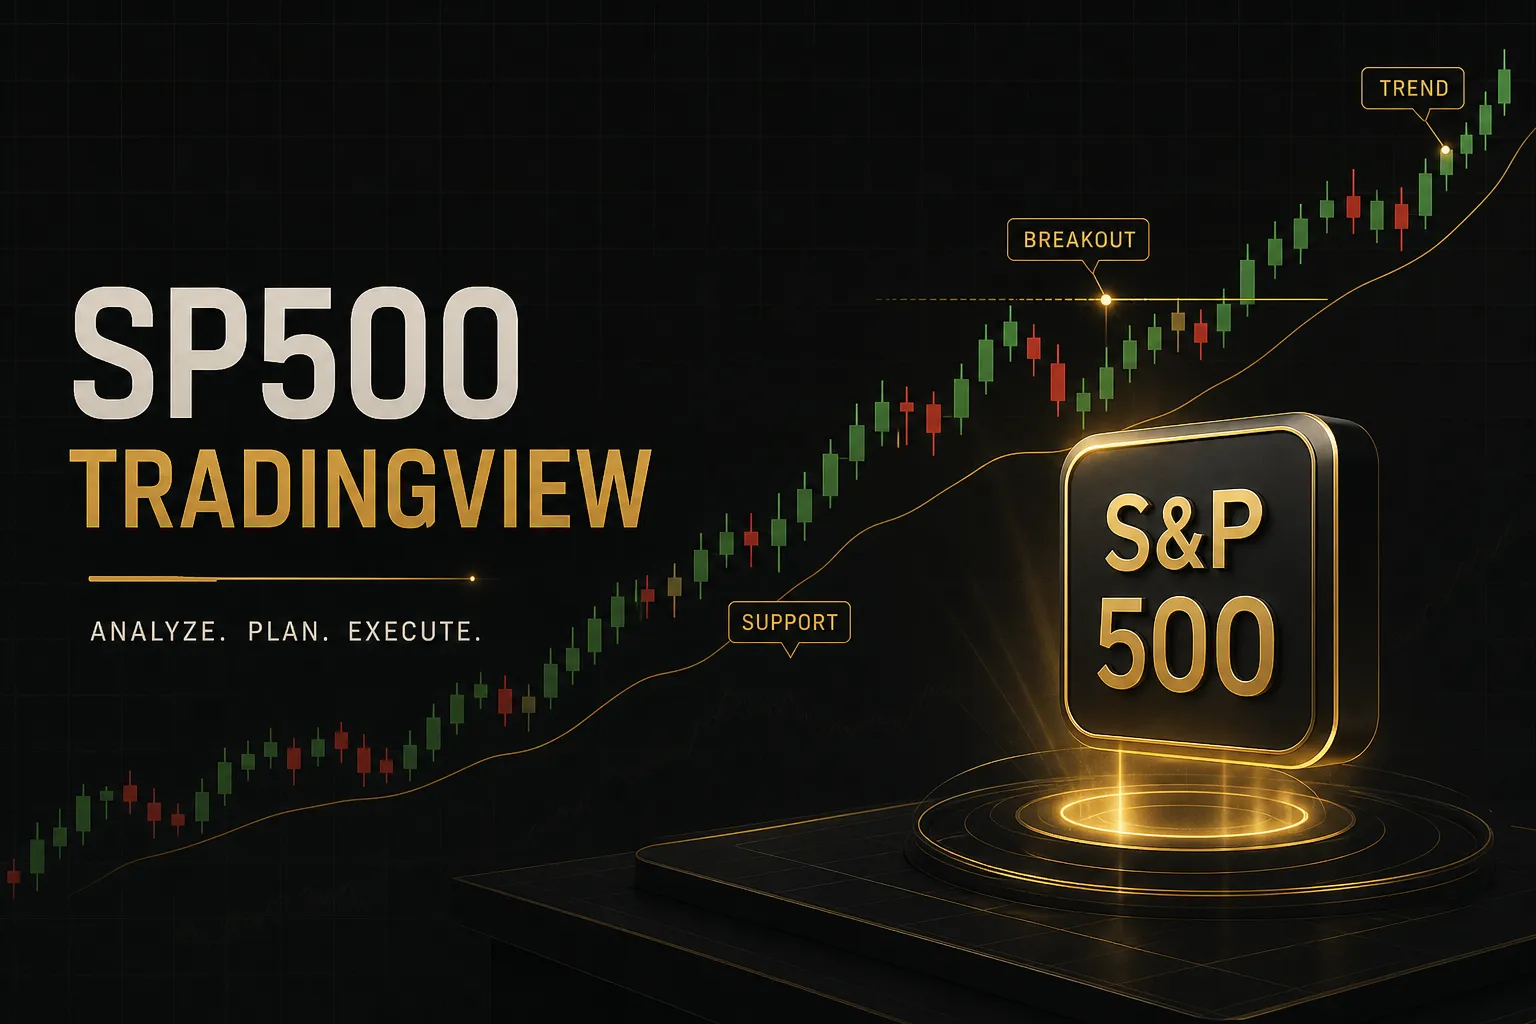
SP500 on TradingView: Picking the Right Symbol and Chart
On this page
Why the S&P 500 Symbol Confuses Traders
Type “SP500” into the TradingView search bar and you get a wall of results. SPX, SPY, ES1!, MES1!, US500, SPX500, and a dozen broker-branded variants all claiming to be the same market.
They are not the same. Not even close.
One of them is a calculated number that nobody can buy. One is an ETF with real share volume.
Two are futures contracts that trade nearly around the clock. And the rest are contracts-for-difference priced by whichever broker happens to be feeding the data.
The consequences are practical, not academic. Choosing the wrong symbol changes the price printed on your chart, whether volume data exists at all, what hours the candles cover, and whether you can actually execute a trade on it.
A support level marked on the SPX ticker at 5,842 might sit at 5,846 on the E-mini and 583.10 on the ETF.
Same market.
Three different numbers.
Traders lose money over this.
They backtest a strategy on the cash index, go live on a US500 CFD, and wonder why the results collapsed. Or they set an alert on SPX at 3am and never get filled, because the index simply does not tick outside regular trading hours.
This guide fixes that.
We will break down the full symbol family and what each one actually represents, give you a decision framework for matching symbol to purpose, walk through a repeatable chart and alert setup, and cover the backtesting traps that make paper results look better than live ones.
The S&P 500 Symbol Family Explained
Every symbol below tracks the same 500 large-cap US companies. What differs is the wrapper: how the number is calculated, who publishes it, when it updates, and whether money can change hands on it.
Here is the full comparison.
| Symbol | What It Is | Trading Hours | Volume Data | Directly Tradable? |
|---|---|---|---|---|
| SPX | The cash index value, calculated live from all 500 constituent stock prices and their float-adjusted market caps | 9:30am to 4:00pm ET, US equity session only | None. An index has no shares and no trades | No. It is a number, not an instrument |
| SPY | SPDR S&P 500 ETF Trust. An exchange-traded fund holding the underlying basket, priced at roughly 1/10th of SPX | 9:30am to 4:00pm ET, plus pre-market and after-hours extended sessions | Yes. Real share volume, typically 60 to 90 million shares daily | Yes, through any equity brokerage |
| ES1! | E-mini S&P 500 futures, continuous front-month contract. $50 per index point | Sunday 6:00pm ET to Friday 5:00pm ET, with a daily one-hour break | Yes. Deep exchange volume from CME Group | Yes, through a futures broker |
| MES1! | Micro E-mini S&P 500 futures, one-tenth the size of ES. $5 per index point | Same as ES1!, nearly 23 hours per weekday | Yes, though thinner than ES | Yes, through a futures broker |
| US500 / SP500 | Broker-issued CFD tracking the index. Price and spread set by that broker’s feed | Broker-dependent, often near 24/5 | Sometimes tick volume only, not real traded volume | Yes, but only with that specific broker |
What each one actually gives you
SPX is the purest signal.
It is computed from the constituents themselves, so it carries no tracking error, no expense ratio drag, no dividend distortion. When analysts quote “the S&P 500 closed at 5,900,” this is the number they mean.
The tradeoff: SPX goes flat outside the equity session. No overnight gap information, no reaction to Asian or European hours, no volume, no volume profile.
SPY behaves like a stock because it is one.
It has a bid-ask spread, real order flow, and an extended-hours session running from 4:00am to 8:00pm ET. It also drifts slightly from the index over time thanks to its 0.0945% expense ratio and the way it holds dividends in cash before distributing them quarterly.
Divide SPX by 10 and you get an approximation of SPY, not an exact match. The gap widens across the quarter and resets on ex-dividend dates.
ES1! and MES1! are continuous contracts, which is a detail most traders skip past and later regret. The “1!” means TradingView is stitching the front-month contract into one unbroken series and adjusting historical prices at each quarterly rollover.
A price level you drew on ES1! six months ago may not correspond to any price that ever traded on any single contract. The adjustment shifts history.
That makes continuous futures excellent for trend structure and terrible for precise long-horizon level marking. If you need the raw contract, use the dated symbol like ESH2026 instead.
US500 and SP500 CFDs are the wild card.
There is no central exchange.
Each broker publishes its own price, its own spread, and its own session calendar. Two brokers can print prices four points apart at the same instant and both are technically correct within their own feed.
Before trusting one, open the symbol info panel and check the listed data provider. If it says a broker name rather than an exchange, you are looking at a synthetic product.
One last clarification: SPX options and SPY options are separate instruments with their own strikes, expiries, and settlement mechanics.
SPX options settle in cash and are European-style. SPY options settle in shares and are American-style.
Neither appears as a chart symbol on its own; you access them through an options chain, not the ticker search.
Matching the Symbol to Your Purpose
The right symbol is the one that matches what you are actually doing with the chart. Analysis, execution, and overnight context each pull toward a different answer.
For Chart Analysis and Trend Reading
When your goal is reading structure, marking levels, and understanding where the S&P 500 index sits in its larger trend, SPX is the default.
- Use SPX for clean index-level price action. No tracking error, no roll adjustments, no broker spread baked into the candles. What you see is the actual computed value of the index, which is also what every financial news outlet, options desk, and research note references.
- Use SPX when marking multi-year levels. Because it is never adjusted, a horizontal line drawn at the 2022 low still points at the exact same value in 2026. Futures continuous contracts cannot promise that.
- Pair SPX with breadth data. Indicators built on market breadth, like the percentage of constituents above their 200-day moving average, align naturally with the cash index session and give you internal confirmation that a move has participation behind it.
- Accept the limitation. SPX will show you a gap from Friday’s close to Monday’s open with nothing in between. If overnight movement matters to your read, you need a second chart.
For Actual Execution
Analysis charts and execution charts do not have to be the same chart, but your execution chart must be the instrument you are trading.
- Use SPY when you trade shares or equity options. It carries genuine volume, which means volume profile, VWAP, and order-flow-adjacent tools produce meaningful output. It also connects directly to most retail brokerages through TradingView’s integrations.
- Use ES1! or MES1! when you trade futures. The E-mini S&P 500 futures contract is where institutional hedging flows through, and its volume profile is the most honest picture of where size has actually transacted. Micro E-mini S&P 500 futures give the same exposure at one-tenth the notional, which matters for accounts under $25,000.
- Use a broker US500 CFD only if that broker holds your money. There is no reason to chart a CFD you cannot trade. And before you rely on it, open the symbol info panel and confirm the data source, the contract size, and the session times, because none of those are standardized.
- Never execute off a chart you did not verify. A delayed feed, a mismatched exchange, or a broker whose spread widens at the open will all produce entries that look nothing like your plan.
For Overnight and Extended-Hours Context
Roughly half of the S&P 500’s long-run price movement has historically occurred outside regular US cash hours. Ignoring that window means trading blind to half the information.
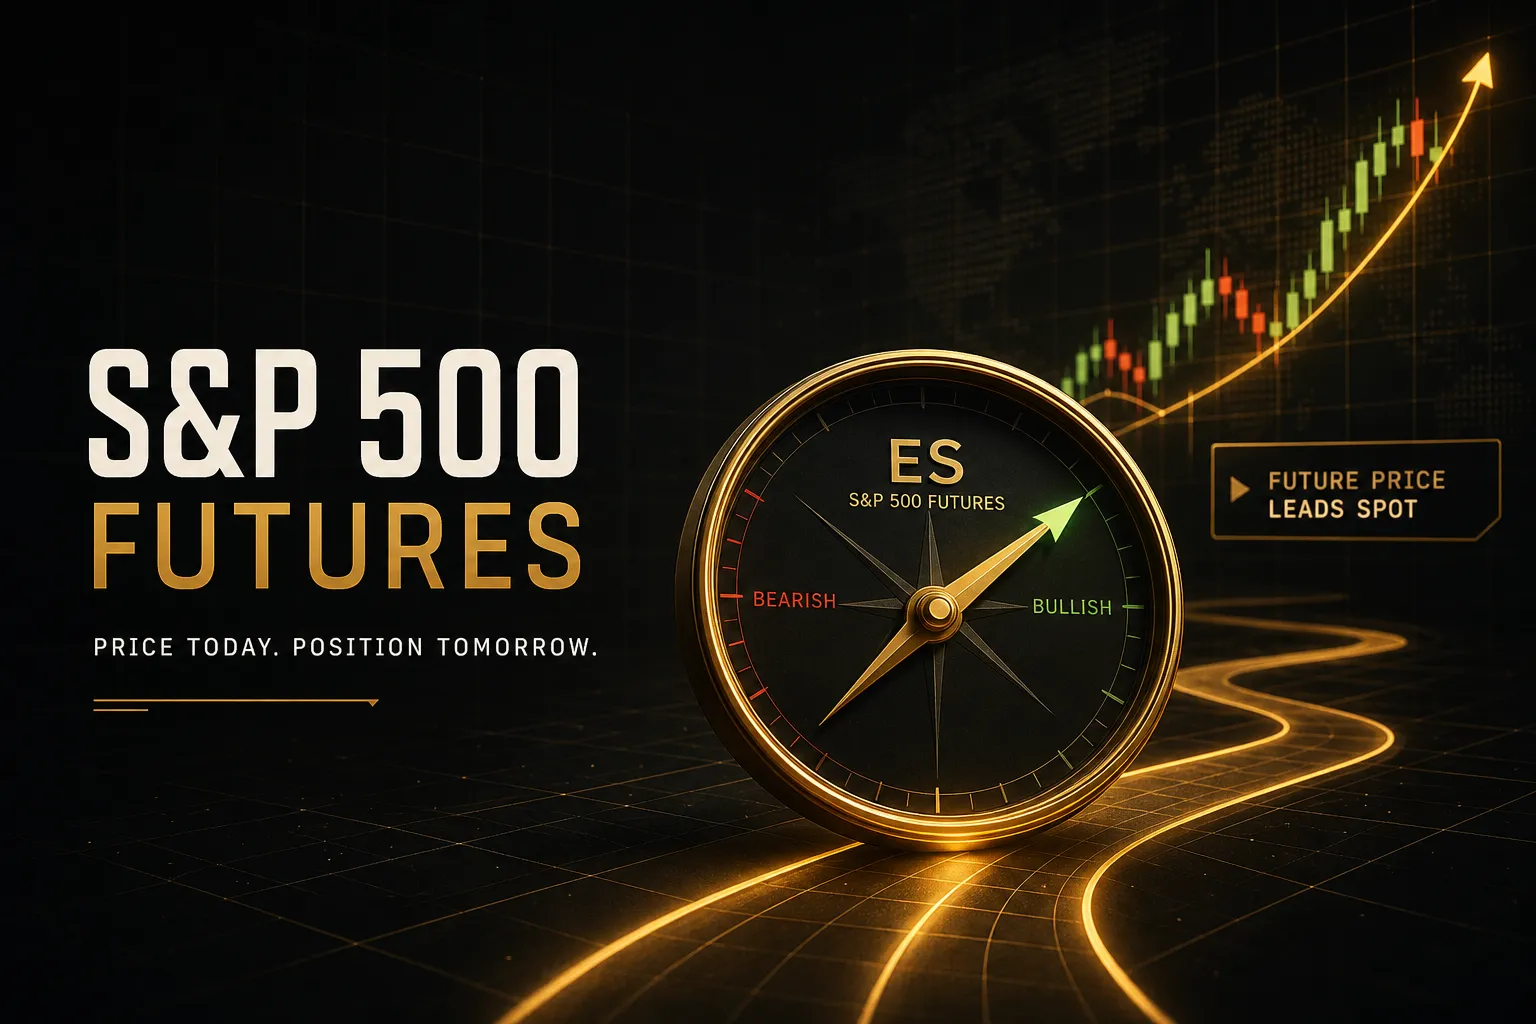
- Use ES1! for pre-market price discovery. The ES1! continuous futures contract reacts to Asian sessions, European opens, overnight geopolitical headlines, and futures-implied reactions to earnings released after the bell.
- Use ES1! to anticipate the cash open. The overnight high and low frequently act as intraday reference levels once SPX opens, and knowing where futures traded at 4am often explains an otherwise inexplicable 9:31am move.
- Use SPY extended hours as a secondary check. Pre-market SPY volume is thin, but a divergence between SPY pre-market and ES1! sometimes signals ETF-specific flow rather than genuine index repricing.
Setting Up Your Chart, Indicators, and Alerts
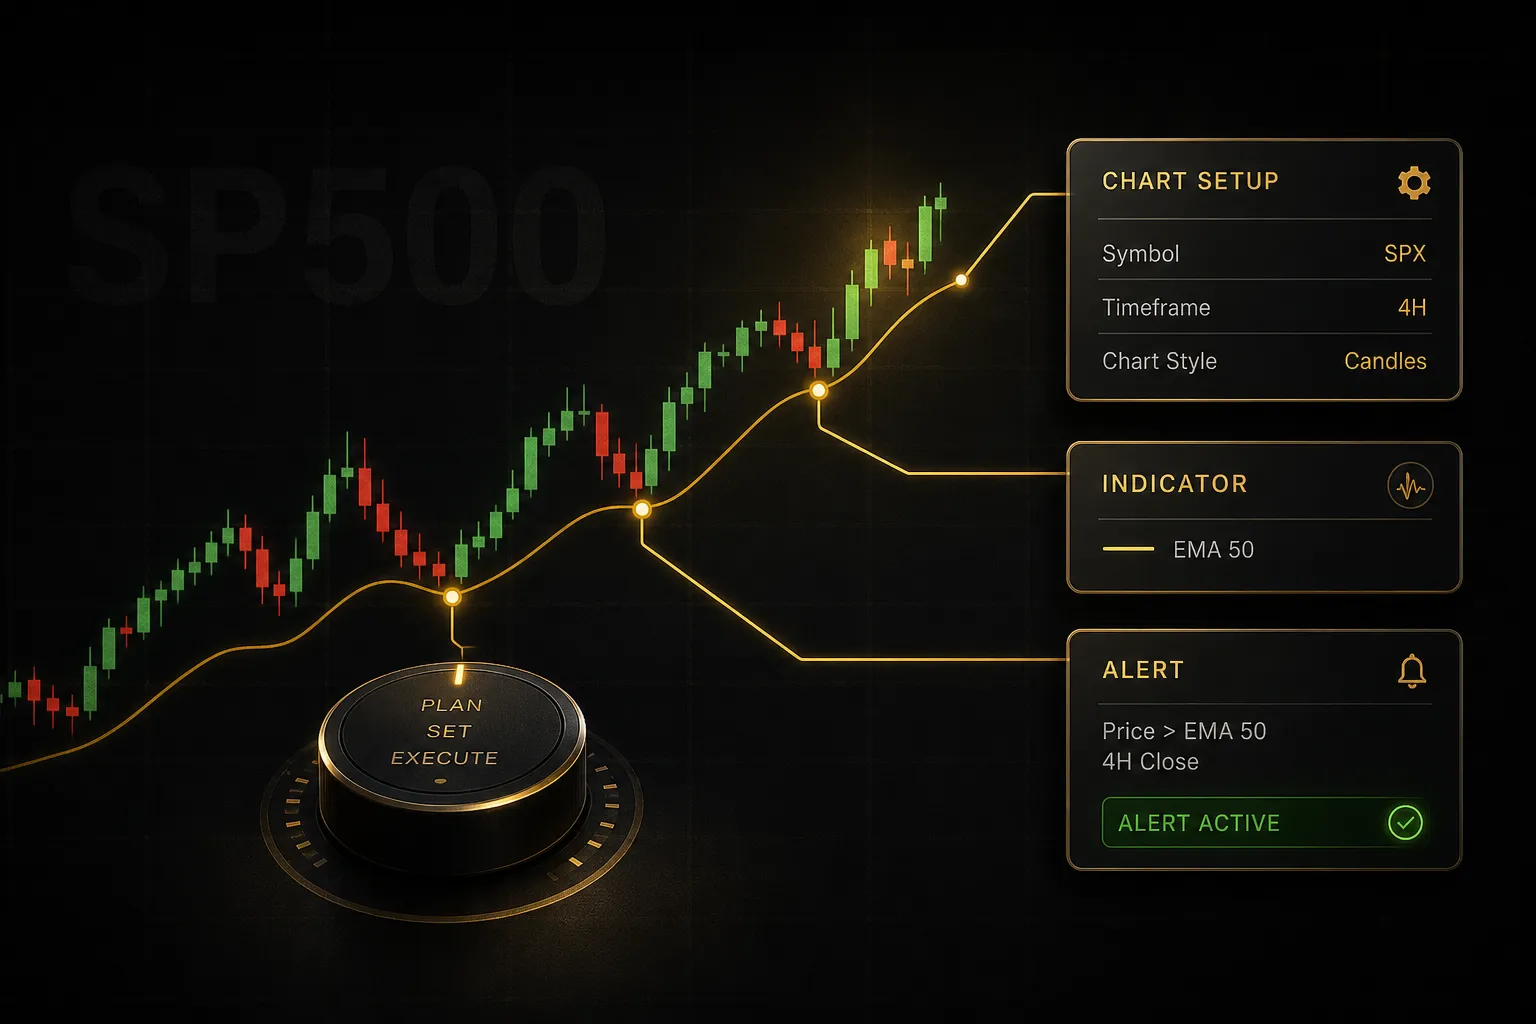
Most chart setup failures happen in the first thirty seconds, before a single indicator is added.
Verify first, then build.
Verify the Exchange and Data Feed
- Open the symbol info panel. Click the ticker name at the top left of the chart and select the info option. This shows the exchange, the data provider, the currency, the tick size, and the contract specifications in one place.
- Check for a delay flag. TradingView marks delayed feeds explicitly, usually with a “D” badge or a “delayed” label near the price. CME futures data on the free tier is typically delayed by 10 minutes, which is fatal for intraday entries. Confirm whether you have real-time market data or delayed data before you trust a single tick.
- Confirm the exchange matches your broker. If your broker prices US500 from its own liquidity pool and you are charting a different provider’s CFD, your levels will be systematically off. Same problem applies to charting SPX while executing SPY.
- Set the session correctly. Under chart settings, decide whether extended hours display is on or off. Leaving it on for SPY changes every candle’s high, low, and open, which changes every level you draw.
Add Indicators and Build a Signal Workflow
An indicator is not a strategy.
A workflow is.
The sequence below works because each step answers a different question, in order.
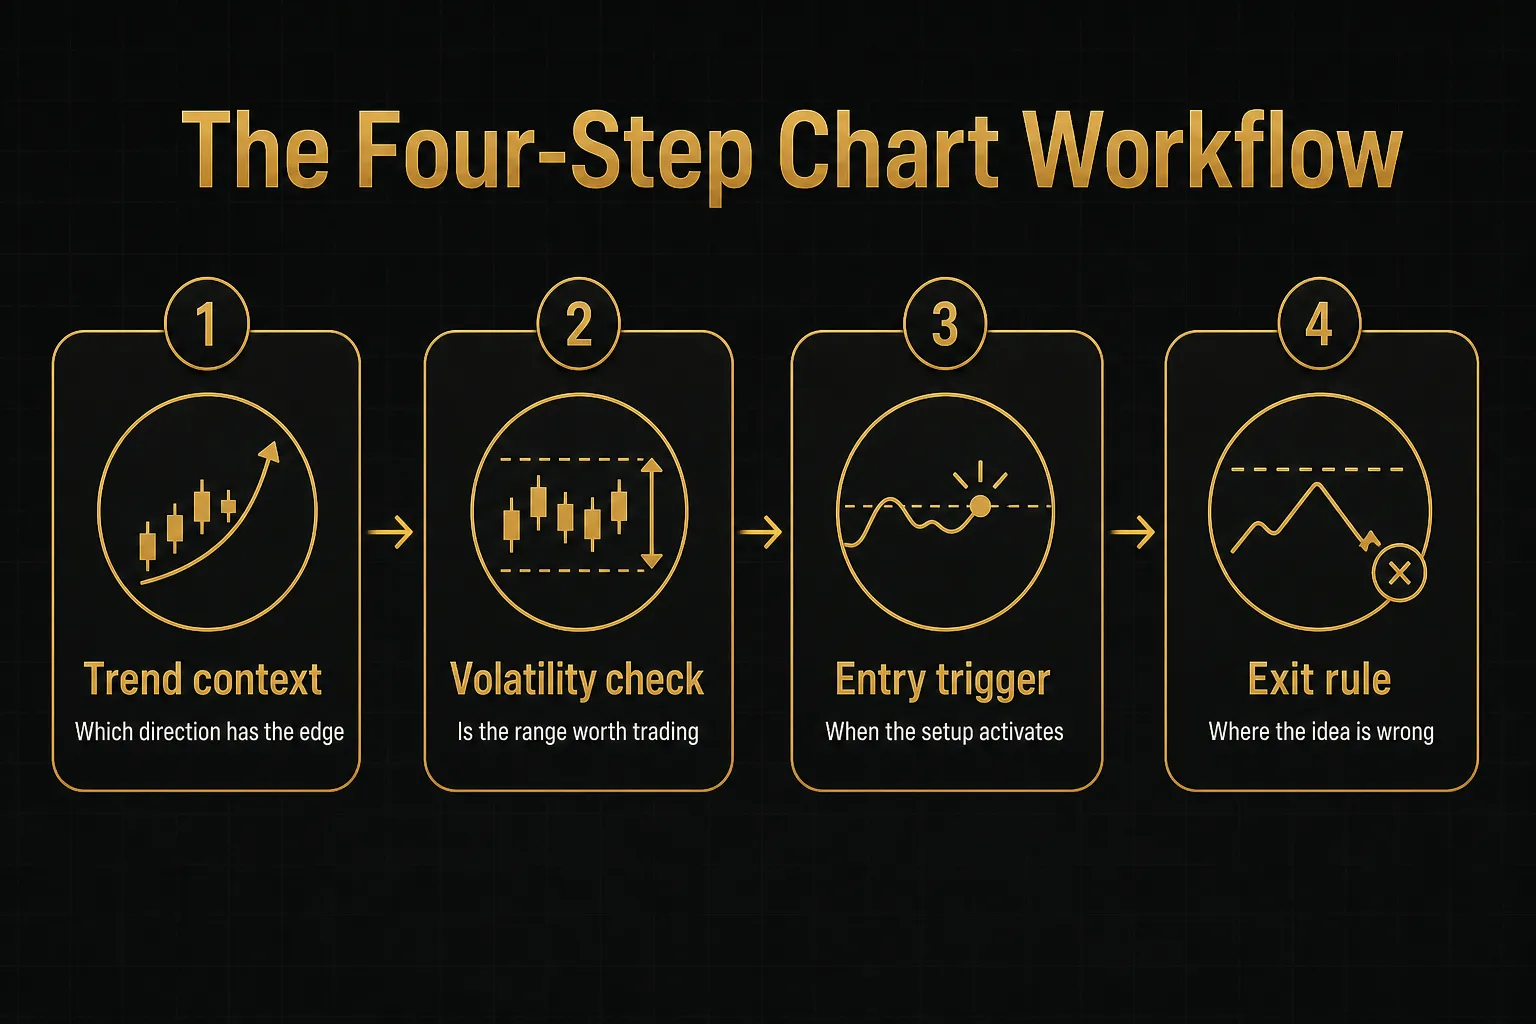
- Establish trend context first. Before anything else, determine whether the S&P 500 is trending, ranging, or transitioning. Tools like PipTrend handle this with color-coded trend candles, so the directional bias is visible at a glance rather than inferred from crossing lines.
- Confirm across timeframes. This is where most retail setups break down: a valid 5-minute long inside a bearish 4-hour structure is a low-probability trade. PipTrend’s multi-timeframe table spans 1-minute through Monthly, letting you check whether the higher timeframes agree before committing. Genuine multi-timeframe analysis means alignment, not confirmation bias.
- Check volatility conditions. Add ATR or a volatility band and ask whether the current range supports your stop distance. A 3-point ATR on ES1! makes a 12-point stop unnecessary; a 25-point ATR makes it suicidal.
- Mark your entry level manually. Do not enter on a signal color alone. Mark the actual price levels: prior session high and low, VWAP, overnight range extremes, supply and demand zones. PipTrend deliberately separates direction signal from entry level for this reason, and you should apply the same discipline whatever tools you use.
- Define invalidation before entry. Write down the price at which the idea is wrong, and the price at which you take profit, before the order goes in. If you cannot state both numbers, you do not have a trade. You have a hunch.
- Save the layout as a template. TradingView lets you save indicator sets and drawings as reusable templates. Build it once, apply it to SPX, SPY, and ES1! with two clicks, and stop rebuilding your workspace every morning.
Configure Alerts That Actually Trigger
- Set the alert on the timeframe you trade. An alert created while viewing a 5-minute chart evaluates on 5-minute logic. Create it on the daily and it fires once per day, at most. This single mismatch causes more “my alert never fired” complaints than any other issue.
- Choose “Once Per Bar Close” for indicator conditions. Intrabar triggering fires the moment a condition is momentarily true, then the bar reverses and the signal vanishes. Bar close eliminates that repainting confusion entirely, at the cost of a slightly later notification.
- Understand that alerts freeze your settings. When you create an alert, TradingView captures the indicator’s parameters at that moment. Change the indicator’s length from 14 to 21 afterward and the existing alert still runs on 14. You must delete and recreate it.
- Check the expiry date. Free and lower-tier plans cap alert duration. An alert that quietly expired two weeks ago will never notify you of anything.
- Test the delivery channel. Enable app push, email, or webhook and fire a deliberate test alert at a price the market will hit within minutes. Confirm it arrives before you rely on it for a live position.
Quick Troubleshooting
- Symbol not found: you are searching within the wrong exchange filter. Clear the exchange filter and search again, or type the full prefix like CME_MINI:ES1!.
- Blank or frozen chart: data feed interruption. Reload the browser tab first, then check whether your data subscription covers that exchange.
- Price differs from your broker: different data source. Standard for CFDs, and expected between SPX and any tradable proxy.
- No volume on SPX: working as designed. An index has no shares outstanding and no transactions, so there is nothing to count. Switch to SPY or ES1! for volume work.
- Alert never fired: wrong timeframe, expired alert, or a condition that requires bar close on a bar that has not closed yet.
Backtesting the S&P 500 Without Fooling Yourself
A backtest showing a 78% win rate on SPX is not evidence of an edge. It is usually evidence of a modeling error.
Costs and Fill Assumptions
Default backtest settings on most platforms assume perfect fills at zero cost.
Real trading offers neither.
- Commissions compound fast. At $2.50 per side per ES contract, a strategy taking four round-trip trades a day burns roughly $5,000 a year on a single contract. That alone flips many marginal systems into losers.
- Slippage is not optional. Market orders on ES1! typically fill within a tick in liquid hours, but during the 9:30am open or a CPI release, two to four ticks is normal. Model at least one tick of slippage per side, more if you trade news.
- Spread applies to CFDs constantly. A US500 CFD with a 0.6-point typical spread that widens to 3 points overnight will destroy a scalping system that looked profitable on mid-price data.
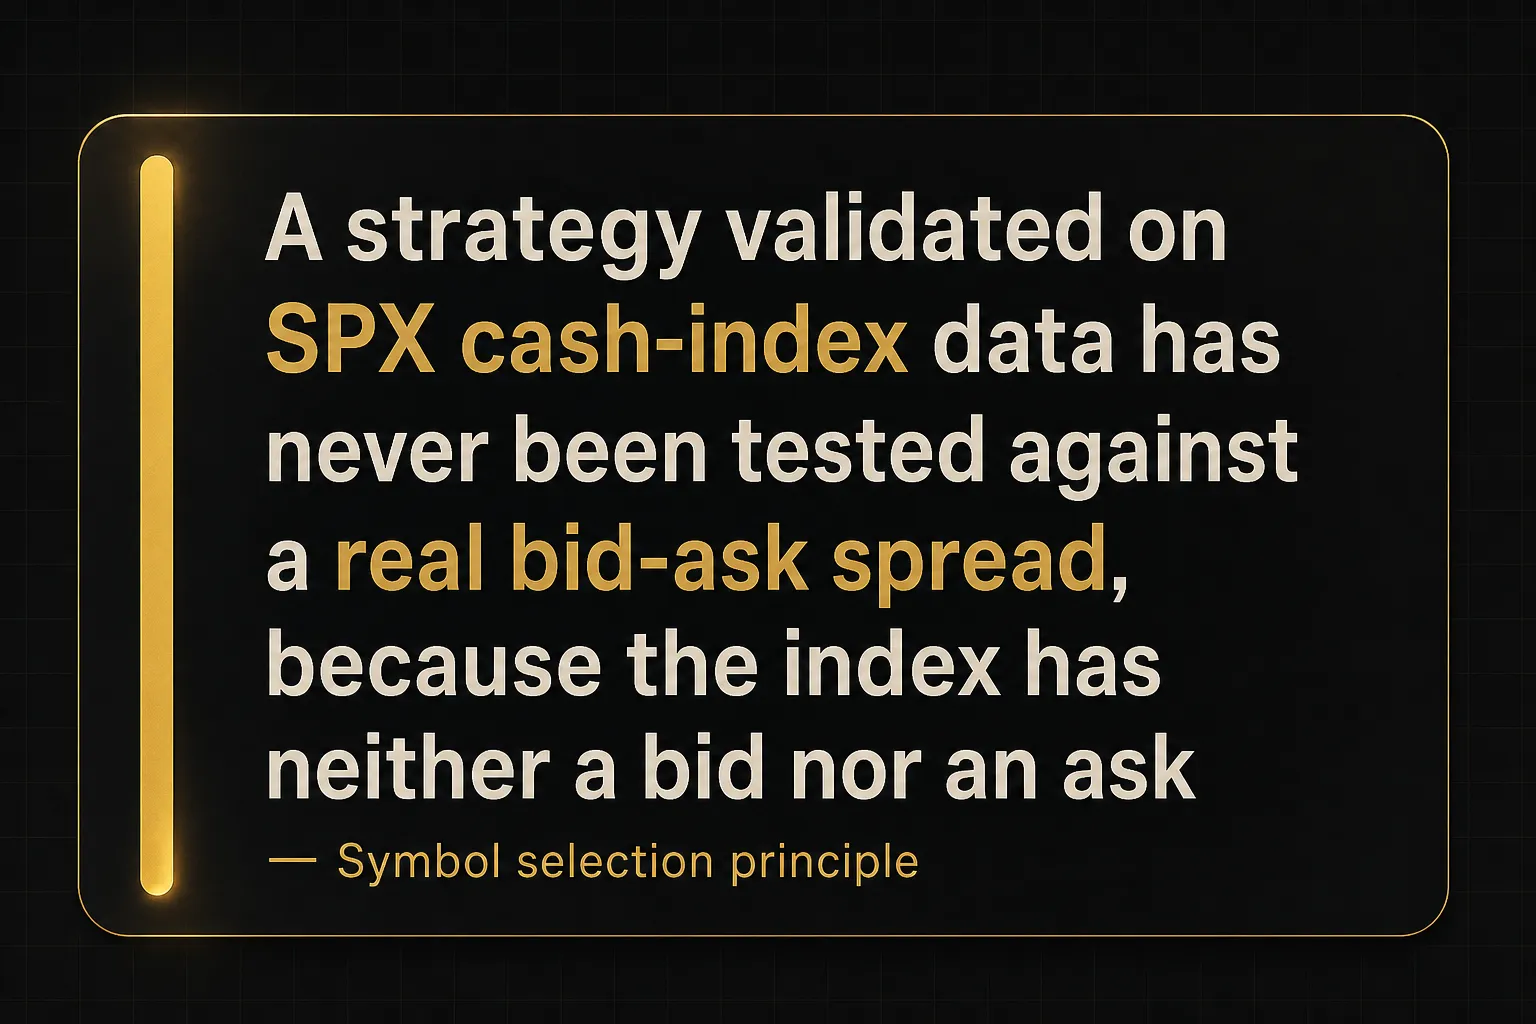
- SPX has no spread or volume to model against. There is no bid, no ask, no fill queue, because there is no market. Any backtest run on the cash index is measuring a theoretical price series, not achievable execution.
- Limit orders need fill logic. Assuming every limit order at a level gets filled because price touched it is optimistic. In reality, price must usually trade through your level for you to be filled.
Bias That Inflates Results
Three biases account for most of the gap between backtest equity curves and live account statements.
- Lookahead bias occurs when your logic references information unavailable at that moment: using a bar’s close to trigger an entry at that same bar’s open, or pulling higher-timeframe values before they finalize. It produces impossibly clean results.
- Selection bias is testing your idea on the one period, symbol, or market regime where it happens to work. A mean-reversion system tested only across 2023 and 2024 looks brilliant until a genuine trending drawdown arrives.
- Curve-fitting and overfitting is what happens when you optimize eleven parameters against the same historical data. You have not found an edge, you have memorized noise. The fix is out-of-sample testing: build on one date range, validate on a completely separate one you never touched.
- Survivorship considerations matter less for the index itself than for constituent-based strategies, but remember the S&P 500’s composition changes roughly 20 to 25 times a year. Historical index data already reflects those swaps.
Chart Types That Distort Testing
This one catches experienced traders.
And it catches them hard.
- Never backtest on Heikin Ashi. Those candles are averaged constructions, not real OHLC data. The displayed open and close are calculated values that no order could ever have filled at, so any strategy referencing them produces fictional entry prices and inflated win rates.
- Avoid Renko, Kagi, and Point & Figure for strategy testing. These are price-based rather than time-based, meaning bars form only when price moves a set amount. Backtest engines struggle to assign realistic timestamps and fills, which typically flatters the result dramatically.
- Test on standard candlesticks or bars. Real open, high, low, close, at real timestamps. Use Heikin Ashi for visual trend reading if you like it, then verify every signal against a standard chart before testing.
- Test on the instrument you will actually trade. If you plan to trade SPY, backtest SPY. If you trade MES1!, backtest MES1!. Migrating a strategy validated on SPX to a CFD with a variable spread and a different session calendar is not a transfer, it is a new experiment.
Frequently Asked Questions
What symbol is the S&P 500 on TradingView?
The S&P 500 index itself is SPX on TradingView. That is the cash index calculated from all 500 constituent companies during US regular trading hours.
If you want a tradable version instead, the main options are SPY for the ETF, ES1! for E-mini futures, MES1! for Micro E-mini futures, or a broker-specific US500 CFD.
Same underlying market, four different instruments.
Is SPX or SPY better for TradingView?
SPX is better for analysis, SPY is better for execution and volume work.
SPX gives you the unadjusted index value with no tracking error, which makes it the cleanest reference for trend structure and long-term level marking.
SPY carries real share volume, an extended-hours session, and a direct connection to your brokerage account. Many traders keep both open: SPX for the read, SPY for the trade.
What is the difference between SPX and ES1!?
SPX is the cash index; ES1! is a continuous futures contract on that index. SPX only updates between 9:30am and 4:00pm ET, while ES1! trades nearly 23 hours a day and captures overnight sentiment.
ES1! also carries roll adjustments, since TradingView stitches consecutive quarterly contracts into one series. That means historical ES1! prices may not match any price that traded on a single expiring contract.
Can you trade the S&P 500 on TradingView?
You can place S&P 500 orders through TradingView, but only via a connected broker. TradingView is a charting and analysis platform, not an exchange or a clearing firm.
Connect a supported brokerage or futures broker, and you can trade SPY, ES1!, MES1!, or your broker’s US500 CFD from the chart interface. You cannot trade SPX directly, because the index is a calculated value with nothing to buy.
Why is there no volume on the SPX chart?
SPX has no volume because an index has no shares and no transactions. It is a mathematical output derived from the float-adjusted market caps of 500 stocks, not an instrument that changes hands.
For volume profile, VWAP, or any order-flow analysis, switch to SPY for equity share volume or ES1! for CME futures volume. Both reflect actual transacted size.
What is the best indicator for the S&P 500 on TradingView?
No single indicator reliably predicts direction, and any tool marketed that way should raise your skepticism. Indicators describe what price has already done; they do not forecast it.
What works better is a system that combines three things: trend context, a defined entry level, and multi-timeframe confirmation. Tools like PipTrend package that structure together, using color-coded trend candles for direction and a 1-minute-to-Monthly table for alignment, rather than firing an isolated buy or sell signal.
The discipline matters more than the indicator.
Pick the Symbol, Then Build the Process
Here is the direct recommendation.
Open SPX tonight and read the index-level trend on the daily and 4-hour, uncluttered by tracking error or roll adjustments.
Then cross-reference.
If you trade shares or options, put SPY next to it and check where volume has actually built. If you trade futures, pull up ES1! and look at what happened overnight, because the cash index will not tell you.
And stop treating any single signal as a standalone call. A green candle, a moving average cross, an oscillator turning up… none of those are trades on their own.
They are one input.
The traders who last combine three things every time: a trend context that says which direction has the edge, a marked price level that says where to act, and an exit rule that says where the idea is dead.
Symbol choice gets you accurate data.
The process is what makes that data worth having.
Pick the right chart.
Then build the discipline that goes on top of it.
Sources
Risk Disclaimer: Trading involves risk. Past performance doesn't guarantee future results. Only trade with money you can afford to lose. PipTrend is a tool to assist your trading decisions, not financial advice.