
In the fast-moving world of trading, having a reliable technical tool can mean the difference between profit and frustration. As markets become more complex in 2025, mastering the right strategies is essential.
That’s where the parabolic sar indicator steps in—designed to help you spot trend reversals and improve your timing. This guide will break down how it works, show you how to configure it for any market, and walk you through proven methods to trade with confidence.
You’ll discover what the Parabolic SAR is, how it signals trades, ways to set it up, effective strategies, common pitfalls, advanced tips, and how to combine it with other tools. Ready to level up your trading?
What Is the Parabolic SAR Indicator?
Understanding the parabolic sar indicator is essential for anyone navigating today’s fast-moving markets. This tool, with its simple visual cues, helps traders spot potential trend reversals and plan smarter entries and exits. But what exactly is it, how does it work, and why do so many traders trust it?
Definition and Purpose
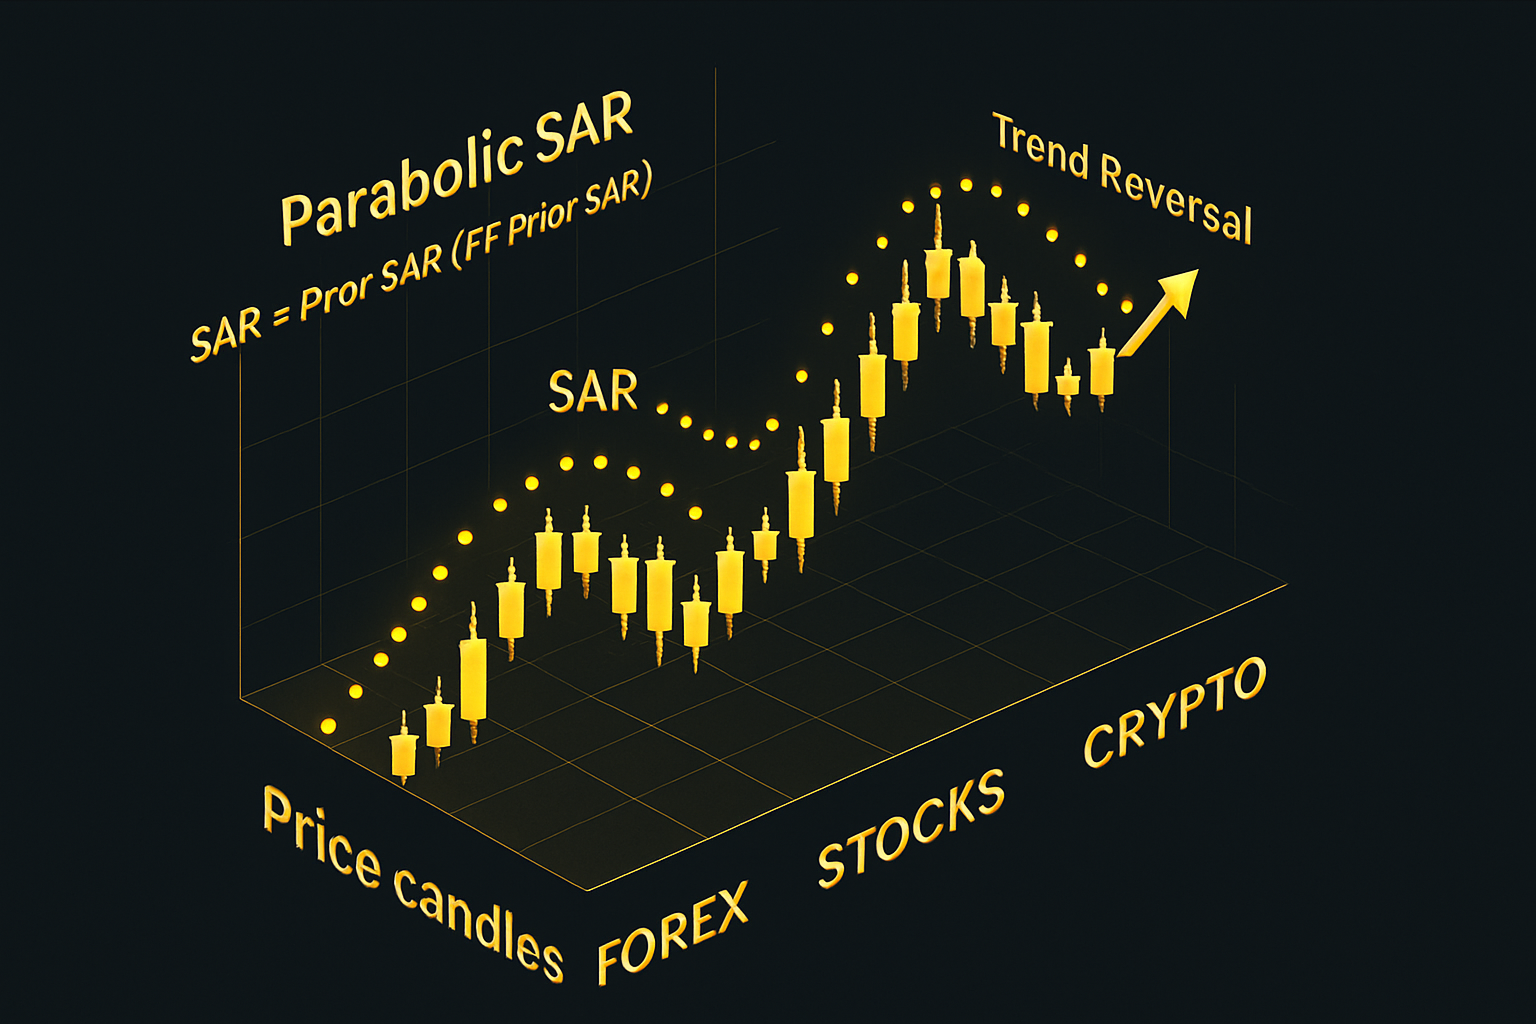
The parabolic sar indicator stands for “Stop and Reverse,” a name that directly hints at its core function. Developed by J. Welles Wilder Jr. in 1978, it was created to help traders identify possible trend reversals and pinpoint optimal entry or exit spots.
You’ll find the parabolic sar indicator used across forex, stocks, crypto, and commodities. Its hallmark is a series of dots that appear above or below price bars—below signals a bullish trend, above signals bearishness. When trends shift, these dots “flip” to the other side, signaling a potential change in direction.
The main purpose of the parabolic sar indicator is to help traders trail their stops and lock in profits as trends develop. For a deeper dive into its origins, calculation, and applications, see this Parabolic SAR Indicator Guide.
How the Parabolic SAR Works
At its heart, the parabolic sar indicator relies on a straightforward formula:
SAR = Prior SAR + AF × (EP – Prior SAR)
Here, AF is the Acceleration Factor (starting at 0.02 and increasing as the trend strengthens), and EP is the Extreme Point—either the highest high (uptrend) or lowest low (downtrend) during the current move.
When the parabolic sar indicator’s dots appear below price, it suggests a bullish trend; dots above price signal a bearish one. As price continues, the indicator “trails” along, staying close to the action. If price crosses the SAR dot, the indicator “flips” to the other side, hinting at a possible reversal.
This adaptive quality lets the parabolic sar indicator respond to trend strength, providing timely signals that traders can act on with confidence.
Strengths and Weaknesses
The parabolic sar indicator is prized for its simplicity and visual clarity. It’s objective—dots are either above or below price—making it easy to follow for both beginners and experts. In trending markets, it excels at helping traders set trailing stops and capture profits as moves unfold.
However, the parabolic sar indicator isn’t perfect. In sideways or choppy markets, it can generate frequent false signals, known as “whipsaws.” It also tends to lag at key turning points, especially during periods of high volatility. This is why it’s best used in combination with other tools, rather than as a standalone system.
| Strengths | Weaknesses |
|---|---|
| Simple & visual | Prone to whipsaws |
| Effective in trends | Lags in volatility |
| Great for trailing | Not standalone |
Key Parameters and Customization
The default settings for the parabolic sar indicator are an Acceleration Factor (AF) of 0.02 and a maximum AF of 0.20. Adjusting these parameters changes the indicator’s sensitivity—lower AF values produce smoother, less reactive dots, while higher values make the indicator more responsive to price movement.
Customizing the parabolic sar indicator for different assets or timeframes is common. For example, traders may use a lower AF for volatile cryptocurrencies to avoid excessive false signals, or a higher AF for blue-chip stocks to catch quicker reversals. Always backtest any parameter changes to see how they perform on historical data.
Most trading platforms use the original settings suggested by Wilder, but tweaking them can help balance early signals with the risk of false positives.
Parabolic SAR vs. Other Trend Indicators
How does the parabolic sar indicator compare to tools like moving averages, MACD, or ATR trailing stops? Its unique “stop and reverse” logic stands out. Unlike moving averages, which lag and smooth price, the parabolic sar indicator can generate faster signals, especially in strong trends.
However, moving averages and MACD often perform better in choppy or sideways markets, as the parabolic sar indicator may produce too many false flips. ATR stops, meanwhile, are more adaptive to volatility but lack the visual “flip” that makes the SAR so intuitive.
Here’s a quick comparison:
| Indicator | Best For | Signal Speed | Visual Clarity |
|---|---|---|---|
| Parabolic SAR | Strong trends | Fast | High |
| Moving Avg | Smoothing trend | Medium | Medium |
| MACD | Momentum/Trend | Medium | Medium |
| ATR Stop | Volatility stops | Slow | Low |
For traders focused on capturing clear, strong trends, the parabolic sar indicator is often a preferred choice—especially when used alongside other confirmation tools.
How to Set Up and Read the Parabolic SAR in 2025
Setting up and mastering the parabolic sar indicator is essential for traders aiming to stay ahead in 2025. Whether you’re new to technical analysis or looking to refine your strategy, the following steps break down the process for any trading platform or asset class.
Step 1: Adding Parabolic SAR to Your Chart
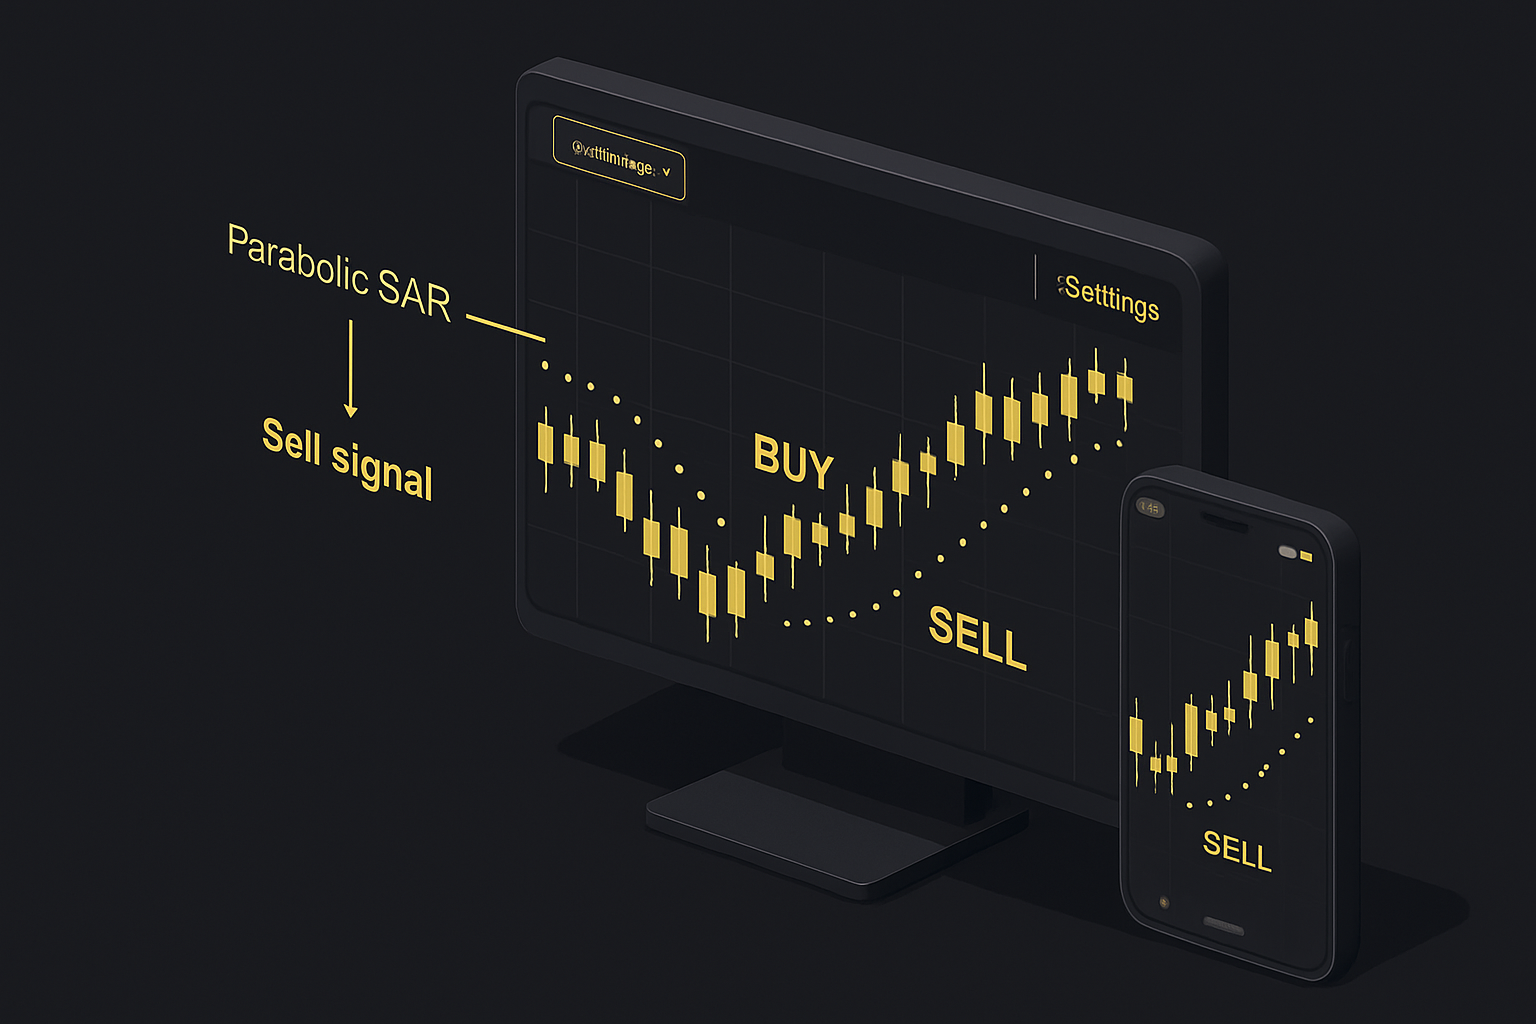
Most major trading platforms—like TradingView, MetaTrader, and Thinkorswim—support the parabolic sar indicator by default. To add it, simply open your chart, search for “Parabolic SAR” in the indicators list, and select it.
Once applied, you’ll see a series of dots above or below your price bars. These dots are the core of the parabolic sar indicator, visually signaling trend direction.
For example, on TradingView:
- Click “Indicators”
- Type “Parabolic SAR”
- Click to add it to your chart
You can adjust colors and dot size for clarity. A clean, readable chart helps you react quickly to new signals.
Step 2: Configuring Parabolic SAR Settings
Customizing the parabolic sar indicator settings tailors it to your trading style. The default parameters are usually:
- Acceleration Factor (AF): 0.02
- Maximum AF: 0.20
For forex or crypto, you might lower the AF to smooth out signals in choppier markets. Swing traders may prefer the default, while scalpers could experiment with higher sensitivity for faster entries.
Example configuration for a volatile asset:
AF: 0.01
Max AF: 0.10
Always backtest changes before going live. Avoid overfitting—what works in one market or timeframe might not work in another. Each asset class may need its own optimal setup for the parabolic sar indicator.
Step 3: Interpreting Parabolic SAR Signals
Reading the parabolic sar indicator is straightforward. When the dots flip below the price, it’s a bullish signal—consider buying. When the dots flip above, it’s bearish—think about selling or exiting.
- Buy: Dot appears below the price bar
- Sell: Dot appears above the price bar
In trending markets, these flips often mark strong moves. However, in sideways action, the indicator can give false signals. For a deeper dive on interpreting these signals, see this Parabolic SAR Indicator Explained resource.
Always confirm signals with price action or another indicator to avoid whipsaws.
Step 4: Setting Trailing Stops with Parabolic SAR
The parabolic sar indicator shines as a dynamic stop-loss tool. As the trend continues, simply move your stop to the level of the most recent SAR dot. This way, your stop-loss “trails” the price, locking in profits as the trend extends.
- In an uptrend, move stops up to the latest SAR dot below price
- In a downtrend, trail stops down to the SAR dot above price
This automatic adjustment helps limit losses and protect gains. Adjust stop placement for volatility—wider for choppy assets, tighter for stable ones. Integrate this with your risk management plan for best results.
Step 5: Common Reading Mistakes and How to Avoid Them
A frequent pitfall is relying solely on the parabolic sar indicator in ranging or sideways markets. In these conditions, SAR flips can trigger whipsaws, leading to unnecessary losses.
To avoid this:
- Combine SAR with trend filters or volume indicators
- Align your trading timeframe with the dominant market trend
- Watch for false flips during low volatility
For example, during consolidation, wait for a confirmed breakout before acting on a SAR signal. The parabolic sar indicator works best in clear, strong trends—context and confirmation are key to success.
Parabolic SAR Trading Strategies for 2025
Navigating the ever-changing markets in 2025 demands robust strategies centered around the parabolic sar indicator. Whether you’re trend-hunting, seeking reversals, or building AI-powered systems, mastering these approaches can revolutionize your trading results. Let’s break down the most effective ways to deploy this versatile tool.

Trend-Following Strategies
The bread and butter for most traders using the parabolic sar indicator is trend-following. Here, you enter a position when the indicator flips—dots moving below the price signal a bullish trend, while dots above signal bearishness.
- Enter long trades when a dot appears below the price in a strong uptrend.
- Place your initial stop-loss at the current SAR dot level.
- As the trend continues, trail your stop along with the moving SAR dots.
- Maximize gains by letting profits run—don’t exit until the SAR flips again.
Filtering with a moving average helps confirm the overall market direction. For example, on EUR/USD, waiting for both the SAR flip and the price above a 50-period moving average can keep you on the right side of a trend. Studies show the parabolic sar indicator works best in markets with more than 60% trending periods.
Reversal and Countertrend Strategies
While trend-following is safer, some traders leverage the parabolic sar indicator to spot reversals. After a prolonged move, a SAR flip can signal a potential change in direction.
- Combine SAR flips with support and resistance zones for higher reliability.
- Confirm with a momentum indicator like RSI to avoid jumping in too early.
- For example, after an extended rally, a SAR dot above the price near a resistance level can warn of a possible downturn.
Keep in mind, countertrend trades carry a higher risk of false signals. Always use tight stop-losses and consider reducing your position size. The parabolic sar indicator can help you catch the early stages of a reversal, but confirmation is key.
Combining Parabolic SAR with Other Indicators
No single tool is flawless. That’s why many traders pair the parabolic sar indicator with complementary indicators for more robust setups.
- Use RSI to confirm overbought/oversold conditions before acting on a SAR flip.
- Combine with MACD—wait for both a MACD crossover and a SAR flip for higher probability trades.
- Adjust SAR sensitivity using ATR to match current volatility.
Keep your charts uncluttered. Too many indicators can lead to analysis paralysis. One effective setup is to trade only when both the parabolic sar indicator and a secondary tool (like RSI or MACD) agree, filtering out weaker signals.
Multi-Timeframe Analysis with Parabolic SAR
A game-changer for many in 2025 is aligning the parabolic sar indicator across multiple timeframes. This helps filter out noise and improves accuracy.
- Check for SAR agreement on daily, 4H, and 1H charts before entering a trade.
- Only act when all timeframes show the same trend direction.
- This technique reduces whipsaws and sharpens your entries.
For a deeper dive, explore multi-timeframe trading analysis to see how this approach can transform your strategy. By layering the parabolic sar indicator signals, you filter out random market moves and focus on high-probability trends.
Parabolic SAR for Different Asset Classes
The parabolic sar indicator isn’t just for forex—it excels across stocks, crypto, commodities, and indices.
- In forex, its popularity stems from high-frequency trading and strong trends.
- For crypto, use a lower acceleration factor (AF) to smooth out volatility.
- Stocks and indices may require a higher AF for quicker signal response.
For example, the SAR performs differently on Bitcoin’s wild swings versus the S&P 500’s steadier moves. Adjust your settings to suit the asset’s nature. The parabolic sar indicator remains a favorite for automated trading bots in fast-moving markets.
Backtesting and Optimizing Parabolic SAR Strategies
Before risking capital, backtest the parabolic sar indicator on historical data. This reveals strengths, weaknesses, and potential for improvement.
- Use platforms like TradingView or MetaTrader to run SAR backtests.
- Track win rate, profit factor, and drawdown to assess performance.
- For instance, a SAR strategy on EUR/USD (2010–2024) might show steady profits but occasional drawdowns during choppy periods.
Avoid over-optimizing—tuning your strategy too closely to past data can hurt future results. The parabolic sar indicator shines when you refine your approach over time, regularly testing and adjusting for changing market conditions.
Integrating AI-Powered Tools with Parabolic SAR
2025 is the year of AI in trading, and the parabolic sar indicator is no exception. AI-powered tools now filter and confirm SAR signals faster and more accurately than ever.
- Use AI-driven indicators to confirm the trend before acting on a SAR flip.
- Benefit from reduced noise, improved win rates, and quicker decision-making.
- For example, an AI tool might scan multiple markets, alerting you only when both the SAR and its own algorithms spot a high-confidence trend.
With more traders adopting AI-enhanced strategies, the parabolic sar indicator becomes even more powerful—especially for those embracing new technology.
Advanced Tips, Customizations, and Common Pitfalls
Mastering the parabolic sar indicator requires more than adding it to your charts. To elevate your trading in 2025, it’s crucial to fine-tune settings, automate processes, and avoid common pitfalls. Let’s explore advanced strategies, real-world insights, and the most persistent myths about this iconic indicator.
Fine-Tuning Parabolic SAR for Volatility
Volatility can make or break your use of the parabolic sar indicator. Adjusting its AF (Acceleration Factor) and max AF lets you adapt to the asset’s price swings.
For highly volatile assets like cryptocurrencies, try lowering the AF below the default 0.02. This smooths out erratic price moves and reduces whipsaws. For blue-chip stocks or stable indices, a higher AF can offer quicker responses to trend shifts.
Pairing the parabolic sar indicator with a volatility filter, such as ATR (Average True Range), helps further. For example, only act on SAR signals when ATR is above a certain threshold.
- Lower AF for crypto: smoother, less noise.
- Higher AF for stocks: more responsive.
- Use ATR to filter out low-volatility periods.
Always backtest any parameter changes before trading live. Dynamic adjustment—tuning SAR parameters as market conditions change—can unlock new levels of precision.
Avoiding Common Parabolic SAR Mistakes
Even experienced traders stumble with the parabolic sar indicator. The biggest trap? Overtrading in sideways markets where SAR flips frequently, creating false signals.
Other mistakes include ignoring news events that disrupt trends, and relying on SAR alone without confirming with other indicators. For example, pairing the parabolic sar indicator with RSI can help filter out weak signals—see this RSI index explained guide for details.
| Mistake | Solution |
|---|---|
| Overtrading in ranges | Wait for clear trends |
| Ignoring news/events | Monitor economic calendars |
| No confirmation | Combine with RSI or moving averages |
Patience and discipline are your best allies. Always consider the broader market context before acting on SAR signals.
Custom Alerts and Automation in 2025
Automation is revolutionizing how traders use the parabolic sar indicator. Setting up custom alerts means you never miss a signal—even on the go.
Modern platforms let you trigger notifications when SAR flips, or even execute trades automatically based on your criteria. Here’s a simple pseudo-code example for a trading bot:
if parabolic_sar_indicator.flip == 'buy':
 execute_trade('long')
elif parabolic_sar_indicator.flip == 'sell':
 execute_trade('short')
For a deeper dive into integrating the parabolic sar indicator with smart automation and AI-driven tools, check out these AI-powered trading signals. Automation delivers speed, consistency, and takes emotion out of the equation—but always monitor bots for unexpected market shifts.
Parabolic SAR in Algorithmic and Quantitative Trading
The parabolic sar indicator is a staple in many algorithmic strategies. It’s often combined with moving average crossovers or other trend filters to build robust, rules-based systems.
Backtesting is key—use platforms like TradingView Pine Script or Python’s backtrader to simulate performance across years of data. Many retail algo traders now rely on SAR for its objectivity and adaptability.
Tips for integrating the parabolic sar indicator in quant strategies:
- Combine with momentum or volatility filters.
- Regularly review and refine your code.
- Monitor system drawdowns and adjust settings as needed.
Algorithmic trading with SAR is growing fast, especially as retail tools become more sophisticated in 2025.
Case Studies: Real-World Parabolic SAR Applications
Looking at real market cycles, the parabolic sar indicator has delivered both stunning wins and frustrating whipsaws. In the 2020–2024 bull and bear markets, SAR excelled in strong trends—locking in profits during rallies and cutting losses in downturns.
For instance, a backtest on EUR/USD from 2010–2024 revealed that SAR-based strategies outperformed simple moving averages when the market trended over 60% of the time. However, in choppy periods, SAR struggled without additional filters.
Lessons from top traders:
- Use the parabolic sar indicator as part of a toolkit, not in isolation.
- Backtest across different market regimes.
- Adjust parameters to fit asset volatility.
For a broader perspective, compare SAR’s performance with other tools in this Trading indicators overview.
Myths and Misconceptions about Parabolic SAR
There are plenty of myths surrounding the parabolic sar indicator. Some believe it guarantees perfect trend detection—reality check: no indicator is foolproof.
Another misconception is that SAR is only useful for forex. In truth, it works across stocks, crypto, indices, and commodities. If you want a deeper historical and technical context, see the Parabolic SAR Indicator Overview for a full breakdown.
Common Myths Table:
| Myth | Reality |
|---|---|
| SAR never fails | All indicators can give false signals |
| Only for forex | Works in many asset classes |
| Always leads the market | SAR can lag at turning points |
By busting these myths, you’ll use the parabolic sar indicator more wisely and confidently in your 2025 trading journey.
Parabolic SAR Indicator in Modern Trading Platforms
Modern trading platforms have revolutionized the way traders access and use the parabolic sar indicator. Whether you’re a beginner or a seasoned pro, the right platform can make a world of difference in how you analyze trends, set alerts, and automate strategies.
Platform-Specific Features and Enhancements
The parabolic sar indicator is widely available on major platforms like TradingView, MetaTrader, and Thinkorswim. Each offers unique features to help traders get the most out of this powerful tool.
For example, TradingView provides customizable chart overlays, color-coded SAR dots, and scriptable alerts. MetaTrader stands out with its robust automation and expert advisor support, while Thinkorswim offers deep customization and backtesting.
Here’s a quick comparison:
| Platform | Customization | Alerts | Automation | User Adoption |
|---|---|---|---|---|
| TradingView | High | Yes | Limited | Very High |
| MetaTrader | Moderate | Yes | Full EA | High |
| Thinkorswim | Advanced | Yes | Scripting | Moderate |
Choosing the right platform for the parabolic sar indicator depends on your need for flexibility, automation, and ease of use.
Mobile and On-the-Go Trading with Parabolic SAR
In 2025, traders demand flexibility. The parabolic sar indicator is now fully accessible on mobile apps from all major platforms, making it easier than ever to monitor trends while on the move.
With mobile trading, you can set up instant alerts for SAR flips, receive push notifications, and manage trades—even while traveling. This is a game-changer for day traders and swing traders who need to react quickly to shifting market trends.
Picture checking your parabolic sar indicator signals during your commute or adjusting trailing stops at a coffee shop. Mobile-first experiences let you stay connected, responsive, and ahead of the curve.
Integrating Parabolic SAR with AI-Powered Signal Tools
AI is reshaping the trading landscape, and the parabolic sar indicator is no exception. Many platforms now allow you to combine SAR signals with AI-driven trend analysis for smarter decision-making.
For instance, AI tools can filter out false SAR flips, confirm trend strength, and even suggest optimal entry and exit points. In crypto trading, AI-enhanced SAR setups have shown higher win rates and fewer whipsaws compared to manual analysis alone.
By merging the parabolic sar indicator with machine learning, traders can cut through market noise, improve consistency, and make faster, more confident trades.
How PipTrend AI-Powered Indicator Amplifies Parabolic SAR Strategies
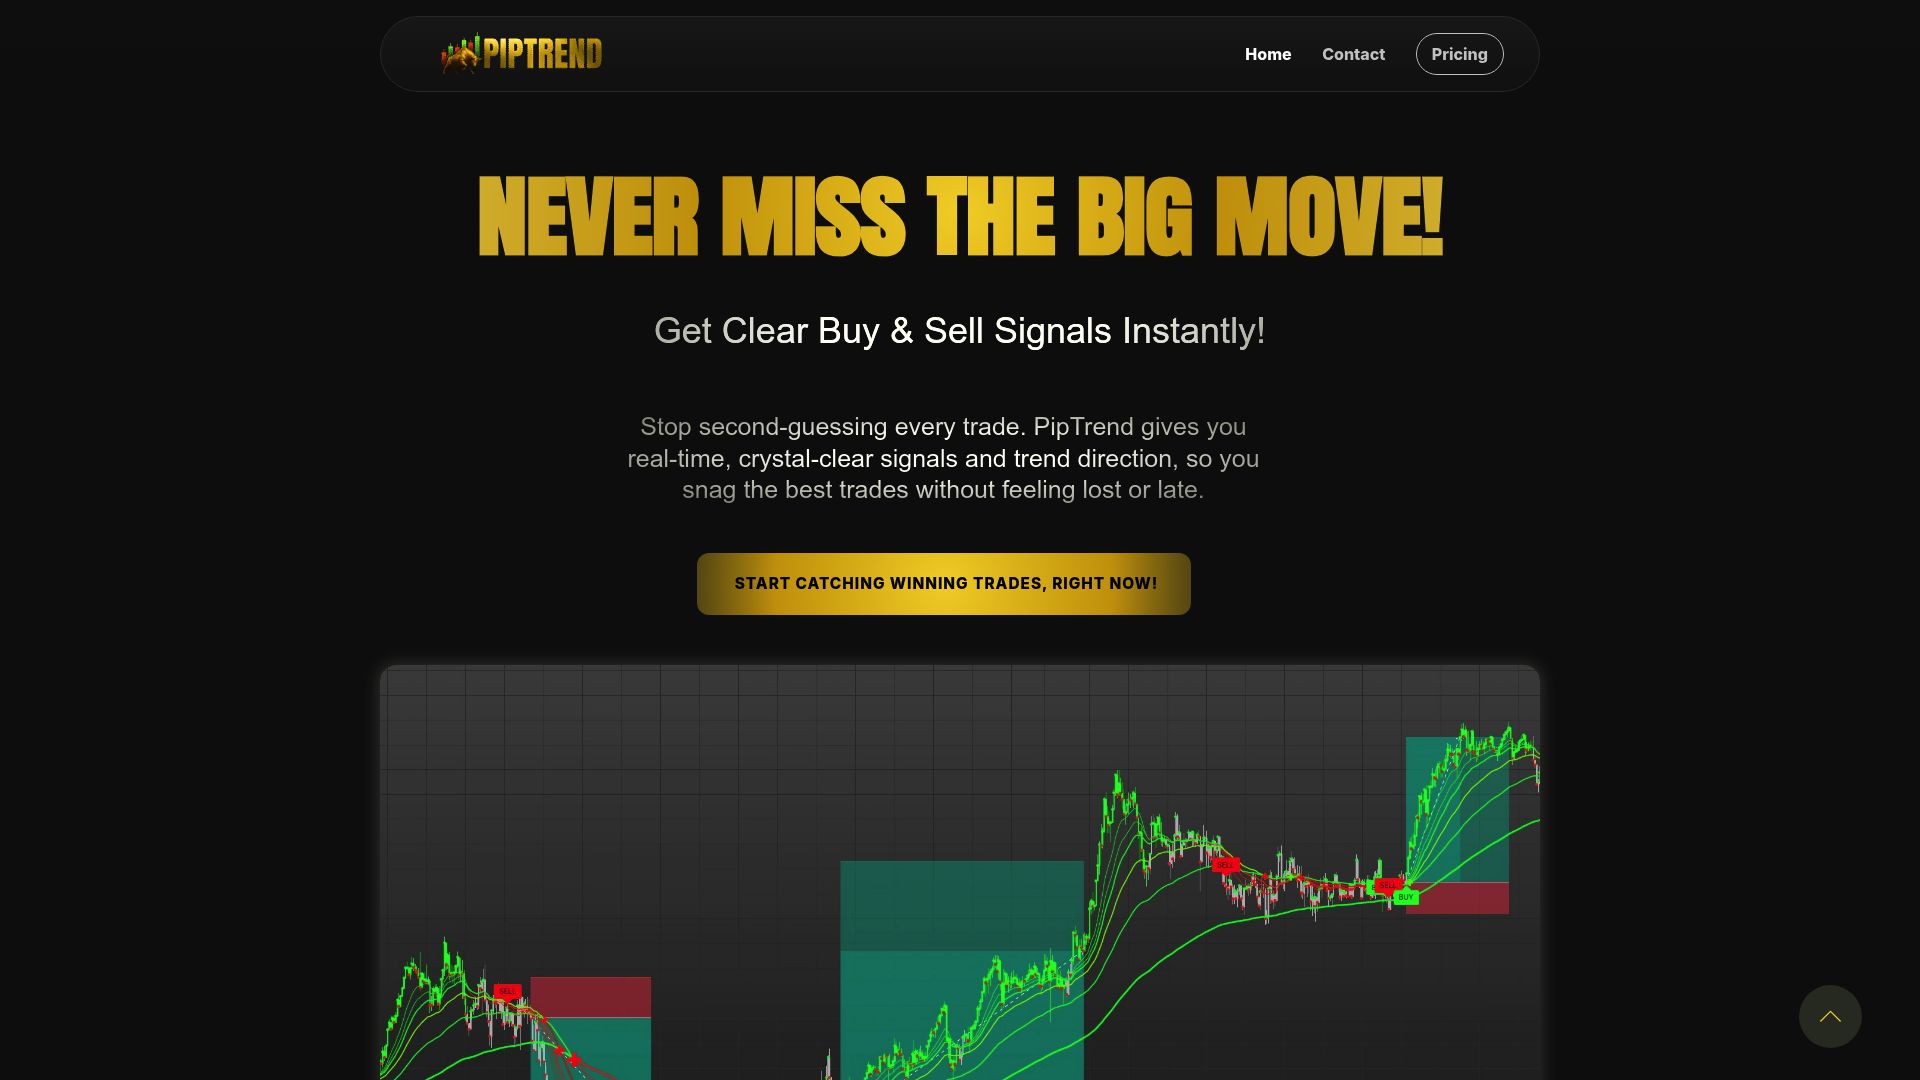
PipTrend takes the parabolic sar indicator to the next level by offering real-time, AI-powered buy and sell signals that work seamlessly with TradingView. It confirms SAR trend direction, reducing the risk of false triggers and making trade timing much more precise.
Key PipTrend features include:
- Multi-timeframe dashboard for holistic trend views
- Instant alerts for SAR flips and session liquidity
- Simple interface for beginners, robust tools for advanced users
Imagine getting an alert from PipTrend when the parabolic sar indicator signals a trend change—no more second-guessing or missed opportunities. With PipTrend, you can trade forex, crypto, and stocks with greater confidence and consistency.
Future Developments: Parabolic SAR and Emerging Technologies
Looking ahead, the parabolic sar indicator will continue to evolve alongside emerging technologies. Expect trading platforms to offer smarter automation, adaptive SAR parameters, and integration with predictive analytics.
For example, platforms may use real-time market data to automatically adjust SAR sensitivity based on volatility. Enhanced mobile and AI-driven features will further streamline analysis and trade execution.
As automation and machine learning become standard, the parabolic sar indicator will remain at the heart of technical analysis—helping traders adapt, innovate, and thrive in the fast-changing markets of 2025.
Now that you know how the Parabolic SAR indicator works and how it fits into a smart trading strategy for 2025, why not take your trading to the next level? If you want more confident entries, instant alerts, and fewer false signals, pairing Parabolic SAR with AI-powered tools can make all the difference. With PipTrend, you get real-time, easy-to-understand buy and sell signals that work across forex, crypto, stocks, and more—so you can focus on making better decisions, not guessing. Ready to see your results improve? See Your Trading Improve With PipTrend