
Mastering the MACD indicator could be your edge in the fast-evolving trading landscape of 2025. As markets become more dynamic and technology-driven, traders need reliable tools to stay ahead.
This guide offers a comprehensive, up-to-date look at how to use the MACD indicator for consistent trading success. You'll discover the basics and theory, advanced strategies, real-world trading examples, tips for settings optimization, and ways to avoid common pitfalls.
Curious about how the MACD fits into modern trading systems? We’ll break it all down step by step, so you can turn knowledge into actionable results. Let’s unlock your trading potential together.
Understanding the MACD Indicator: Fundamentals and Theory
The macd indicator stands as one of the most recognized and widely used tools in technical analysis, offering traders a clear snapshot of market momentum and trend direction. Developed in 1977 by Gerald Appel, the macd indicator was designed to simplify complex market data, providing immediate, actionable insights for traders across asset classes.
What is MACD? Origins and Purpose
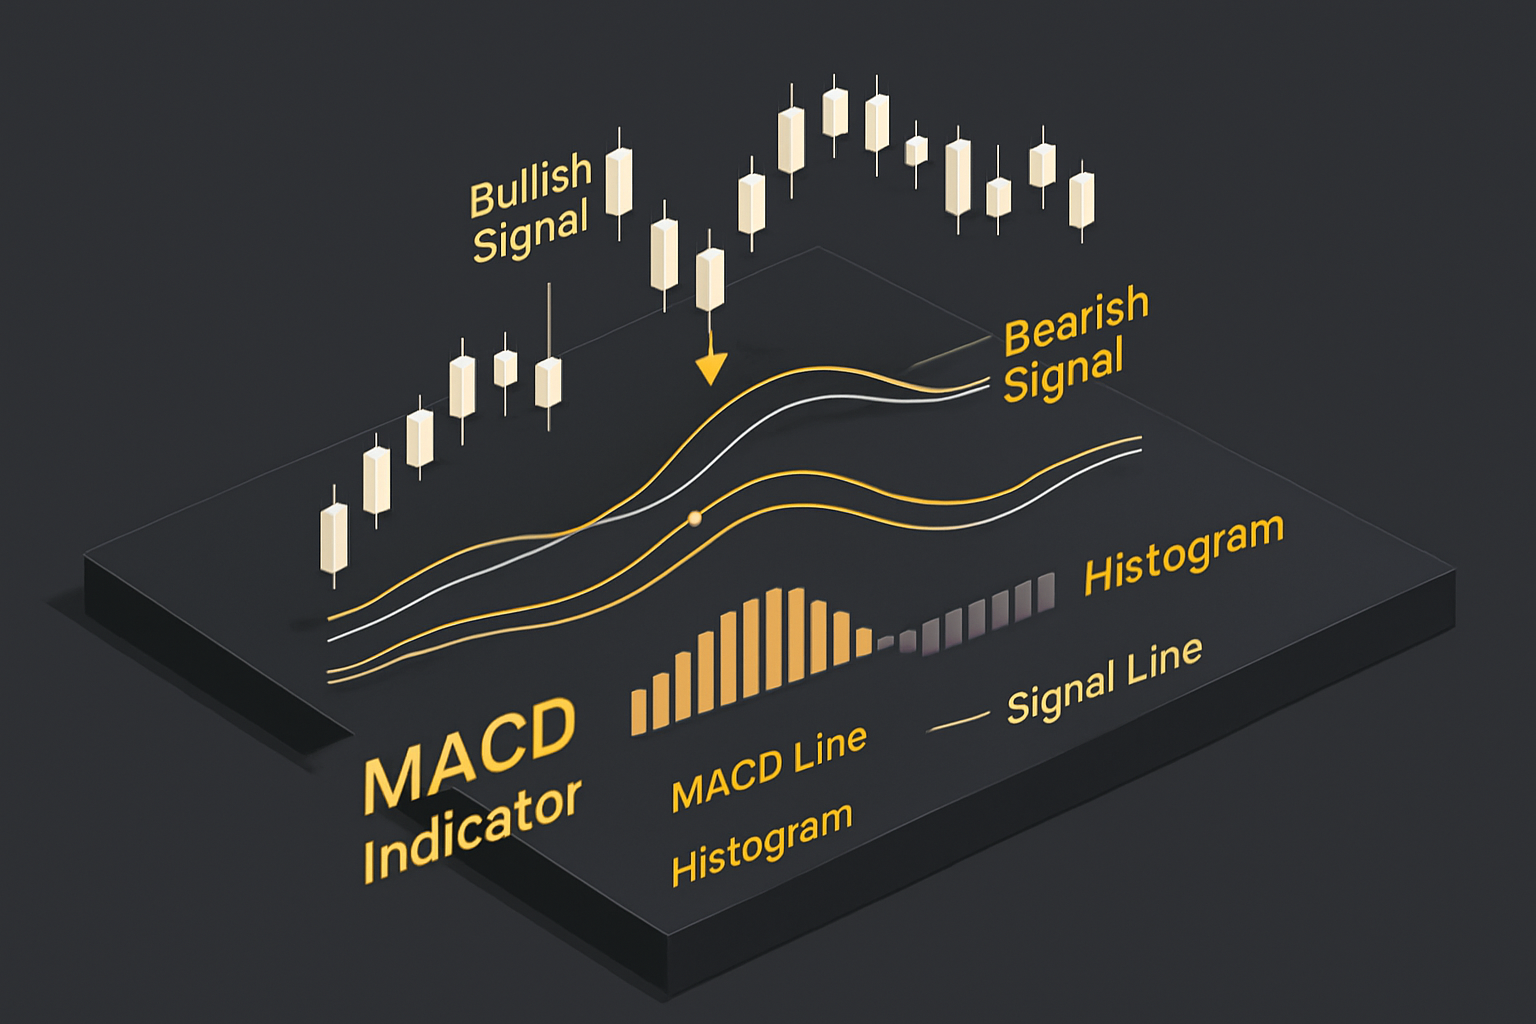
The macd indicator, short for Moving Average Convergence Divergence, is a momentum and trend-following indicator. It was invented by Gerald Appel in the late 1970s to help traders spot changes in the strength, direction, and duration of price trends. Even in 2025, the macd indicator remains a favorite for its clarity and adaptability in fast-moving markets.
At its core, the macd indicator consists of three key components:
| Component | Description |
|---|---|
| MACD Line | Difference between two EMAs (usually 12 & 26) |
| Signal Line | EMA (usually 9-period) of the MACD line |
| Histogram | Visualizes the distance between MACD & Signal |
The macd indicator is classified as a lagging indicator, meaning it follows price movements rather than predicting them. This is in contrast to leading indicators, which attempt to forecast future price action. By tracking the relationship between two exponential moving averages (EMAs), the macd indicator offers a straightforward visual representation of trend shifts and momentum.
Its mathematical foundation is simple: subtract the 26-period EMA from the 12-period EMA. The result forms the MACD line. The signal line, typically a 9-period EMA of the MACD line, acts as a smoother, helping traders filter out noise. The histogram then displays the difference between the MACD and signal lines, making momentum changes easy to spot.
To dig deeper into the history, calculation, and practical uses of the macd indicator, you can review this MACD Indicator Overview for additional context.
How MACD Works: Calculation and Interpretation
Understanding how the macd indicator is calculated and interpreted is crucial for effective trading. Here’s a step-by-step breakdown:
- Calculate the 12-period EMA and 26-period EMA of the asset’s closing price.
- Subtract the 26-period EMA from the 12-period EMA to get the MACD line.
- Calculate the 9-period EMA of the MACD line—this is the signal line.
- Plot the histogram as the difference between the MACD line and the signal line.
MACD Line = 12-period EMA - 26-period EMA
Signal Line = 9-period EMA of MACD Line
Histogram = MACD Line - Signal Line
The zero line holds significance: when the MACD line crosses above zero, it often signals bullish momentum, while a cross below zero suggests bearish momentum. Crossovers between the MACD and signal lines are classic entry or exit signals. A bullish crossover occurs when the MACD line rises above the signal line, and a bearish crossover occurs when it falls below.
The histogram’s bars provide a quick visual cue for momentum shifts. Growing bars above zero indicate increasing bullish momentum, while shrinking bars below zero suggest waning bearish momentum.
The macd indicator excels in its simplicity, versatility, and adaptability across different markets, including forex, stocks, and crypto. However, its lagging nature means it can occasionally produce delayed signals, especially in highly volatile conditions. Despite this, traders value the macd indicator for its ability to confirm trends and highlight potential reversals, making it a cornerstone of modern technical analysis.
Setting Up MACD for Trading in 2025: Platforms, Settings, and Customization
Choosing the right setup for the macd indicator is your first step toward trading success in 2025. With new platforms and evolving technology, getting started has never been easier—or more customizable.

Choosing the Right Trading Platform
Today’s traders expect seamless access to the macd indicator across a variety of platforms. Whether you’re using TradingView, MetaTrader 4/5, or your broker’s proprietary software, most charting tools provide built-in support for the macd indicator.
Here’s a quick comparison of popular platforms:
| Platform | MACD Access | Customization | User Experience |
|---|---|---|---|
| TradingView | Yes | High | Intuitive, web-based |
| MetaTrader 4/5 | Yes | Moderate | Desktop focus |
| Broker Platforms | Yes | Varies | Depends on broker |
To add the macd indicator, simply open your chart, find the “Indicators” menu, and select MACD. Each platform offers different customization panels—some let you tweak colors, line styles, and data sources. For more on how the macd indicator fits into broader strategies, visit the Trading Indicators Overview for a comprehensive look.
When customizing, look for features like:
- Adjustable period lengths
- Color coding for clarity
- Overlay options on price charts
This flexibility ensures the macd indicator adapts to your unique workflow.
MACD Settings: Defaults vs. Customization
The default settings for the macd indicator are 12, 26, and 9 periods. These numbers balance responsiveness with reliability, making them suitable for most markets. However, 2025’s fast-paced environment means traders often tweak these values.
- Shorter periods (e.g., 8, 21, 5) make the macd indicator more sensitive, ideal for intraday or high-volatility assets.
- Longer periods (e.g., 24, 52, 18) smooth out signals, better for swing or position trading.
Consider this example:
Default: MACD(12,26,9)
Custom: MACD(8,21,5)
A custom setup may generate earlier signals but can also increase noise. The pros of customizing the macd indicator include tailored responsiveness and better alignment with your trading style. The cons? More false signals in choppy markets.
When optimizing, test your settings across various assets—forex, stocks, and crypto each react differently. Compare results side-by-side to see which configuration delivers the clearest signals for your strategy.
Best Practices for 2025 Market Conditions
Markets in 2025 are more volatile and algorithm-driven than ever before. To keep the macd indicator effective, adapt it to current conditions. Combine it with support and resistance levels or moving averages to filter out noise.
Consider these best practices:
- Use the macd indicator alongside other indicators for confirmation.
- Adjust settings when volatility spikes.
- Save custom templates to streamline your workflow.
Recent trading data shows a growing trend of integrating the macd indicator into multi-indicator systems. This approach helps traders avoid common pitfalls and stay ahead in rapidly shifting markets.
Review your macd indicator regularly, and don’t hesitate to refine your approach as technology and markets evolve.
How to Trade with MACD: Step-by-Step Strategies for Entry and Exit
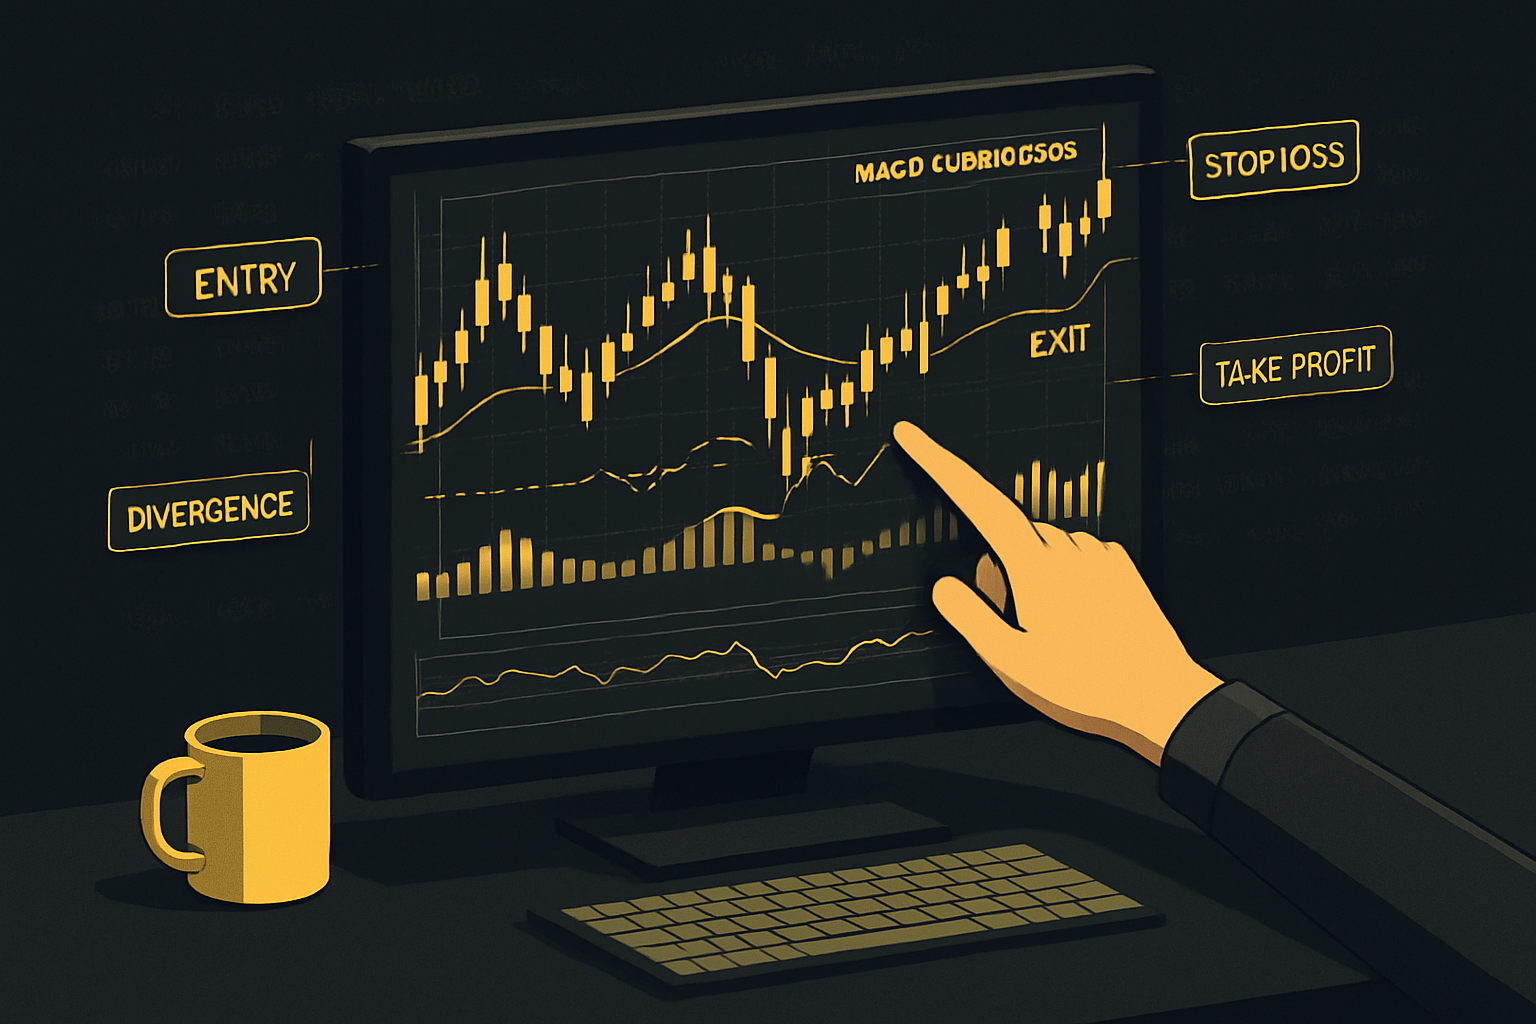
Unlocking the full power of the macd indicator means following a disciplined, step-by-step process. Whether you’re a beginner or a seasoned trader, understanding each stage will help you spot opportunities and manage risk more effectively. Let’s break down how to approach trading with the macd indicator for the best results in 2025.
Step 1: Identifying MACD Crossovers
The most common macd indicator signal is the crossover. This occurs when the MACD line crosses above (bullish) or below (bearish) the signal line. A bullish crossover suggests the momentum is shifting upward, while a bearish crossover hints at potential downward movement.
To increase reliability, always look for confirmation before acting. Combine the crossover with price action—such as a breakout above resistance for bullish signals, or a fall below support for bearish ones. Volume spikes can also support the validity of the signal.
Example:
- Bullish crossover: MACD line moves above the signal line, price breaks resistance, volume increases.
- Bearish crossover: MACD line drops below the signal line, price falls through support, volume rises.
A quick checklist for crossover trades:
- Is the crossover clear and decisive?
- Do price and volume confirm the signal?
- Are there any major news events that could impact the move?
Using the macd indicator this way helps traders enter trades with greater confidence and clarity.
Step 2: Using MACD Histogram for Momentum Analysis
The histogram is a key visual tool of the macd indicator. It represents the difference between the MACD line and the signal line. When the histogram bars grow taller (either positive or negative), it signals increasing momentum. Shrinking bars indicate momentum is fading.
Here’s how to interpret the histogram:
- Expanding above zero: Bullish momentum is increasing.
- Expanding below zero: Bearish momentum is building.
- Shrinking toward zero: Momentum is weakening, potential reversal ahead.
Spotting momentum shifts early can give you an edge. For example, if the histogram starts shrinking after a strong trend, it’s often a warning sign that a reversal may be on the horizon.
Example:
- Price continues to rise, but histogram bars start shrinking—momentum is stalling, and a reversal may follow.
Integrating histogram analysis with the macd indicator enables traders to anticipate trend changes more accurately.
Step 3: Confirming Trades with Divergence
Divergence is a powerful concept when using the macd indicator. It occurs when the price makes a new high or low, but the MACD does not follow suit. This disconnect often signals a potential reversal.
Types of divergence:
- Bullish divergence: Price makes a lower low, but MACD forms a higher low. This suggests bears are losing control.
- Bearish divergence: Price hits a higher high, but MACD shows a lower high. Bulls may be running out of steam.
To spot divergence, closely compare price action and the macd indicator. Look for double tops or bottoms on price that aren’t confirmed by the MACD.
Example:
- Double bottom on price, but MACD forms a higher low—bullish divergence and a possible upward move.
Divergence adds another layer of confirmation, helping filter out false signals from the macd indicator.
Step 4: Combining MACD with Other Indicators
No single tool is perfect. Combining the macd indicator with others like moving averages, volume, or the RSI can significantly boost trade reliability. For instance, using the RSI alongside MACD can help confirm whether a trend is overbought or oversold, providing added confidence in your entries and exits.
Multi-timeframe analysis is also valuable. By checking MACD signals on higher and lower timeframes, you can avoid getting caught in short-term noise.
Here’s a sample workflow:
- Identify a MACD crossover on the daily chart.
- Check if the RSI supports the trend direction (RSI Indicator Strategies).
- Look for confirmation on a 4-hour or 1-hour chart.
Layering these techniques allows you to fine-tune your trades and reduce the likelihood of acting on weak signals from the macd indicator.
Step 5: Managing Risk and Setting Targets
Effective risk management is crucial when trading with the macd indicator. Always use stop-loss and take-profit orders to protect your capital. Place your stop-loss just beyond recent support or resistance, depending on trade direction.
Tips for risk management:
- Only risk a small percentage of your account per trade.
- Filter out false signals by waiting for strong confirmation from both the MACD and other indicators.
- Review your trades regularly to identify patterns and improve your strategy.
Example Risk Plan Table:
| Trade Setup | Entry Signal | Stop-Loss Placement | Take-Profit Target |
|---|---|---|---|
| Bullish Crossover | MACD > Signal | Below recent swing | Next resistance |
| Bearish Crossover | MACD < Signal | Above recent swing | Next support |
By following these steps and respecting the signals from the macd indicator, you can develop a trading plan that adapts to changing markets and protects your bottom line.
Advanced MACD Techniques and Real-World Applications
The macd indicator remains a cornerstone of technical analysis, but its true power shines when combined with advanced techniques and real-world adaptation. Traders in 2025 need more than just the basics—they require a toolkit to thrive in various market environments, across asset classes, and with modern trading technology.

MACD in Different Market Conditions
The macd indicator adapts to both trending and ranging markets, but successful traders adjust their approach based on current conditions. In strong trends, MACD crossovers and histogram expansions often provide clear signals. However, in choppy or ranging markets, the indicator can produce "whipsaw" signals—false positives that lead to losses.
High volatility in 2025, fueled by increased algorithmic trading and AI-driven market moves, makes the macd indicator even more dynamic. Traders must watch for sudden momentum shifts, as algorithms can trigger rapid price changes that the indicator may lag behind.
To stay ahead, consider combining the macd indicator with volatility filters or wait for confirmation from price action. For example, only act on MACD crossovers when accompanied by a breakout from established support or resistance. This approach helps reduce the risk of trading on noise rather than genuine market movement.
Multi-Timeframe MACD Analysis
One of the most effective ways to enhance the reliability of the macd indicator is through multi-timeframe analysis. By aligning MACD signals across daily, 4-hour, and 15-minute charts, traders can filter out weaker signals and focus on higher-probability setups.
For instance, if the daily macd indicator shows a bullish crossover and the 4-hour chart confirms upward momentum, a trader can look for entry points on the 15-minute chart. This layered approach increases confidence and sharpens timing.
To dive deeper into this strategy, check out the Multi-Timeframe Analysis Guide, which offers step-by-step instructions for optimizing MACD strategies across multiple chart intervals.
Multi-timeframe analysis is especially valuable in fast-moving markets like crypto or during high-impact news events. It helps traders avoid jumping into trades based on isolated signals, which is a common pitfall when using only a single timeframe.
MACD for Various Asset Classes
The macd indicator is uniquely versatile, working across forex, stocks, and cryptocurrencies. In forex, the indicator helps navigate the volatility of currency pairs, revealing trend reversals and momentum shifts that may not be obvious from price alone.
For stocks, the macd indicator excels at highlighting reversals after extended rallies or pullbacks. Traders often use it to spot divergence between price and momentum, signaling potential turning points.
In the crypto market, the macd indicator's sensitivity is both a strength and a challenge. Rapid price swings can generate frequent signals, so traders must use additional filters to avoid overtrading. Case studies show that combining MACD with support/resistance levels improves results in bitcoin and altcoin trades.
Here's a quick comparison of MACD usage across asset classes:
| Asset Class | Typical MACD Application | Key Consideration |
|---|---|---|
| Forex | Trend/momentum detection | Volatility, news events |
| Stocks | Reversals/divergence | Earnings, sector trends |
| Crypto | Fast trend shifts, scalping | High volatility, 24/7 market |
No matter the market, the macd indicator adapts to different timeframes and trading styles, making it a core tool for diversified portfolios.
Avoiding Common Pitfalls and False Signals
Despite its strengths, the macd indicator is not immune to false signals—especially during sideways or highly volatile markets. "Whipsaws" occur frequently when the market lacks clear direction, leading to losses if not managed properly.
To filter out fake signals, always consider context. Look for confluence with support/resistance, trendlines, or other indicators like RSI. Many traders also check volume to confirm whether a MACD signal is backed by strong market participation.
Statistical studies show that shorter timeframes tend to produce more false MACD signals, while higher timeframes offer greater reliability. For example, a 5-minute chart may give three times as many false crossovers as a daily chart.
A simple checklist for filtering MACD signals:
- Confirm with price action (e.g., breakout or reversal)
- Check volume for supporting evidence
- Use multi-timeframe confirmation
- Avoid trading during major news releases
By applying these best practices, traders can harness the full potential of the macd indicator while minimizing unnecessary risk.
Optimizing MACD for Personal Trading Styles and Automation
Every trader approaches the market differently, so optimizing the macd indicator for your unique style is essential. Whether you’re a swing trader, day trader, or scalper, small adjustments can make a big difference. The macd indicator’s flexibility allows you to fine-tune its settings, aligning signal sensitivity with your trading timeframe and risk appetite.
For example, a day trader might shorten the standard 12, 26, 9 periods to 6, 13, 5 to capture faster momentum shifts. A swing trader may stick with defaults, or even lengthen the settings for smoother, more reliable signals. Here’s a simple comparison:
| Trading Style | MACD Fast EMA | MACD Slow EMA | Signal Line | Typical Use |
|---|---|---|---|---|
| Scalping | 5 | 13 | 3 | Quick entries/exits |
| Day Trading | 6 | 13 | 5 | Intraday trends |
| Swing Trading | 12 | 26 | 9 | Multi-day moves |
By testing different configurations, you can discover which macd indicator setup fits your strategy best. Always backtest and monitor performance before committing real capital to new settings.
Automation is the next frontier for traders using the macd indicator. In 2025, algorithmic trading and AI have become mainstream, allowing traders to execute strategies with speed and precision. Many platforms enable you to code or use pre-built bots that follow macd indicator signals for entries and exits.
A basic MACD bot logic might look like this:
if macd_line > signal_line and previous_macd_line <= previous_signal_line:
 place_buy_order()
elif macd_line < signal_line and previous_macd_line >= previous_signal_line:
 place_sell_order()
This script automates the classic crossover strategy. Of course, advanced bots incorporate filters like RSI, volume, or support/resistance levels for higher accuracy. Curious about how AI is reshaping trading with the macd indicator? The AI and Trading Insights resource explores the rapid integration of artificial intelligence and how it can enhance your decision-making.
AI-powered tools are taking the macd indicator to the next level. Solutions like PipTrend provide real-time buy and sell signals, instantly analyzing multiple timeframes and market conditions. When you combine PipTrend’s alerts with traditional macd indicator setups, you gain a powerful edge—AI filters out false positives, so you only act on the highest-probability trades.
Here’s a typical workflow: PipTrend issues a buy alert on your chosen asset. You check the macd indicator on your chart and see a bullish crossover confirming the signal. With both AI and MACD in agreement, your confidence in the trade increases. Many traders report improved win rates and reduced emotional stress using this combined approach.
In summary, personalizing the macd indicator for your trading style, automating your strategies, and leveraging AI-driven tools like PipTrend can help you stay ahead in the evolving 2025 markets. Experiment, optimize, and embrace technology to maximize your trading potential.
MACD Settings, Tips, and Troubleshooting for 2025
Fine-tuning your macd indicator is essential for adapting to the dynamic markets of 2025. As volatility increases and new instruments emerge, traders need to revisit period settings and visual enhancements to maintain clarity and precision.
Fine-Tuning MACD for Accuracy
Getting the most from the macd indicator starts with understanding its core settings. The default periods—12, 26, and 9—work well for many assets, but tweaking them can reveal hidden trends or reduce lag for certain markets.
| Market | Fast EMA | Slow EMA | Signal Line | Notes |
|---|---|---|---|---|
| Forex | 10 | 21 | 7 | Responds to rapid movements |
| Stocks | 12 | 26 | 9 | Classic, balanced approach |
| Crypto | 8 | 17 | 5 | Enhanced sensitivity |
Visual adjustments, like color-coding the macd indicator lines or making histogram bars bolder, can help you instantly spot momentum shifts. Saving custom templates on platforms such as TradingView or MetaTrader streamlines your workflow and ensures consistency.
For advanced optimization, some traders now explore wavelet transforms and genetic algorithms to fine-tune the macd indicator for specific assets and volatility levels. For a deeper dive into these modern techniques, see Optimizing MACD Trading Strategies with Wavelets and Genetics.
Recognizing and Filtering Fake Signals
No matter how well you calibrate your macd indicator, false signals are inevitable, especially in unpredictable or news-driven markets. The key is context. Always combine the macd indicator with support/resistance zones, volume analysis, and current market sentiment.
Common red flags for fake signals:
- MACD crosses but price action disagrees.
- Signals occur during low volume or after major news events.
- The histogram shows weak momentum despite a crossover.
Integrating statistical studies into your analysis can help. For instance, a Comparative Study of MACD-Based Trading Strategies offers performance metrics across different markets, helping you gauge when the macd indicator is most reliable.
When in doubt, step back and check for confirmation from multiple sources before acting.
Troubleshooting Common Issues
Technical hiccups can disrupt your use of the macd indicator. If the indicator isn’t appearing or updating on your chart:
- Ensure you’ve selected the correct data feed.
- Refresh or reload your platform.
- Double-check your indicator settings for any input errors.
Conflicting signals between timeframes are another common pain point. A bullish 1-hour macd indicator may contrast with a bearish daily signal. In these cases, prioritize your primary trading timeframe or use multi-timeframe analysis to align entries with higher-probability setups.
Crowdsourced solutions from trading forums highlight that most user-reported issues—like disappearing indicators or lag—are resolved by updating software or clearing cached data. Keeping your trading tools current is vital for consistent performance.
Tips from Professional Traders for 2025
Top traders agree: mastering the macd indicator means staying adaptable. As algorithmic trading and AI shape markets, it’s crucial to combine the macd indicator with broader technical and fundamental analysis.
Pro tips for 2025:
- Use the macd indicator as a filter, not a standalone signal.
- Continuously review your settings as volatility and liquidity change.
- Take advantage of new educational resources and webinars to stay updated.
Professional traders often recommend keeping a trade journal to record macd indicator setups, outcomes, and lessons learned. This habit not only improves discipline but also helps you recognize patterns and refine your strategy over time.
By applying these practical tips, you’ll be prepared to harness the full potential of the macd indicator in the evolving trading landscape.
If you’re ready to put your new MACD skills to work and want an extra edge in 2025’s fast-moving markets, it’s worth exploring tools that simplify your trading decisions. With PipTrend’s AI-powered alerts and real-time signals, you can combine reliable data with the MACD strategies you’ve learned here—making it easier to spot opportunities, filter out false signals, and trade with confidence across forex, crypto, stocks, or indices. You don’t have to trade alone or guess your next move.
See Your Trading Improve With PipTrend