Austrian Traded Index: A Beginner-to-Trader Guide
On this page
Twenty companies. One number. And a surprising amount of confusion about what that number actually measures.
What Is the Austrian Traded Index?
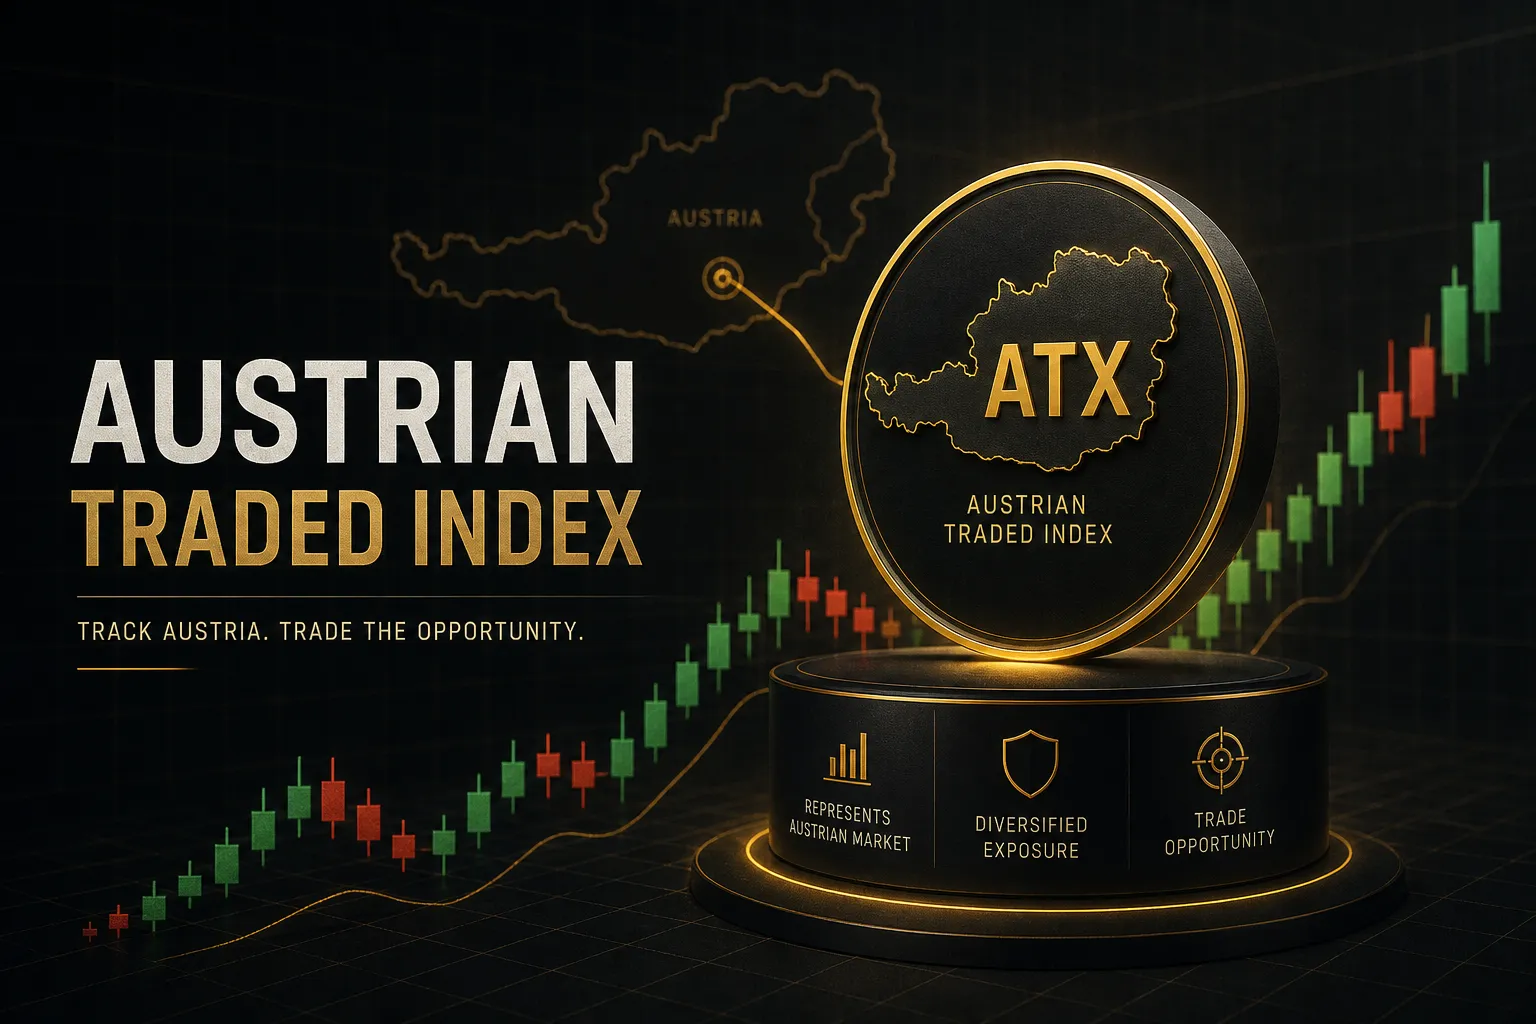
The Austrian Traded Index (ATX) is the leading benchmark index for the Austrian stock market, calculated and published by the Vienna Stock Exchange (Wiener Börse) since 2 January 1991. It started life at a base value of 1,000 points, and it has tracked the blue-chip end of Austrian equities ever since.
It is not a stock.
It is not a fund.
You cannot buy “one ATX” the way you buy one share of OMV or Erste Group.
The ATX is a statistical construct: a weighted average of the prices of roughly 20 of the most liquid, most heavily capitalized companies listed on the Vienna Stock Exchange. When financial media report that “Vienna closed 0.8% higher,” they almost always mean the ATX index moved 0.8%.
Here is the detail that trips up more analysts than anything else, so let’s get it out of the way immediately: the standard ATX is a price index.
Dividends paid by its constituents are excluded from the calculation. Given that Austrian blue chips have historically been among the higher-yielding shares in Europe, ignoring that fact can distort a decade of performance analysis by a very large margin.
A price index tells you what the shares are worth. A total return index tells you what an investor actually earned. Those are different questions.
This guide works through the ATX from the ground up.
First, who gets into the index and how weightings are set. Then, the mechanics of how the real-time index value is calculated, including the difference between ATX, ATX TR, and ATX NTR.
After that, a practical workflow for reading ATX price action as a trader, followed by an honest look at the risks and how the index compares with the DAX and the Euro Stoxx 50.
By the end, you should be able to look at any ATX chart and know exactly what it is showing you, and what it is quietly leaving out.
Inside the ATX: Companies, Sectors, and Weighting
The ATX is deliberately small.
That is a design choice, not an accident: Austria’s listed equity market is compact, and a benchmark index of 40 or 50 names would drag in companies that simply do not trade enough to be reliably investable.
What follows is how the Vienna Stock Exchange decides who is in, how much weight each name carries, and how often that changes.
Who Qualifies for the Index
Two filters do almost all of the work, and both are published in the official index guide rather than decided behind closed doors.
- Free-float market capitalization. Only shares genuinely available to the public count. Blocks held by founding families, government entities, or strategic corporate holders are stripped out, because those shares are not realistically buyable by an index fund.
- Trading turnover. A candidate must demonstrate sustained trading volume on the Vienna Stock Exchange. Ranking is based on both criteria together, so a large but rarely traded company will not force its way in on size alone.
- Prime Market listing. Constituents are drawn from the Prime Market segment, which carries stricter transparency, reporting, and disclosure obligations than the general market.
- The representation factor. Where free float is below 100%, a representation factor scales the company’s share count down so that only the tradable portion contributes to index weighting. A firm with 40% free float contributes roughly 40% of its shares to the calculation.
Sector Concentration and Its Risks
With about 20 index constituents, the ATX carries meaningful sector exposure concentration. Banking, energy, industrials, construction, real estate, and telecoms dominate the list, and the top handful of names routinely account for a majority of total index weight.
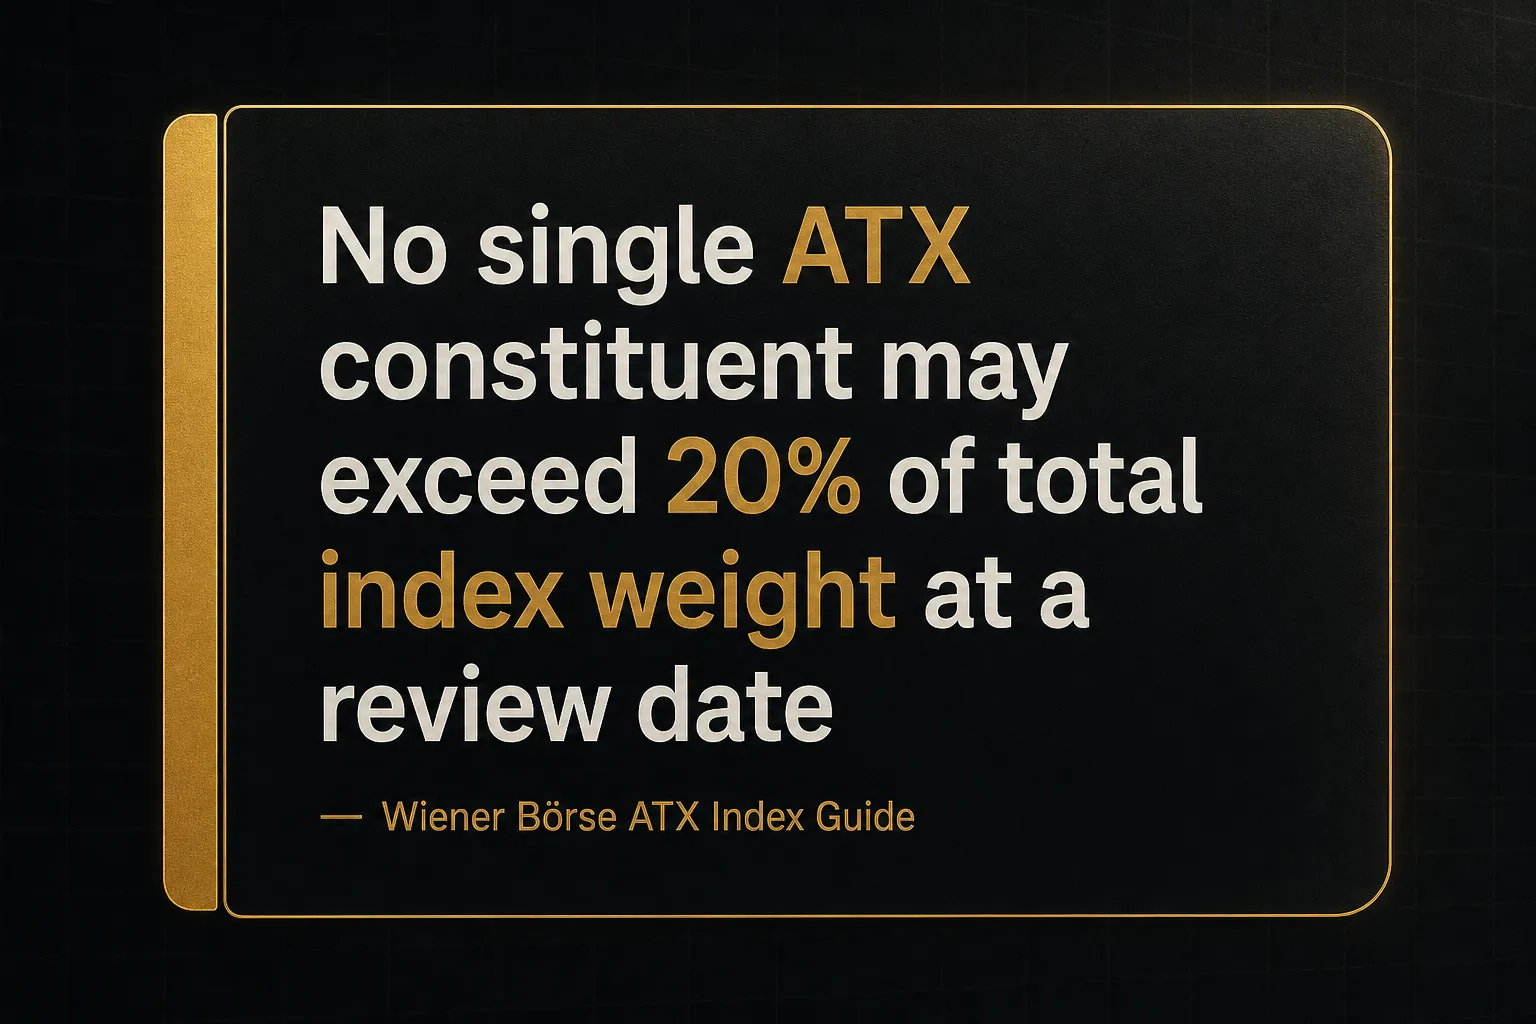
To stop any single company from dictating the index, the Vienna Stock Exchange applies a 20% single-constituent weight cap at each review. If a large bank or energy producer grows past that threshold, its weight is trimmed back and the excess redistributed across the remaining members.
That cap is not just tidiness.
It aligns the index with the UCITS diversification cap rules that European funds must respect, which is precisely what makes the ATX usable as an underlying for regulated ETFs and structured products.
Still, capping helps at the top and does nothing about the middle. A shock to Austrian banking or to European energy prices can move the ATX hard even when a dozen constituents barely twitch.
The Review Cycle: Semiannual vs Quarterly
Two separate schedules run in parallel, and confusing them is a common research error.
- Composition review (semiannual). Additions and deletions of companies are decided twice a year, in March and September, based on the published ranking of free-float capitalization and turnover.
- Parameter review (quarterly). Share counts, free-float factors, representation factors, and weight caps are updated four times a year, in March, June, September, and December.
- Extraordinary adjustments. Mergers, delistings, takeovers, and major capital actions can trigger changes outside the normal calendar, with the exchange publishing an index review notice in advance.
The practical consequence: a constituent list can look identical for eighteen months while the internal index weighting shifts substantially underneath it. If you pulled a weighting table in early 2025 and are still using it in 2026, it is almost certainly stale.
Check the current ATX watchlist and review notices published by Wiener Börse instead.
How the ATX Is Actually Calculated
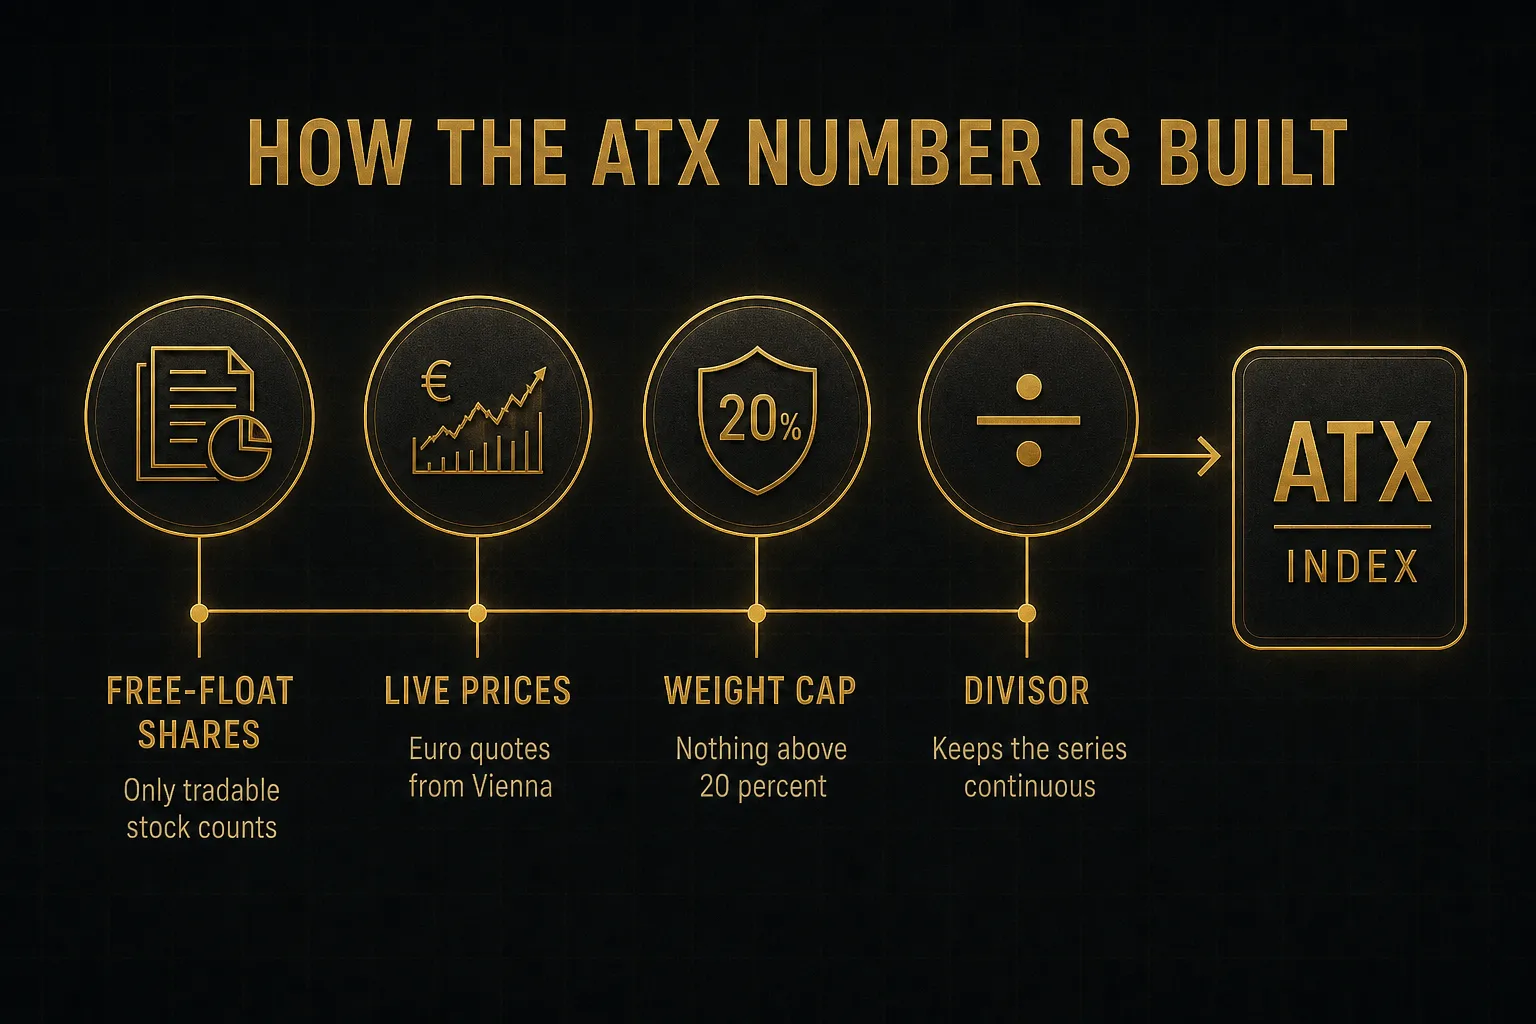
Strip away the terminology and the ATX formula answers one question: what is the combined free-float market value of these 20 companies right now, expressed as a number that stays comparable across three decades of mergers, spin-offs, and capital increases?
The index uses a Laspeyres-style chain-linked calculation. Current prices are multiplied by adjusted share counts, summed, and then divided by a divisor. When the composition changes, the divisor is recalculated so the index level does not jump artificially.
The companies change; the continuity of the series does not.
Price Index vs Total Return Explained
Three official versions of the ATX exist, and they diverge more every year that passes.
Using the wrong one is the single most common mistake in long-horizon Austrian equity analysis.
| Version | Full name | Dividend treatment | Typical use case |
|---|---|---|---|
| ATX | Austrian Traded Index (price index) | Excluded entirely | Headline market reporting, futures and options pricing, intraday trading reference |
| ATX TR | ATX Total Return (gross) | Reinvested in full at the gross amount | Theoretical maximum investor return, fund benchmarking for tax-exempt holders |
| ATX NTR | ATX Net Total Return | Reinvested after deduction of withholding tax | Realistic benchmark for most ETFs and taxable investors |
| ATX Prime | ATX Prime Index | Price index (a total return variant also exists) | Broader measure of the Prime Market universe |
The gap compounds.
With Austrian blue chips historically distributing meaningful dividends, a multi-decade chart of the price ATX can understate the actual investor experience by a wide margin.
Dividend reinvestment is not a rounding error over 20 years.
Ticker, Currency, and Trading Hours
The ATX trades under the ticker ATX and carries its own ISIN assigned by the Vienna Stock Exchange. It is denominated in euros, which matters for anyone comparing it against a dollar-based benchmark: some of the apparent divergence between the ATX and US indices in any given year is pure currency effect.
The real-time index value is disseminated during Vienna’s continuous trading session, running from roughly 09:00 to 17:30 CET, with the official close established after the closing auction. Outside that window, quoted ATX values on retail platforms are usually derivative-implied prices, not the official index.
Futures and options on the ATX trade on Eurex, which is where institutional hedging flow concentrates.
Related Indices: ATX Prime, ATX Five, WBI
Three neighbours cause constant confusion in performance comparisons.
- ATX Prime covers all companies in the Prime Market segment, typically 35 to 40 names. Broader than the ATX, and a better read on market breadth across Austrian large and mid caps.
- ATX Five tracks only the five heaviest constituents by capitalization and turnover. Extremely concentrated, and useful mainly as a proxy for the mega-cap end of the market.
- WBI (Wiener Börse Index) is the widest measure, covering essentially all Austrian shares in the equity market segment. It reaches back further historically and is the closest thing to a total-market Austrian gauge.
If a chart shows Austrian equities outperforming or lagging expectations, check which of these four it actually plots.
They are not interchangeable.
Reading ATX Price Action Like a Trader
Here is the thing most beginners miss: you are never actually trading the ATX.
You are trading a CFD, a future, or an ETF that references it, and the spread, financing cost, and liquidity of that instrument belong to the instrument, not to the index.
So the workflow below has two layers.
Analyse the index.
Then verify the vehicle.
A Repeatable Analysis Workflow
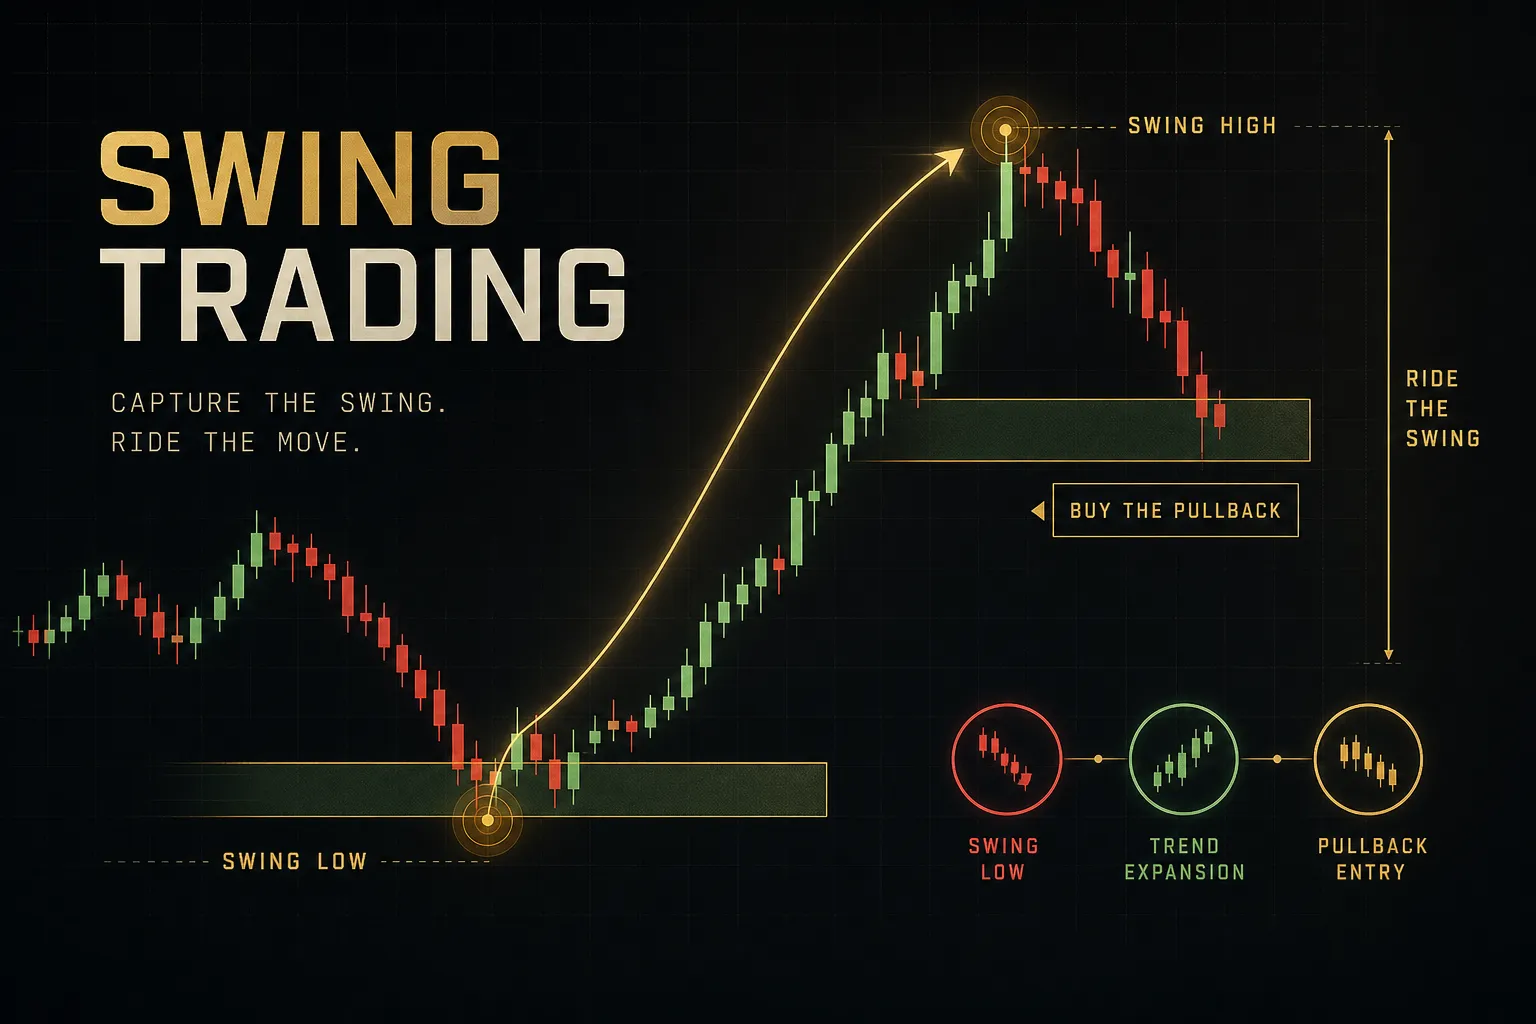
- Identify the market regime. Pull a weekly or monthly ATX chart and classify the environment as trending, ranging, or transitioning. Strategy selection follows regime, not the other way around.
- Confirm trend direction. Use two independent methods, such as a moving average structure plus a series of higher highs and higher lows. One method agreeing with itself is not trend confirmation.
- Assess volatility. Measure current index volatility against its own recent average using ATR or realized volatility. Rising volatility widens the stop you need, which shrinks the position you can afford.
- Check liquidity and spread conditions. Compare the spread on your chosen instrument during Vienna’s core hours versus off-peak. Austrian index products can widen sharply outside 09:00 to 17:30 CET.
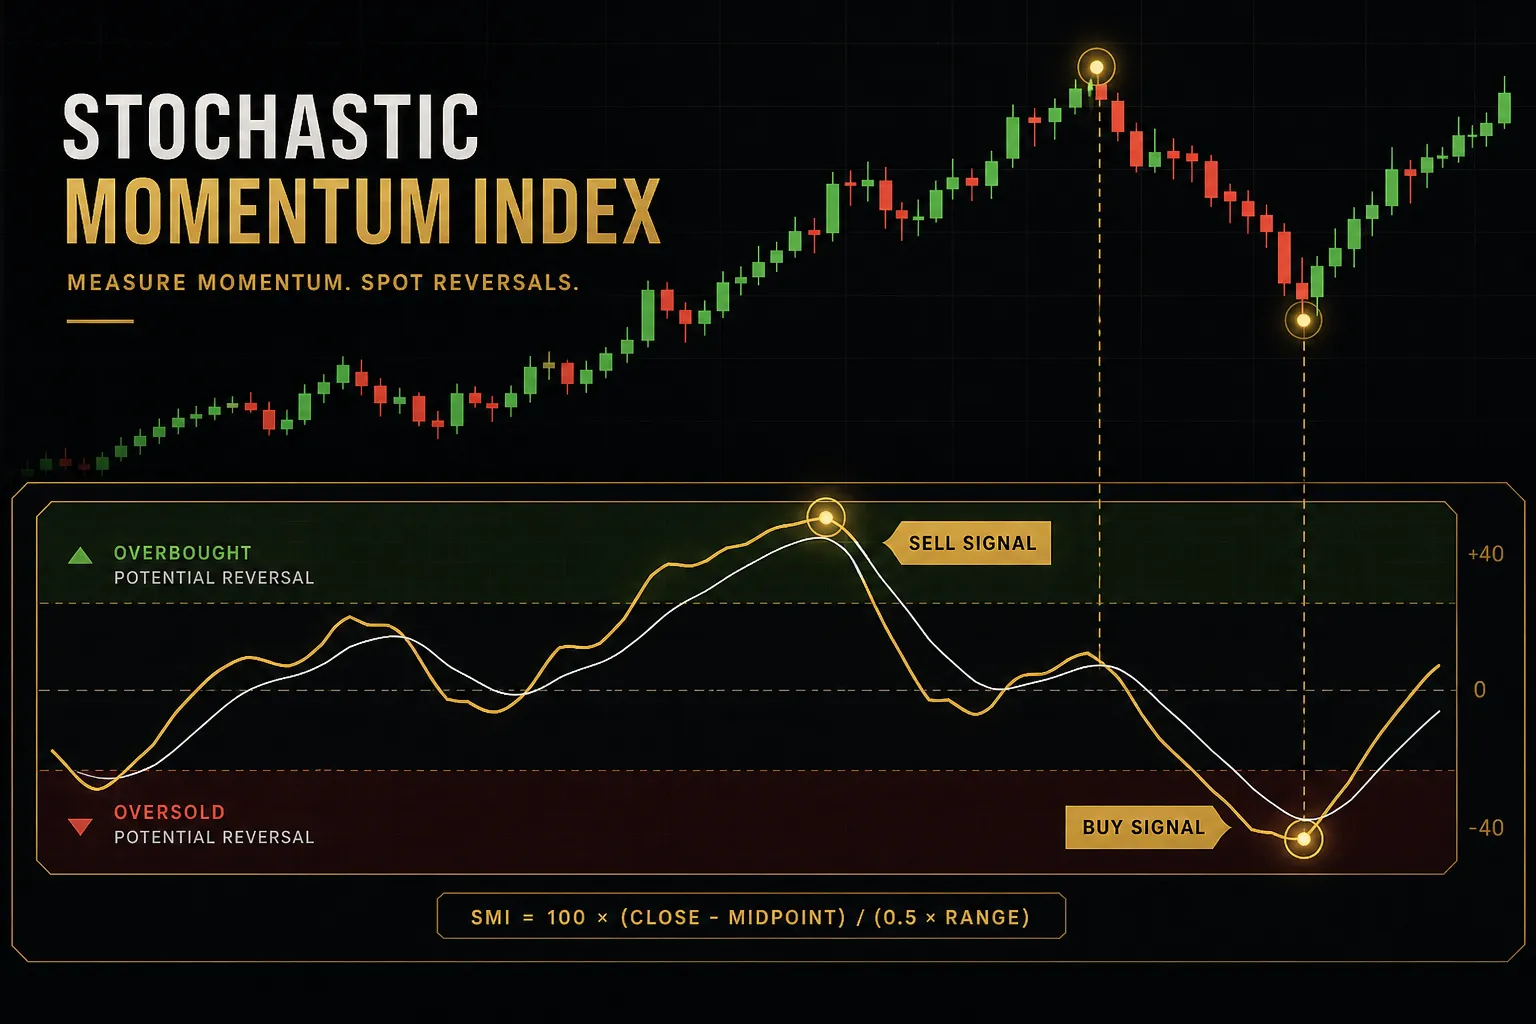
- Seek technical confirmation. Map support and resistance from prior swing points and volume shelves, then check whether momentum indicators agree with the trend read rather than diverging from it.
- Plan the entry. Define the specific price, condition, or candle close that triggers you in. If you cannot write it as a sentence someone else could execute, it is not a plan.
- Set the stop-loss first. Place it where your analysis would be proven wrong, typically beyond a structural level, not at a round number that feels comfortable.
- Size the position last. Work backwards: fixed risk per trade, usually 0.5% to 2% of account equity, divided by the distance to your stop. Position sizing is the output of the process, never the starting point.
Where Multi-Timeframe Signals Fit In
A single indicator on a single timeframe produces noise dressed up as insight. The fix is confluence: does the signal hold when you change the lens?
Multi-timeframe confirmation tools, such as PipTrend’s 12-timeframe view on TradingView, condense that check into one panel. Instead of clicking through 5-minute, hourly, 4-hour, daily, and weekly charts, you see whether directional bias is aligned or contradictory across the whole stack at once.
Use it the right way.
Alignment across higher timeframes tells you direction. It does not tell you where to enter, and it is not a buy signal on its own.
The entry still comes from your own level work on the execution timeframe.
Conflict across timeframes is arguably the more valuable output. When the weekly says up and the hourly says down, you are looking at a pullback in an uptrend or the early stage of a reversal, and that ambiguity is a reason to reduce size or stand aside.
Common Mistakes Traders Make
Three errors account for most avoidable ATX losses.
- Treating the index as a single tradable asset. The instrument has its own spread, overnight financing, expiry, and tracking behaviour. A perfect index call executed through a wide-spread CFD at 22:00 CET can still lose money.
- Ignoring internal breadth. With a 20% cap and roughly 20 members, one or two heavyweight banks or energy names can lift the ATX while most constituents fall. A rising index with negative breadth is a fragile index.
- Running a single indicator without context. An RSI reading means one thing in a strong trend and the opposite in a range. Without regime classification and defined risk management, indicators generate confidence, not edge.
ATX Risks and How It Compares
Concentration is the defining feature of the ATX. Not a flaw exactly, but a characteristic you have to price in.
ATX vs DAX and Euro Stoxx 50
The ATX holds around 20 companies.
The German DAX holds 40.
The Euro Stoxx 50 spreads 50 blue chips across multiple eurozone countries and a far wider mix of sectors.
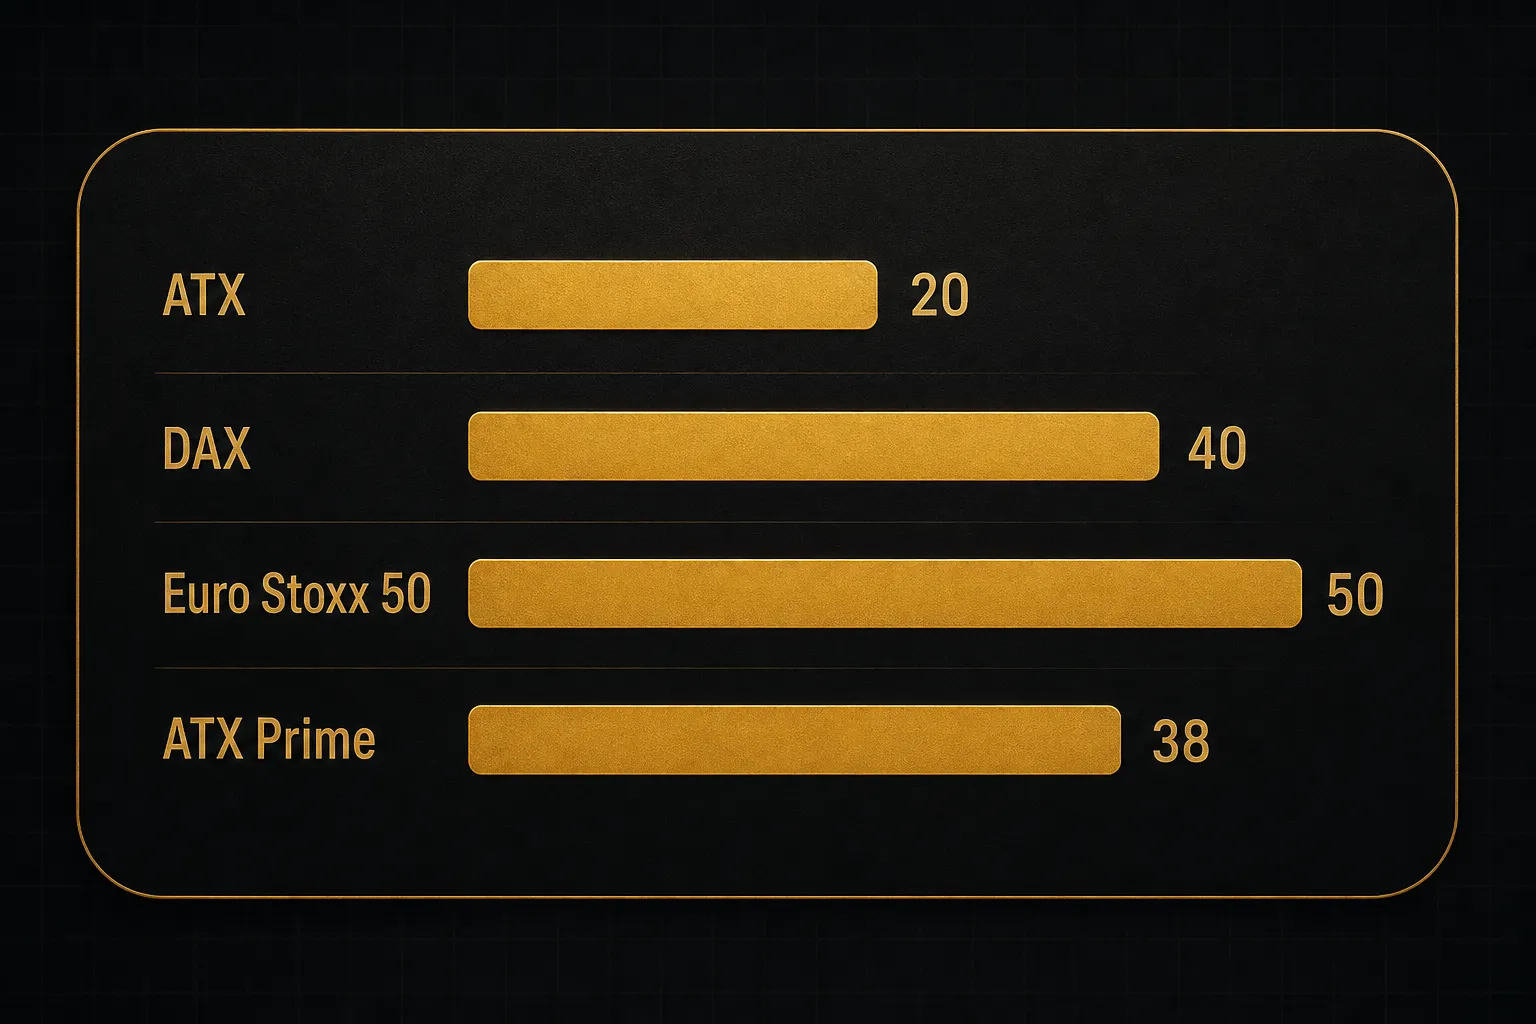
Fewer names means each position matters more.
It also means the ATX’s sector profile skews heavily toward banking, energy, industrials, and real estate, while the Euro Stoxx 50 carries substantial weight in luxury goods, pharmaceuticals, semiconductors, and consumer staples that Austria’s market simply cannot supply.
The practical result is higher realized volatility and lower correlation stability. In risk-on periods driven by cyclical and financial stocks, the ATX can sharply outperform broader European benchmarks.
In a banking stress episode, it underperforms just as sharply.
Why ATX Isn’t a Pure Economic Barometer
Assuming the ATX reflects the Austrian economy is a reasonable guess and frequently wrong.
Several major constituents generate a large share of revenue outside Austria, particularly across Central and Eastern Europe, plus Germany, Turkey, and further afield. Austrian banks with substantial CEE operations, energy companies with international upstream assets, and industrial suppliers selling into global capital cycles all fit this pattern.
So the ATX can rally on Romanian loan growth or a rebound in global steel demand while Austrian domestic GDP flatlines. It can fall on regional political risk in a market that barely registers in Austria’s own output figures.
The ATX is a benchmark for a specific set of internationally exposed companies that happen to be listed in Vienna. It is not a proxy for Austrian industrial output.
Nominal vs Real Performance
Any historical ATX chart you find needs three questions asked of it before you draw a conclusion.
First, is it price return or total return? A price-only series omits every dividend ever paid, which for a dividend-heavy market meaningfully understates investor outcomes.
Second, is it nominal or inflation-adjusted? After the inflation surge of 2022 and 2023, nominal index gains and real purchasing power gains have diverged noticeably.
Third, whose currency? A non-euro investor’s return includes the EUR exchange rate, which in some years has dominated the equity move entirely.
Layer on the structural risks: low free float in certain constituents amplifies price swings on modest order flow, sector concentration ties the index to bank and energy shocks, and liquidity thins outside Vienna’s core session.
None of these are disqualifying.
All of them belong in your sizing decision.
ATX Questions Answered
What is the Austrian stock market index called?
Austria’s leading stock market index is the ATX, short for Austrian Traded Index, calculated by the Vienna Stock Exchange (Wiener Börse). It has served as the country’s headline benchmark index since January 1991.
Broader alternatives exist.
ATX Prime covers the full Prime Market segment, and the WBI (Wiener Börse Index) covers essentially all listed Austrian shares.
What is the ATX index in Austria?
The ATX is a free-float market capitalization weighted price index tracking roughly 20 of the largest and most liquid companies listed in Vienna. It is quoted in euros, calculated in real time during the Vienna trading session, and capped so no single constituent exceeds 20% of index weight.
Because it is a price index, dividends are excluded from the headline ATX figure.
What companies are in the Austrian ATX index?
The ATX contains around 20 Austrian blue chips concentrated in banking, energy, industrials, construction, real estate, insurance, and telecoms. Because composition is reviewed semiannually and weightings quarterly, any list published in an article ages quickly.
Check the official ATX watchlist and index review notices published by Wiener Börse for the current constituents and their live weightings. That is the authoritative source, updated on the exchange’s own schedule.
Is ATX a good index to invest in?
It depends entirely on what role you want it to play in a portfolio, and this is not financial advice. The ATX offers concentrated exposure to Central and Eastern European growth through Austrian-listed financials, energy, and industrials, which is genuinely difficult to access elsewhere in a single instrument.
The trade-off is real.
Roughly 20 holdings with heavy banking and energy weightings means higher volatility, meaningful sector concentration risk, and performance that can diverge sharply from broad European benchmarks in both directions. Most investors treat it as a satellite allocation rather than a core holding.
What is the difference between ATX and ATX Total Return?
The ATX excludes dividends; the ATX TR reinvests them.
ATX TR assumes gross dividends are reinvested into the index, while ATX NTR reinvests dividends after withholding tax, making it the more realistic benchmark for most taxable investors and ETFs.
Over long periods the gap between the price and total return series is substantial, so never compare a price-index chart against a total-return benchmark.
How is the ATX index calculated?
The ATX uses a Laspeyres-style chain-linked formula: current constituent prices multiplied by free-float adjusted share counts, summed, then divided by a divisor that preserves continuity across composition changes. A representation factor adjusts for free float below 100%, and a 20% cap limits any single constituent’s weight.
Composition is reviewed twice yearly in March and September. Calculation parameters including share counts and free-float factors are updated quarterly.
Putting ATX Knowledge Into Practice
If you retain one thing, make it this: before drawing any conclusion from an ATX chart, table, or comparison, confirm whether the data is price return (ATX) or total return (ATX TR / ATX NTR).
That single check invalidates more bad analysis than any amount of indicator tuning.
From there, a simple decision rule works.
Analysing short-term price action? Verify the liquidity and spread of the specific instrument you plan to trade before you look at a single indicator, because execution cost is the one variable you control completely.
Evaluating long-term performance? Always compare total-return figures, ideally inflation-adjusted and in your own currency, never headline index levels.
And treat every constituent list, including implied ones in this guide, as a snapshot rather than a fixed truth. Composition shifts semiannually, weightings shift quarterly, and 2026’s index is not 2023’s index.
The official Wiener Börse methodology page and index review notices remain the source of record. Bookmark them, check them before you size a position, and let everything else be interpretation.
Sources
Risk Disclaimer: Trading involves risk. Past performance doesn't guarantee future results. Only trade with money you can afford to lose. PipTrend is a tool to assist your trading decisions, not financial advice.