
Unlocking the secrets of market liquidity is the key to mastering trading in 2025. In a world where rapid shifts and smart algorithms dominate, understanding what drives price movement is essential.
This guide demystifies buy side sell side liquidity, equipping you with actionable insights to thrive in the evolving financial landscape. Whether you’re an investor or active trader, a clear grasp of liquidity dynamics can transform your market approach.
We’ll break down the basics of buy side and sell side liquidity, examine their roles and differences, show how liquidity shapes price action, and provide step-by-step methods to identify crucial liquidity zones. Plus, you’ll discover essential strategies for navigating markets in 2025 and beyond.
Market volatility and algorithmic trading are reshaping liquidity—are you prepared? Understanding liquidity zones can give you an edge over the competition.
Learn how institutions and individual traders use liquidity to anticipate market moves. Follow this comprehensive guide to enhance your trading decisions in 2025.
Understanding Buy Side and Sell Side Liquidity
Unlocking how buy side sell side liquidity works is foundational for any trader or investor. Liquidity describes how easily assets can be exchanged without causing sharp price changes. In highly liquid markets like forex, spreads are tight and trades execute quickly, while illiquid assets can suffer from slippage and wider spreads. For context, the forex market alone moves over $7.5 trillion daily. Liquidity isn’t just about speed—it’s about cost, efficiency, and risk management. If you want to dive deeper into the mechanics behind these concepts, check out this guide on understanding trading buy and sell.
Defining Liquidity in Financial Markets
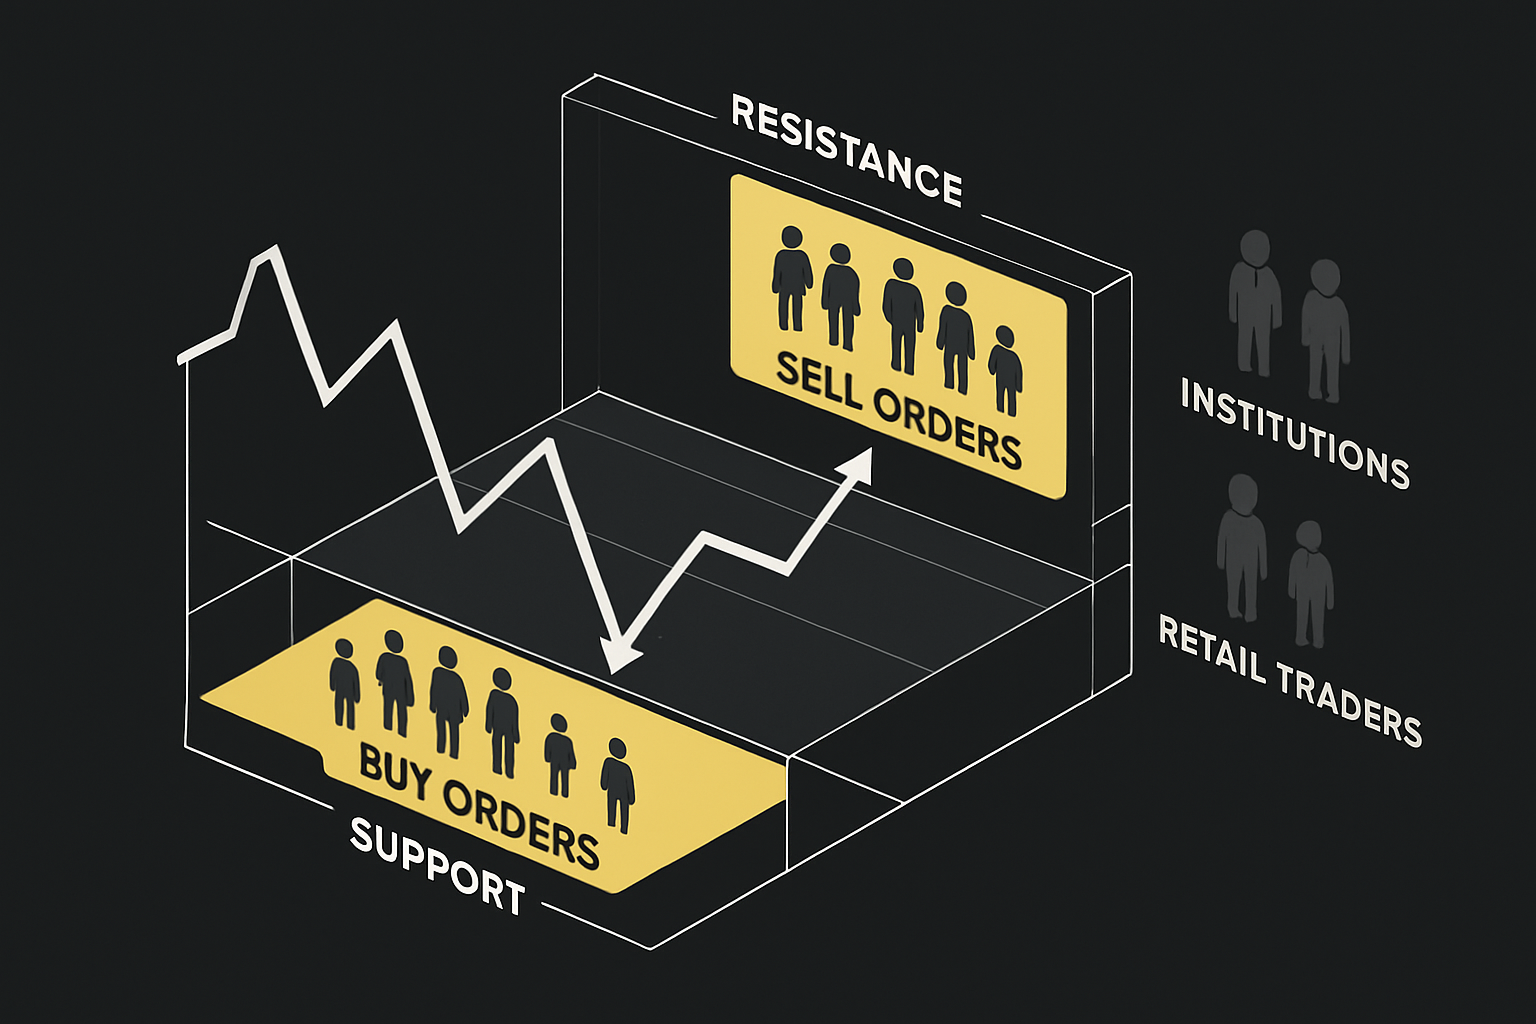
Liquidity is the lifeblood of financial markets. It measures how quickly assets can be bought or sold at stable prices. High liquidity means there are plenty of buyers and sellers, making trading smooth and predictable. For example, major stock indices and currency pairs have deep liquidity pools, while smaller stocks or exotic pairs are less liquid. When liquidity is high, traders benefit from smaller spreads and more reliable order fulfillment. Buy side sell side liquidity plays a crucial role in keeping these markets efficient and minimizing risks like slippage.
What is Buy Side Liquidity?
Buy side liquidity refers to the concentration of buy orders, often clustered just above resistance levels. These pools can include stop-losses from traders who are short, as well as fresh buy entries from institutions. When price nears these zones, a breakout can trigger rapid upward moves as buy orders are filled. Institutional investors like hedge funds and asset managers often target these areas to acquire assets efficiently. Understanding buy side sell side liquidity helps traders anticipate where sharp price surges might occur, especially during volatile market conditions.
What is Sell Side Liquidity?
Sell side liquidity is the collection of sell orders grouped just below key support levels. These orders often stem from stop-losses of long traders or new sell entries. When price breaks below support, these orders are triggered, leading to intensified selling pressure and swift price drops. Brokers, banks, and market makers play a major role in creating these liquidity zones. Recognizing where sell side liquidity congregates is essential for predicting sudden downward moves and managing risk. Buy side sell side liquidity analysis is central to this process.
The Role of Institutions vs. Retail Traders
Institutions are the main drivers of buy side sell side liquidity. They use sophisticated strategies to place large orders without revealing their intent, sometimes layering orders or using algorithms. Retail traders, on the other hand, often cluster their stop-losses at obvious technical levels, making them easy targets for institutional moves. This dynamic creates a battleground at liquidity zones, where institutional and retail interests collide. By studying buy side sell side liquidity, traders can better understand these power plays and adjust their strategies accordingly.
Key Arguments and Insights
Liquidity zones aren’t just static lines—they’re active battlegrounds where price reacts sharply. Both buy side sell side liquidity are needed for a healthy market, balancing supply and demand. The interplay between the two helps traders anticipate breakouts, reversals, and even false moves. In today’s fast-evolving markets, understanding this dynamic is a must. As institutional and retail activity shapes liquidity, staying aware of these zones gives traders a real edge. Buy side sell side liquidity knowledge is your compass in navigating the modern market landscape.
Buy Side vs. Sell Side: Functions, Differences & Market Impact
Understanding buy side sell side liquidity is crucial for grasping how modern financial markets operate. Each side plays a distinct role, shaping the flow of capital and the very structure of trading. Let's break down how these functions create the backbone of market dynamics.

Core Functions and Objectives
The core objective of buy side sell side liquidity participants is to facilitate efficient capital movement. The buy side focuses on acquiring assets for long-term growth, seeking alpha through careful investment selection. They analyze markets, identify opportunities, and build portfolios designed to outperform benchmarks.
On the other hand, the sell side specializes in making markets, providing liquidity and seamless access for buyers and sellers. Their goal is to facilitate trades, maintain orderly markets, and earn commissions or spreads. Without the sell side, buy side strategies would struggle to execute efficiently.
Differences in Clientele and Services
A key factor in buy side sell side liquidity is the clientele each side serves. The buy side works primarily with institutional investors, including pension funds, hedge funds, endowments, and high-net-worth individuals. Their services revolve around portfolio management and research.
The sell side, by contrast, caters to a broader spectrum, from corporations issuing securities to retail and institutional investors. They offer research, trade execution, and liquidity provision. Here's a quick comparison:
| Aspect | Buy Side | Sell Side |
|---|---|---|
| Clients | Institutions, HNWIs | Corporations, retail, institutions |
| Services | Portfolio mgmt, research, risk analysis | Execution, market making, research |
These distinctions shape how each side influences buy side sell side liquidity in markets.
Compensation Structures and Incentives
Compensation is another major difference in buy side sell side liquidity dynamics. Buy side professionals typically receive performance-based bonuses tied directly to investment returns. This structure motivates them to seek alpha and outperform the market.
Sell side compensation, in contrast, combines fixed salaries with transaction-based bonuses or commissions. While less variable, it offers stability and rewards high trade volumes. In strong years, buy side bonuses can exceed base salaries, while sell side pay remains steadier.
This divergence in incentives impacts how aggressively each side pursues opportunities and manages risk in buy side sell side liquidity environments.
Regulatory Frameworks
Regulatory requirements shape the behavior of both buy side sell side liquidity participants. The buy side operates under fiduciary duties, prioritizing client interests and adhering to strict compliance standards. Their focus is on avoiding conflicts of interest and ensuring ethical conduct.
The sell side is governed by rules promoting market integrity, transparency, and fair dealing. Regulatory bodies like the SEC oversee both sides, but with tailored obligations reflecting their roles. These frameworks help maintain trust and stability in buy side sell side liquidity flows.
Impact on Market Liquidity and Price Discovery
The interplay of buy side sell side liquidity is a driving force behind price discovery and market efficiency. Large buy side orders can temporarily disrupt liquidity, creating imbalances that move prices. Sell side market makers absorb these flows, smoothing volatility and ensuring continuous trading.
During high-activity periods, such as earnings season, the sell side's ability to provide liquidity keeps markets stable. For a deeper dive into how market makers optimize liquidity in the presence of informed traders, see this Market making with informed traders research.
Understanding this push and pull is vital for traders navigating buy side sell side liquidity.
Key Insights and Perspectives
In summary, buy side sell side liquidity is the engine powering modern markets. Both sides are interdependent, with their activities shaping depth, stability, and price trends. As automation and AI advance, traditional boundaries between buy and sell sides are blurring, making it even more important to understand their motives.
For traders and investors, anticipating the actions of both sides can reveal where liquidity pools form and how price action unfolds. Staying ahead in 2025 will require a nuanced grasp of buy side sell side liquidity and the ever-evolving market landscape.
Identifying and Analyzing Liquidity Zones: Step-by-Step Guide
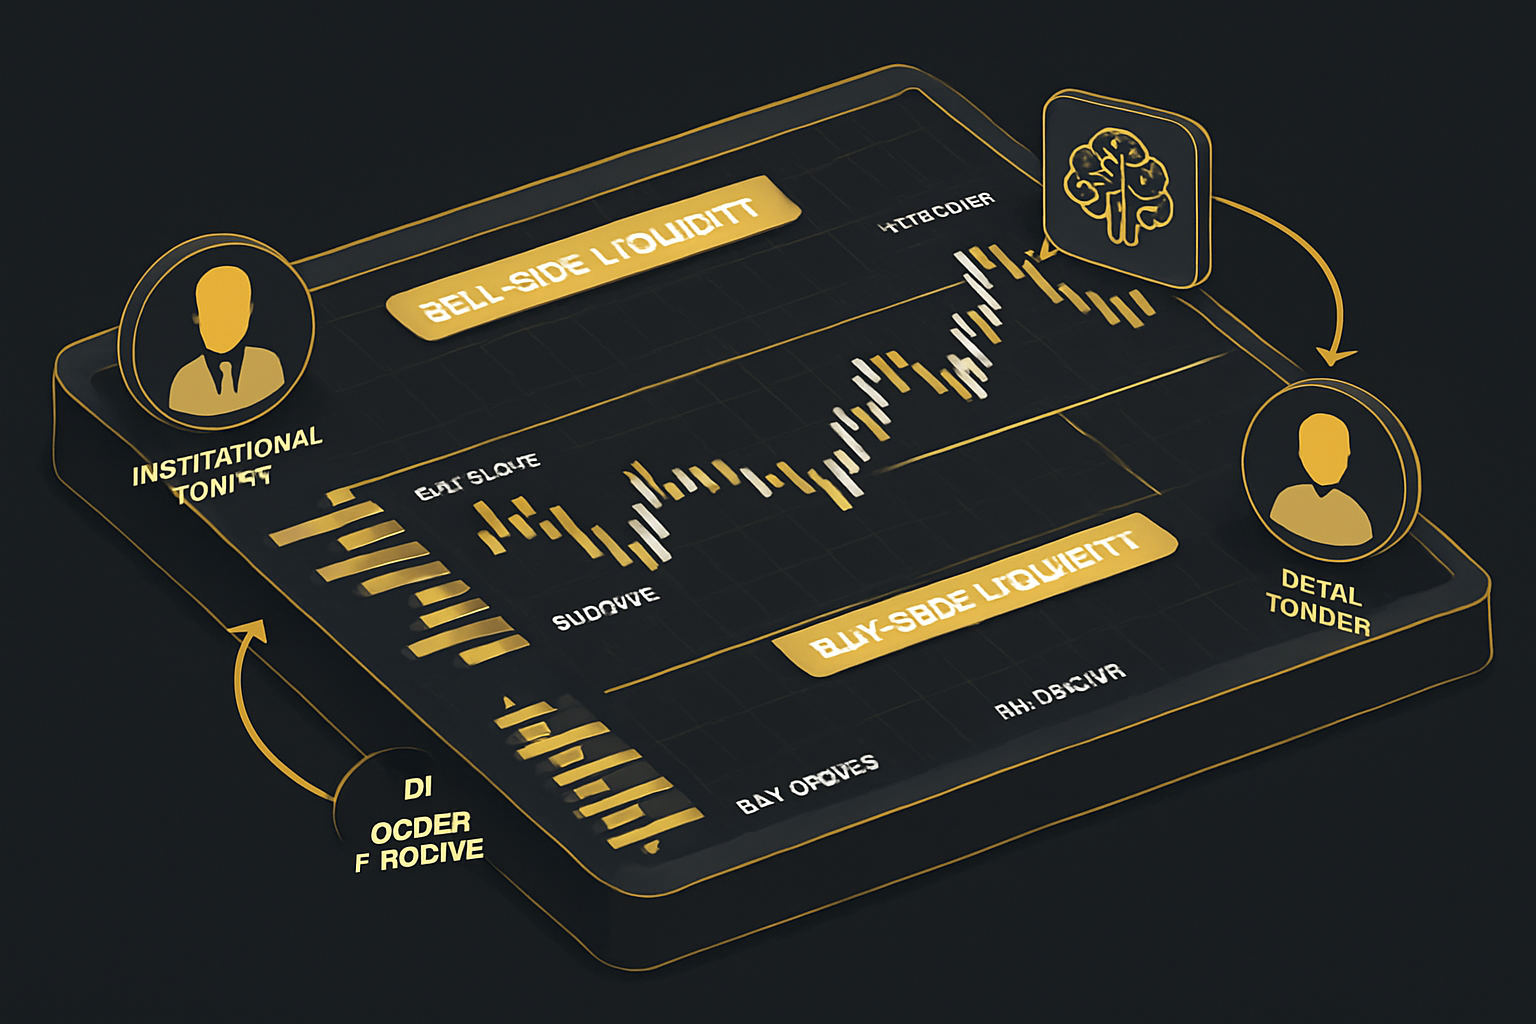
Unlocking the true power of buy side sell side liquidity starts with accurately identifying where the market’s most significant orders are hiding. When you know where these liquidity zones exist, you can anticipate explosive moves and avoid common trading traps. Here’s a practical, step-by-step guide to mastering this essential skill for 2025.
Step 1: Recognize Key Technical Levels
The foundation of buy side sell side liquidity analysis is spotting crucial technical levels. These include classic support and resistance points, moving averages, and Fibonacci retracements. Price often reacts sharply at these levels, as they attract both institutional and retail orders.
To pinpoint these zones, study historical price action and look for areas where the market has repeatedly reversed or stalled. Volume spikes near certain price levels may signal the presence of a major liquidity zone. For a deeper dive into using Fibonacci retracement to identify support and resistance, check out Identifying support and resistance.
Common tools for this step:
- Horizontal support/resistance lines
- 50/200-day moving averages
- Fibonacci retracement overlays
A methodical approach to technical levels is the first step to mapping out buy side sell side liquidity.
Step 2: Observe Order Flow and Volume Profiles
Understanding order flow is essential for analyzing buy side sell side liquidity. Volume profile indicators display where the heaviest trading has occurred at specific price levels, revealing high volume nodes that often correspond to liquidity zones.
By studying these profiles, traders can see where large players have entered or exited the market. If you notice price consolidating near a level with significant volume, it’s often a sign that major liquidity is present and a potential breakout or reversal could be brewing.
Checklist for this step:
- Apply a volume profile indicator to your chart
- Identify high volume nodes and trading clusters
- Note where price consolidates with above-average volume
This approach gives you a clearer picture of buy side sell side liquidity and its influence on price action.
Step 3: Analyze Stop-Loss Clustering
A key driver of buy side sell side liquidity zones is the clustering of stop-loss orders. Retail traders tend to place stops just beyond obvious technical levels, making these zones prime targets for institutional moves.
Scan the chart for areas where stops are likely to accumulate—typically above resistance for shorts and below support for longs. Institutions may intentionally push price into these zones to trigger stops, unleashing a surge of buy or sell orders and creating rapid movement.
Key points for this step:
- Identify “obvious” stop-loss locations
- Watch for sudden price spikes through these areas
- Use order book data, if available, to spot stop clusters
Recognizing these clusters is crucial to understanding how buy side sell side liquidity shapes market dynamics.
Step 4: Monitor Breakouts and False Breakouts
Breakouts through liquidity zones are often fast and dramatic, but not every move is genuine. Distinguishing true breakouts from false ones (sometimes called “stop hunts”) is vital for buy side sell side liquidity analysis.
A true breakout usually comes with strong volume and follow-through, while a false breakout quickly reverses as stops are triggered and institutions take the other side. Monitoring price action, candlestick patterns, and volume spikes can help you separate real moves from traps.
Tips for this step:
- Wait for confirmation after a breakout (e.g., a retest or strong close)
- Watch for lack of follow-through as a warning sign
- Use multi-timeframe analysis to validate the move
This vigilance helps you avoid getting caught in liquidity-driven whipsaws.
Step 5: Utilize Advanced Tools and Indicators
Modern markets are increasingly complex, and advanced tools are now indispensable for mapping buy side sell side liquidity. AI-powered indicators, multi-timeframe dashboards, and real-time order flow analytics can help you spot evolving liquidity patterns faster than ever before.
Trading platforms now offer features like session liquidity overlays and heatmaps, making it easier to visualize where major liquidity pools exist. In 2025, embracing these tools will be essential for staying competitive.
Consider these advanced resources:
- AI-based liquidity zone detectors
- Real-time order flow dashboards
- Session-based liquidity overlays
Leveraging technology is the final step to mastering buy side sell side liquidity identification.
How Liquidity Shapes Price Action and Market Behavior
Liquidity is the lifeblood of financial markets. When traders understand buy side sell side liquidity, they gain a front-row seat to the forces steering price action. The ebb and flow of liquidity not only influences volatility but also underpins the mechanics behind every breakout, reversal, and trend.
Liquidity and Volatility
The relationship between liquidity and volatility is foundational. High liquidity means there are plenty of buyers and sellers, which keeps spreads tight and price movements smooth. Major forex pairs and blue-chip stocks are classic examples of markets with deep buy side sell side liquidity.
Conversely, low liquidity markets—like small-cap stocks or certain altcoins—experience wider spreads and sharper price swings. This occurs because fewer orders are available to absorb sudden buying or selling pressure.
| Market Type | Liquidity Level | Typical Spread | Volatility |
|---|---|---|---|
| Major Forex Pair | High | Low | Low |
| Small-Cap Stock | Low | High | High |
For traders, recognizing environments with high or low buy side sell side liquidity is crucial for setting realistic expectations and managing risk.
The Mechanics of Stop Hunts and Liquidity Grabs
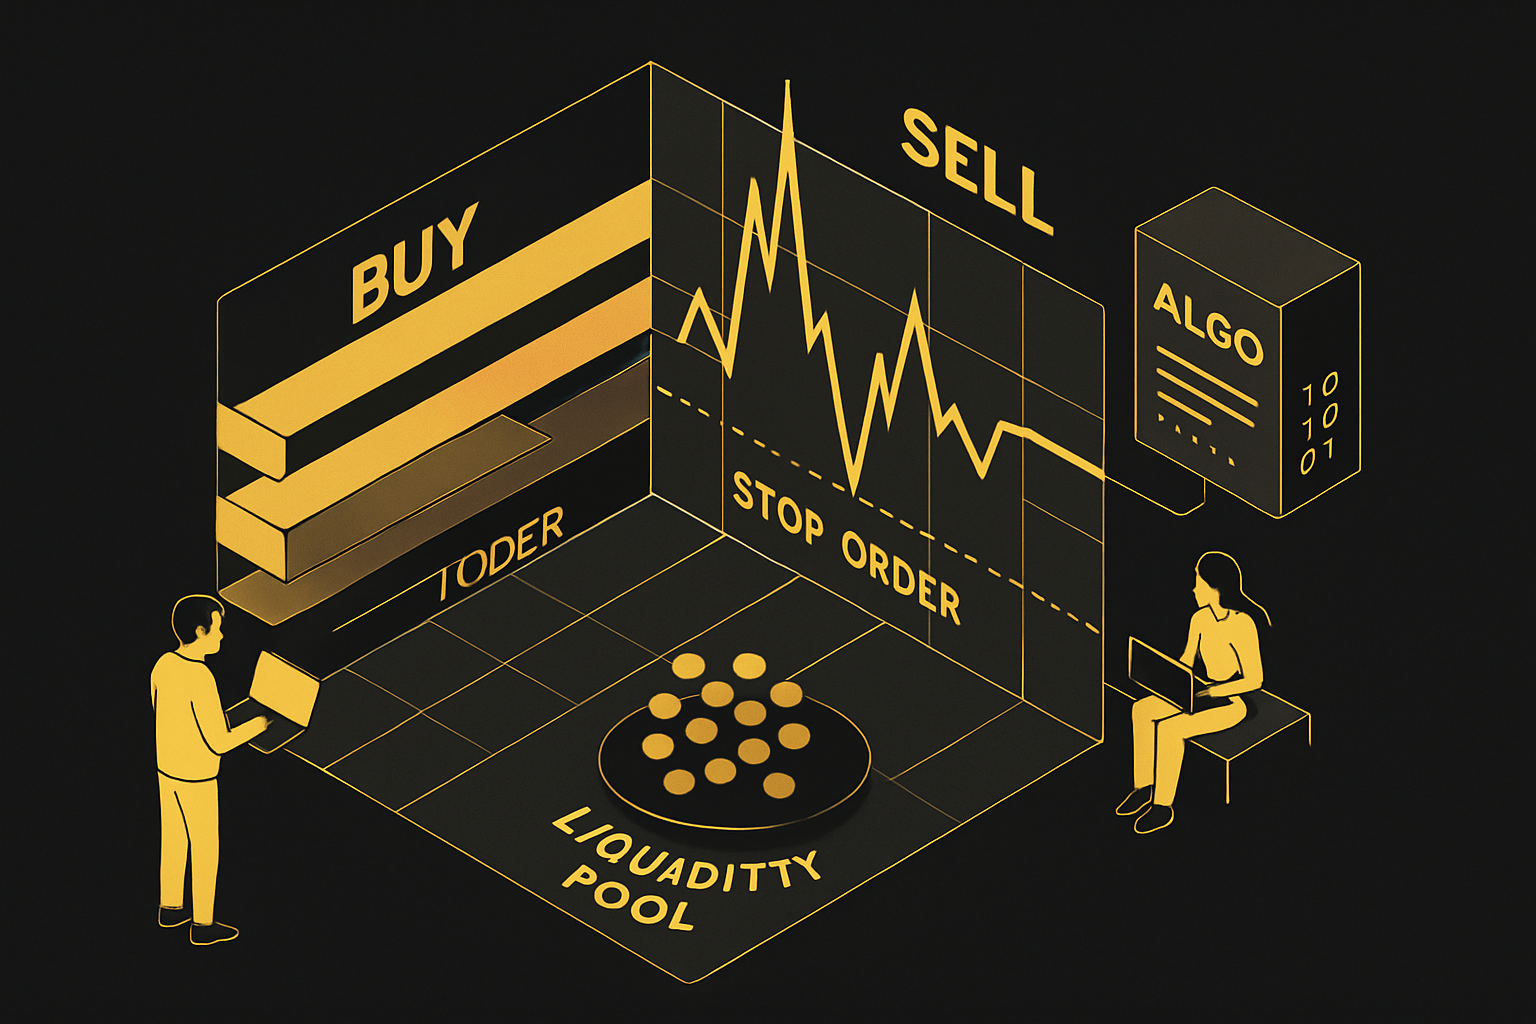
Institutions are known for leveraging buy side sell side liquidity to their advantage. When price approaches a key resistance or support level, stop orders often cluster just beyond these points. Institutions might deliberately push prices into these zones, triggering stop-losses and creating sharp, short-lived moves.
For example, a spike above resistance can trigger a cascade of buy stops, causing rapid upward price movement. Once these orders are filled, the price may quickly reverse. This process is often referred to as a "stop hunt" or "liquidity grab," and it's a direct result of the concentration of buy side sell side liquidity at predictable technical levels.
Understanding these mechanics helps traders anticipate potential fakeouts and avoid being caught on the wrong side of the trade.
Liquidity Pools and Market Microstructure
Liquidity pools aggregate buy and sell orders, providing the depth needed for efficient trading. In centralized markets, market makers facilitate this process by continuously quoting prices. On decentralized exchanges, liquidity pools are formed by users who deposit assets, enabling trades without a traditional order book.
In 2024, decentralized exchanges rely heavily on these pools to ensure smooth execution. The presence or absence of robust buy side sell side liquidity in these pools can make the difference between a seamless trade and significant slippage.
Analyzing order book depth and liquidity pool size gives traders a real-time snapshot of market health and potential price stability.
The Feedback Loop: Liquidity, Price Discovery, and Trend Formation
Liquidity zones act as magnets for price action. When price repeatedly tests a liquidity zone, it often signals a buildup of orders on both the buy and sell side. This tug-of-war can lead to explosive breakouts or powerful reversals, depending on which side gives way.
The constant interaction between buy side sell side liquidity and price forms a feedback loop, shaping trend direction and momentum. Traders who master price action trading strategies often use these liquidity zones to time entries and exits with precision.
As algorithmic trading and real-time analytics become more prevalent in 2025, tracking liquidity-driven moves will remain a critical edge for those seeking to outpace the market.
Strategies for Trading with Buy Side and Sell Side Liquidity in 2025
Navigating the complexities of buy side sell side liquidity requires a structured, forward-thinking approach. As financial markets evolve, traders must consistently adapt their strategies to stay competitive. Here’s a practical framework for leveraging liquidity dynamics in 2025.
Step 1: Develop a Liquidity-Focused Trading Plan
The first step is integrating buy side sell side liquidity analysis into your trading plan. Start by mapping out key liquidity zones—areas where clusters of stop-losses and large institutional orders are likely to trigger rapid price moves.
Use these zones to define your entry and exit points. For example, consider entering positions after a confirmed liquidity sweep and reversal, rather than at arbitrary technical levels.
This approach helps you anticipate where the market may accelerate, reducing the risk of being caught on the wrong side of a breakout or fakeout. By aligning your plan with buy side sell side liquidity, you gain a tactical edge.
Step 2: Combine Technical and Fundamental Analysis
Successful trading in 2025 demands a blend of technical and fundamental perspectives. Start by identifying liquidity zones with technical tools—such as support, resistance, and volume profiles.
Next, overlay fundamental catalysts like economic releases or earnings reports. For example, a major central bank announcement could shift buy side sell side liquidity zones and trigger new order flow.
By combining these methods, you can better anticipate liquidity shifts and avoid being blindsided by sudden volatility. This holistic approach makes your strategy more robust and responsive.
Step 3: Leverage AI and Real-Time Analytics
AI-powered tools are transforming how traders analyze buy side sell side liquidity. Advanced algorithms detect evolving liquidity patterns, identify stop clusters, and visualize real-time order flow across multiple timeframes.
Platforms now offer dashboards that integrate these analytics, helping you confirm trend alignment and spot institutional activity. For a deeper dive into how AI is reshaping liquidity analysis, see this guide to AI in financial trading.
Incorporating AI-driven insights into your workflow helps you react faster and with greater accuracy, giving you a measurable advantage in today’s data-driven markets.
Step 4: Manage Risk with Precision
Risk management is crucial when trading around buy side sell side liquidity. Place stop-losses away from obvious liquidity clusters to avoid being targeted by institutional stop hunts.
Adjust your position size based on the depth and volatility of the liquidity zone you’re trading. For instance, thinner zones may require smaller positions to limit slippage.
Consider using trailing stops or dynamic risk parameters that adapt to changing liquidity conditions. This disciplined approach helps protect your capital and ensures longevity in volatile markets.
Step 5: Monitor Institutional Activity and Order Flow
Institutional traders play a significant role in shaping buy side sell side liquidity. Watch for block trades, dark pool prints, and unusual spikes in order flow, as these can signal impending moves through key liquidity zones.
Analyze order book imbalances to gauge where large players are positioning. By tracking this activity, you can align your trades with institutional momentum instead of getting caught in retail traps.
Staying alert to these signals lets you ride the coattails of the market’s biggest movers.
Step 6: Adapt to Changing Market Conditions
Liquidity dynamics are never static, especially in 2025. News events, market opens and closes, and periods of low volume can all fragment liquidity and create new trading opportunities.
Stay flexible by updating your analysis as new data emerges. For the latest trends on liquidity fragmentation and market expectations, consult the mid-year market outlook 2025.
By adapting your strategy to real-time conditions, you ensure your buy side sell side liquidity approach remains effective regardless of market regime.
Key Arguments and Perspectives
A liquidity-centric approach is essential for all traders and investors. The interplay of buy side sell side liquidity shapes every significant price movement, from sharp reversals to trend continuations.
In 2025, blending technical, sentiment, and order flow analysis—while leveraging technology—will be the hallmark of top performers. Embrace these strategies to stay ahead in a rapidly evolving market landscape.
Career Paths: Buy Side vs. Sell Side Roles and Opportunities
Navigating a career in finance often starts with understanding the buy side sell side liquidity dynamic. Your choice between these two paths shapes not only your daily responsibilities but also your long-term opportunities, compensation, and skill sets. As the financial landscape evolves, knowing how liquidity functions on both sides can set you apart.
Buy Side Careers: Roles, Pros & Cons
Buy side careers focus on managing investments and maximizing returns for clients or institutions. Typical roles include:
- Portfolio Manager
- Research Analyst
- Trader
- Risk Manager
Pros:
Buy side professionals often enjoy performance-based compensation, intellectual challenges, and prestige—especially within large asset managers or hedge funds. Job stability can be strong, particularly at established firms.
Cons:
Competition for buy side positions is intense, with high entry barriers and limited openings. The pressure to outperform benchmarks is constant, and compensation can fluctuate based on fund results.
A strong grasp of buy side sell side liquidity is essential for anyone aiming to excel in these roles, as it directly influences portfolio construction and trade execution.
Sell Side Careers: Roles, Pros & Cons
Sell side careers are centered on providing liquidity, facilitating trades, and delivering research or investment banking services. Key roles include:
- Sales/Trader
- Market Maker
- Investment Banker
- Research Analyst
Pros:
Sell side positions offer more entry-level opportunities, rapid skill development, and career flexibility. Base salaries are typically stable, making these roles attractive for those starting out.
Cons:
Working on the sell side often means high-pressure sales targets, long hours, and frequent client-facing demands. Advancement may require early career transitions or specialization.
Recent regulatory changes have added complexity to the sell side, especially in bond markets. For a deeper dive into these evolving challenges, see the bond market liquidity trilemma.
A clear understanding of buy side sell side liquidity is crucial, as it shapes how firms manage risk and provide market access.
| Aspect | Buy Side | Sell Side |
|---|---|---|
| Core Roles | Portfolio manager, analyst, trader, risk mgr. | Sales/trader, market maker, IB, analyst |
| Pros | Performance bonuses, prestige, stability | Entry-level access, skill growth, flexibility |
| Cons | High barriers, pressure, variable income | Sales targets, long hours, early transitions |
Market Trends and Skills for 2025
The future of buy side sell side liquidity careers is increasingly tech-driven. Both sides are experiencing a surge in demand for:
- Data analysis
- Programming (Python, R)
- AI and machine learning expertise
Hybrid roles are emerging as technology blurs traditional boundaries. Quantitative analysts, once mainly on the sell side, are now vital on the buy side too. Firms seek professionals who can interpret liquidity data and leverage real-time analytics.
To stay competitive, candidates should build skills that bridge finance and technology. This adaptability will be a decisive factor in 2025, as buy side sell side liquidity processes become more digital and interconnected.
Key Insights
Both buy side and sell side career paths offer distinct advantages and challenges. Success increasingly depends on your ability to understand and navigate buy side sell side liquidity.
Professionals with this expertise can anticipate market shifts, optimize trade execution, and contribute to more resilient financial systems. In a market shaped by automation and data, tech-savvy and flexible talent will find the best opportunities.
Whether you’re starting out or considering a transition, mastering buy side sell side liquidity is a valuable differentiator in today’s—and tomorrow’s—job market.
Now that you’ve got a clear picture of how buy side and sell side liquidity shape the markets, it’s time to take your trading to the next level. You know how crucial it is to spot liquidity zones and react quickly—especially as markets evolve in 2025. With PipTrend’s AI-powered signals and real-time alerts, you don’t have to rely on guesswork or miss out on big moves. If you’re ready to put these insights into action and see real improvements in your trading, See Your Trading Improve With PipTrend.