Trading Buy Sell Signals: A Beginner's Decision Guide
On this page
Why Buy and Sell Decisions Feel So Confusing
A green BUY label looks like an instruction.
It isn’t.
It’s a probability estimate dressed up in a color that your brain reads as permission.
That single misunderstanding explains most beginner losses.
The chart flashes green, the trader clicks, and the position is open before anyone has asked the two questions that actually matter: where is this trade wrong, and how much does being wrong cost?
Signals are inputs.
Decisions are yours.
A well-built system narrows the field of possible trades so you spend your attention on the ones worth taking, but it cannot tell you whether the setup fits your account size, your holding period, or the fact that a central bank statement drops in eleven minutes.
This guide walks the whole sequence: reading market context, judging setup quality, waiting for confirmation, choosing an entry method, placing a stop-loss and target, and reviewing what happened afterward. Along the way we’ll cover which indicators suit which market conditions, what execution costs do to a technically correct signal, and how to validate a rule set before risking real money.
A signal system should sharpen your judgment and enforce your risk management. It should never replace either one.
What Buy and Sell Actually Mean
Ask ten new traders what “buy” means and you’ll get ten versions of the same vague answer.
The confusion is not about vocabulary.
It’s about the fact that three separate events get collapsed into one word.
Signal, Entry, and Order Are Different Things
A signal is a probability-based indication of likely trend direction.
It says the odds have tilted, nothing more.
A moving average crossover on a 4-hour chart is a signal. So is a bullish engulfing candle at a well-tested support level.
An entry is the specific price at which you’re willing to act on that signal. The signal might be bullish, but your entry could be a pullback to the 20-period exponential moving average, or a break above the prior session high, or a retest of a supply zone that flipped to demand.
An order is the actual transaction sent to your broker.
It’s the only part of the three that costs money and creates exposure.
Treating the signal as the order skips everything in between. You lose the chance to choose a better price, you never define an invalidation level, and your position size becomes whatever your platform defaults to.
That’s not trading.
That’s clicking.
Professional workflows keep these three layers separate on purpose.
Direction is one question.
Price is a second.
Execution timing is a third.
A tool like PipTrend reflects that separation directly: color-coded candles handle trend direction, session highs and lows, VWAP and supply/demand zones mark potential entry levels, and a 12-timeframe confirmation table addresses timing.
Useful structure, but the judgment still sits with the trader.
Closing a Long vs Opening a Short
Here’s where beginners get genuinely tangled.
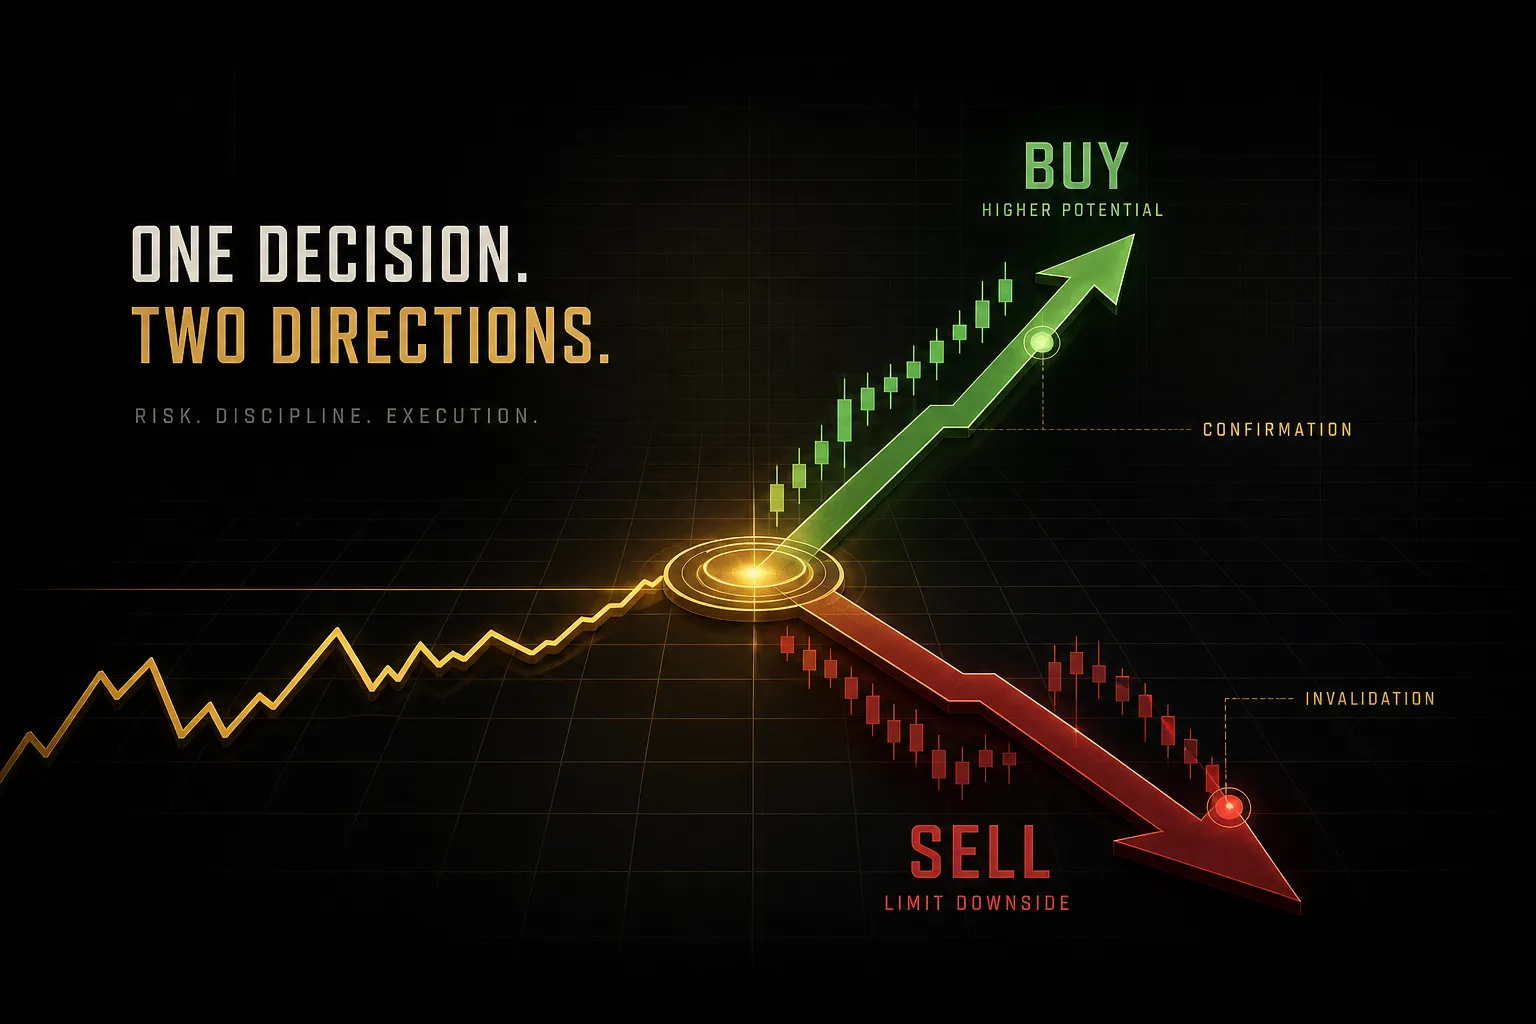
Selling can mean two completely different things.
Selling to close a long means you already own the asset and you’re exiting.
Your exposure goes to zero.
Risk ends there.
Selling to open a short means you’re taking a brand new position that profits when price falls.
Your exposure just went from zero to full.
Risk begins there.
Same button on many platforms.
Opposite consequences.
The mechanics also shift by market.
In forex, every trade is a pair, so shorting EUR/USD is simply buying dollars with euros, and it requires no borrowing. In stocks, a short means borrowing shares from your broker, paying a borrow fee, and accepting the risk of a forced buy-in if the lender recalls them. In crypto, shorting usually happens through perpetual futures with funding rates that charge you every eight hours for holding against the crowd. In futures, longs and shorts are symmetrical contracts with identical margin treatment, which makes shorting mechanically simple but leverage-heavy.
Same word.
Four different cost structures.
Know which one you’re in before you click.
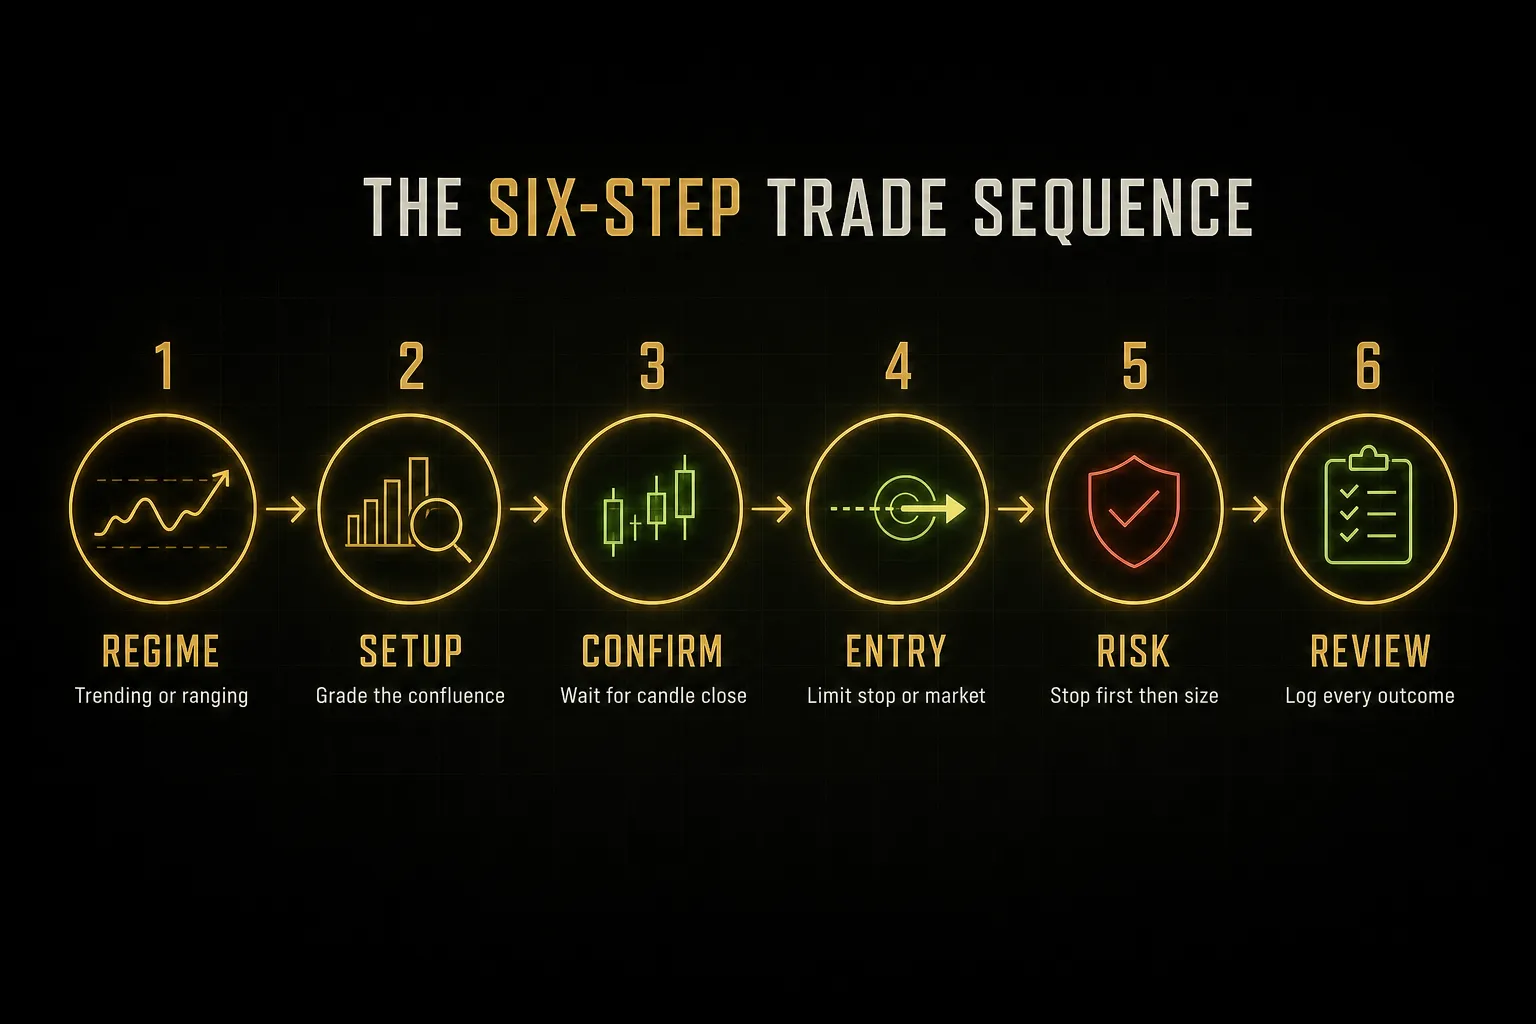
The Buy-to-Exit Decision Process
Most losing trades are lost before entry, in the two minutes when the trader skipped straight to step four.
Here’s the full sequence.
- Identify the market regime. Ask whether price is trending or ranging before you look at any indicator. A market making higher highs and higher lows on the daily chart rewards trend-following signals; a market oscillating between horizontal support and resistance punishes them. Average true range and the slope of a 50-period moving average both help here.
- Judge setup quality. Not every valid signal is a good one. Grade it on confluence: does the signal align with higher-timeframe trend direction, is it near a meaningful level in the market structure, and is there volume confirmation behind the move? Two or more agreeing factors beat one flashing indicator every time.
- Wait for confirmation on candle close. Intrabar signals lie. An RSI cross or a moving average crossover that exists at minute 3 of a 15-minute candle can vanish by minute 15, and you’ll be holding a position that the chart no longer supports. Closed candles are the only version of price action that is permanent.
- Choose an entry method. A limit order gets you a better price on a pullback but risks the trade leaving without you. A stop order above resistance confirms momentum but pays a worse price and more slippage. A market order guarantees fill and nothing else. Pick deliberately, based on whether you value price or certainty more in this specific setup.
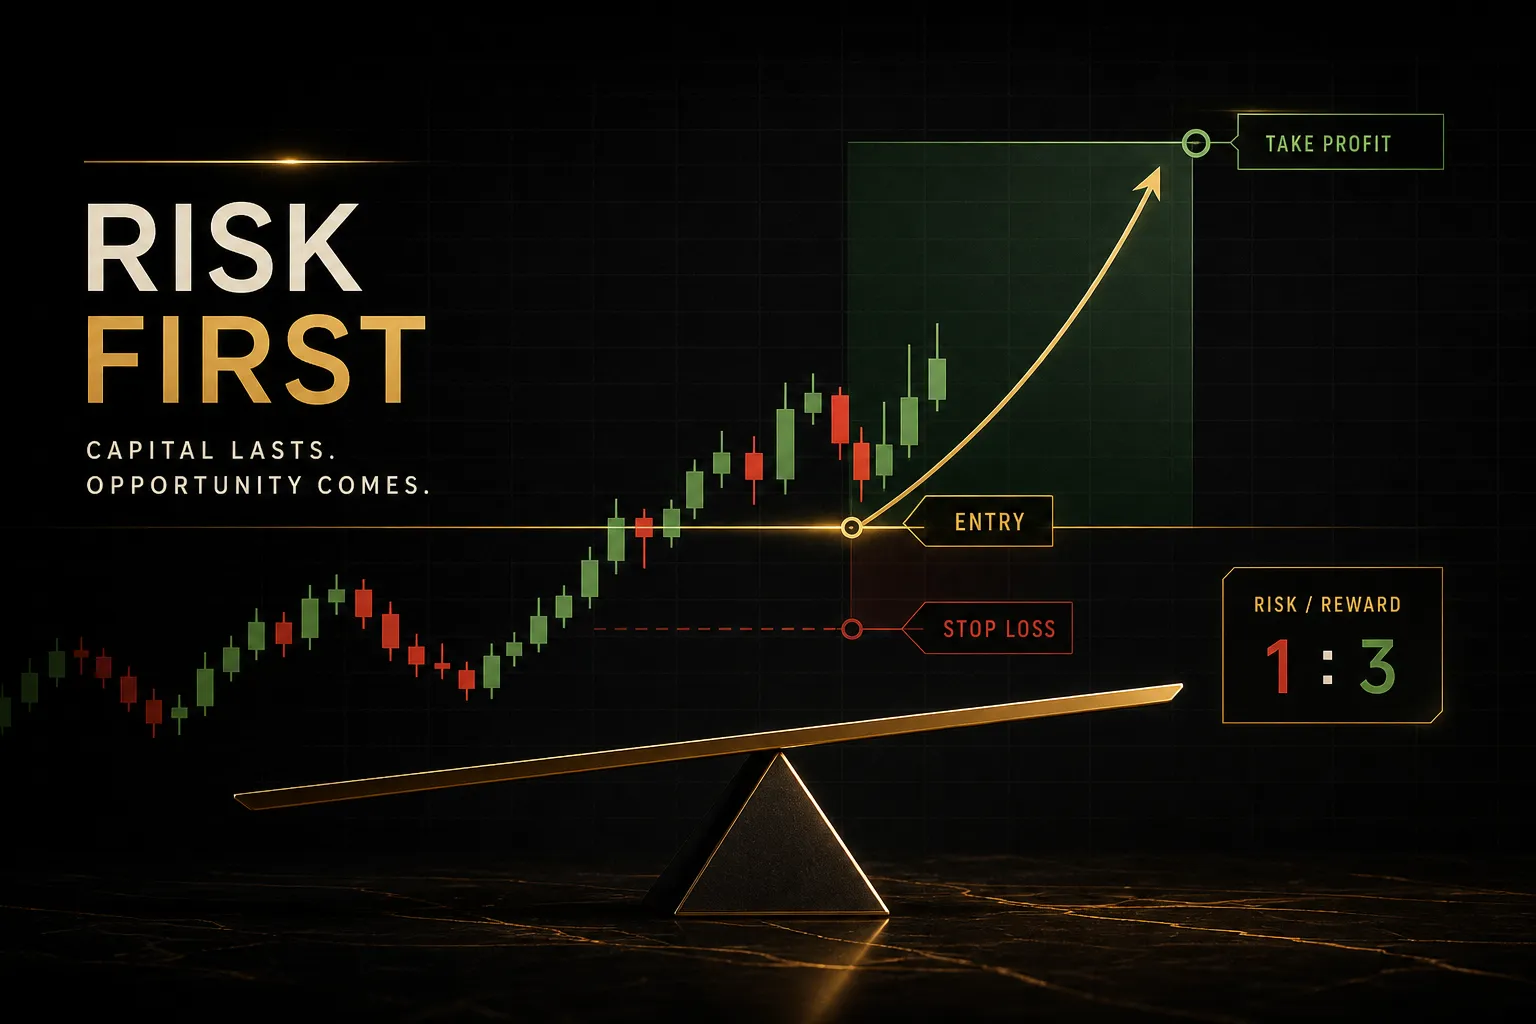
- Place the stop-loss and target before entry. The stop goes where your idea is proven wrong, typically beyond the swing low, the zone boundary, or a multiple of average true range, never at a round dollar figure that feels comfortable. Then size the position so that distance costs you no more than 1-2% of account equity: divide your dollar risk by the per-unit stop distance to get position size.
- Review the trade after it closes. Log the setup, the reason for entry, the outcome, and one sentence on execution quality. A good trade that lost money and a bad trade that made money are both worth flagging, because over 100 trades the process is what compounds, not the individual result.
Step five is where the math lives.
If your account is $10,000, you risk 1% ($100), and your stop sits 25 pips away on a pair where a mini lot moves $1 per pip, your position size is 4 mini lots. Change the stop to 50 pips and the position halves.
Stop distance determines size, not the other way around.
A Worked Example With Multi-Timeframe Confirmation
Say GBP/USD has been grinding higher for two weeks. The daily chart shows higher lows and price holding above a rising 50-period exponential moving average.
Regime: trending.
Step one clears.
On the 4-hour chart, price pulls back into a prior resistance zone that has now flipped to support, and the relative strength index recovers from 42 without ever reaching oversold.
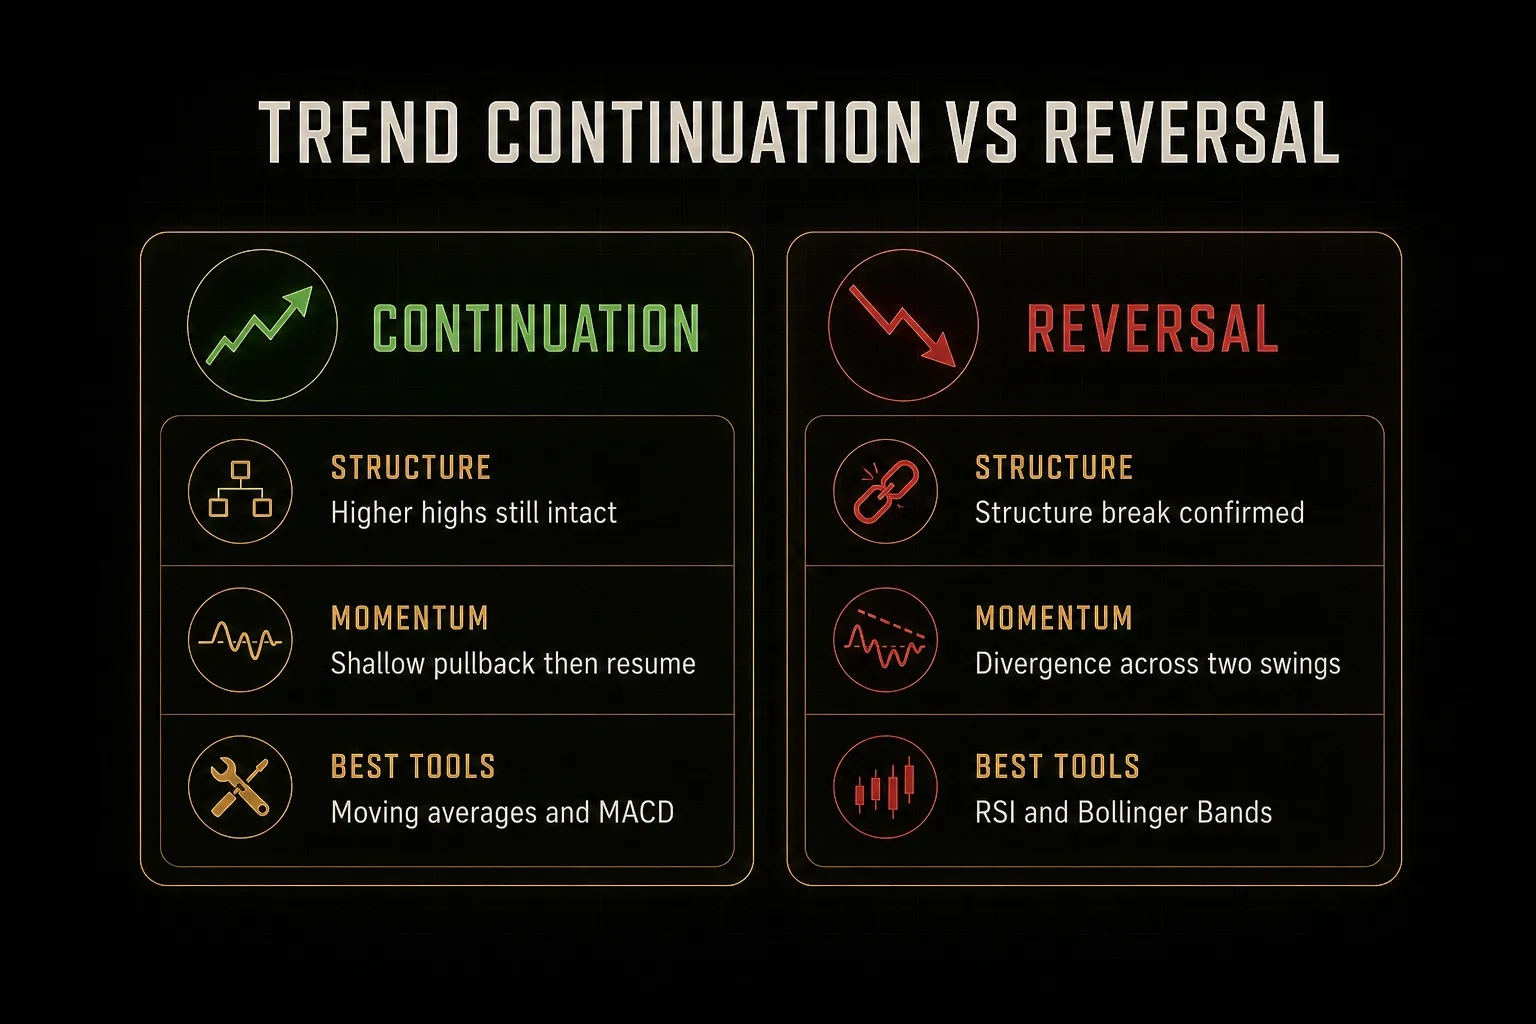
That’s a trend continuation setup, not a reversal.
Confluence: higher-timeframe trend plus structural support plus momentum turning up.
Step two clears.
You wait.
The 4-hour candle closes as a bullish outside bar with above-average volume.
Confirmation on close, not mid-candle.
Step three clears.
Entry goes as a stop order five pips above the confirmation candle’s high, so you only get filled if buyers follow through. Stop-loss sits eight pips below the zone low, which is 34 pips of risk.
Target is the prior swing high, 102 pips away, giving a risk-to-reward ratio of roughly 3:1. On a $10,000 account risking 1.5%, that’s $150 divided by 34 pips, or about 4.4 mini lots.
Whether the trade wins is almost beside the point.
The structure was defined before a single dollar was at risk.
Reading Indicators Without False Signals
Every indicator is a lagging summary of price.
Not one of them knows anything the chart didn’t already tell you. What they do well is enforce consistency, and what they do badly is fire in market conditions they were never designed for.
Moving averages and MACD are trend tools. A moving average crossover works when price is directional and sustained, because the whole premise is that a shorter average pulling away from a longer one signals momentum.
In a range, that same crossover will trigger three times in a week and lose on all three. MACD crossover signals fail the same way for the same reason.
RSI and Bollinger Bands are condition tools. They measure how stretched price is relative to its recent behavior.
In a sideways market, a touch of the lower Bollinger Band with the relative strength index under 30 is a genuinely useful mean-reversion cue. In a strong uptrend, that same setup barely appears, and the overbought readings that do appear are meaningless.
Trend-Following vs Reversal Signals
An RSI of 78 is not a sell signal.
It’s a description.
In a strong uptrend, the relative strength index can sit above 70 for weeks. Traders who short every overbought print during a sustained rally get run over repeatedly, because overbought in a trend means strong, not finished.
Momentum extremes only carry reversal meaning when the underlying structure supports reversal.
What distinguishes a true reversal setup? Three things usually show up together: a break in market structure (a lower low after a run of higher lows), momentum divergence across at least two swings, and a failure at a level that previously held.
One of those alone is noise.
When Indicators Disagree
Three momentum indicators agreeing is not confirmation.
If RSI, Stochastic, and the MACD histogram all read the same recent closing prices, they will usually say the same thing, and you’ve built false confidence out of one data source shown three ways.
Real confirmation comes from independent inputs: trend from a moving average, momentum from an oscillator, participation from volume, and volatility context from average true range.
Four different questions, four different answers.
So what do you do when they conflict?
A rising 50 EMA paired with fading momentum and thin volume is a classic exhaustion signature, and the correct response is usually to stand aside rather than pick a side.
Adding a simple trend-strength or whipsaw filter, something like requiring average true range above its own 20-period average, keeps you out of the low-conviction chop where most small losses accumulate.
Four more reasons a signal that looked obvious can fail in real time:
False breakouts. Price clears resistance by a few ticks, triggers every stop order sitting above, then collapses back inside the range. Waiting for a close beyond the level, and ideally a successful retest, filters a large share of these.
Repainting indicators. Some tools redraw their historical signals as new data arrives, which makes their backtests look extraordinary and their live performance look nothing like it. If an arrow moves after the fact, the indicator is not usable for live decisions.
Lag. A 200-period average by definition reflects the last 200 periods.
That’s a feature for filtering noise and a liability at turning points.
Hindsight bias. Scroll back on any chart and the signals look inevitable. Scroll forward one candle at a time and the same chart is a fog of maybes.
Every teaching example, including the one earlier in this guide, benefits from knowing the ending.
Execution, Timeframes, and Proving Your Edge
A perfect signal can still produce a losing trade.
The gap between what the chart shows and what lands in your account is filled with costs, timing mismatches, and untested assumptions.
Costs That Erode a Correct Signal
Every trade pays a toll before it can profit. Scalpers feel this brutally; long-term investors barely notice.
Know which camp you’re in.
- Spread. The gap between bid and ask is an immediate unrealized loss the moment you enter. On a major forex pair it might be 0.6 pips during London hours and 4 pips at the Sunday open. If your average target is 10 pips, spread alone can consume 6% to 40% of your edge.
- Slippage. Market and stop orders fill at the next available price, not your requested one. During fast moves, a stop-loss placed at 1.2750 can execute at 1.2731, quietly turning a planned 1.5% risk into 2.3%.
- Commissions and financing. Per-lot commissions, overnight swap charges, and crypto funding rates compound across a month of activity. A strategy holding positions for three days needs to clear three nights of financing before it breaks even.
- Weekend and news gaps. Markets that close reopen wherever they want. Stop-losses do not protect you across a gap, which is why holding leveraged positions through earnings reports or weekend risk deserves a deliberate decision rather than a default.
- Thin liquidity around session opens and closes. The first few minutes of the New York equity open and the Asian session handover both show wider spreads and erratic price action. Signals generated in those windows carry noticeably worse fill quality.
Adjusting Rules by Trading Style
The same buy and sell signals mean different things depending on how long you intend to hold. Entry precision, indicator settings, and acceptable costs all scale with your timeframe.
| Style | Typical hold | Entry precision needed | Common indicator settings | Main risk |
|---|---|---|---|---|
| Scalping | Seconds to minutes | Very high, 1-3 pips or ticks | 5 and 13 EMA, 7-period RSI, 1-5 min charts | Spread and slippage consume the edge |
| Day trading | Minutes to hours | High, 5-15 pips | 9 and 21 EMA, VWAP, 14-period RSI, 5-60 min | Intraday news and midday chop |
| Swing trading | 2 days to 3 weeks | Moderate, structural levels | 20 and 50 EMA, daily MACD, 4H and daily | Overnight gaps and financing costs |
| Position / investing | Months to years | Low, zone-based entries | 50 and 200 SMA, weekly RSI, weekly charts | Regime change and prolonged drawdown |
Signal reliability also varies by market.
Forex majors trend cleanly and respect technical analysis reasonably well during active sessions. Large-cap stocks respect support and resistance but gap on earnings.
Crypto runs 24/7 with high market volatility, which produces frequent false breakouts and makes average true range based stops essential. Futures offer deep liquidity and clean price action but leverage magnifies every sizing error.
Validating a Strategy Before Risking Money
Three stages, in order.
Skipping any one of them means your first live trade is also your first test.
- Backtest on historical data. Define the rules precisely enough that another person could follow them, then run them across at least 100 trades covering both trending and ranging conditions. Vague rules produce flattering results.
- Test out-of-sample. Hold back a period the strategy has never seen, ideally a different year with different volatility, and run the same rules unchanged. A strategy that works in-sample and collapses out-of-sample was curve-fitted, not discovered.
- Paper trade in live conditions. Forward-test for 30 to 60 sessions with real-time data, recording every entry, exit, and hesitation. This is where you find out whether you can actually follow the plan when the candle is still forming.
Then measure the right things.
Win rate alone tells you nothing useful.
Expectancy is the number that matters: (win rate × average win) minus (loss rate × average loss).
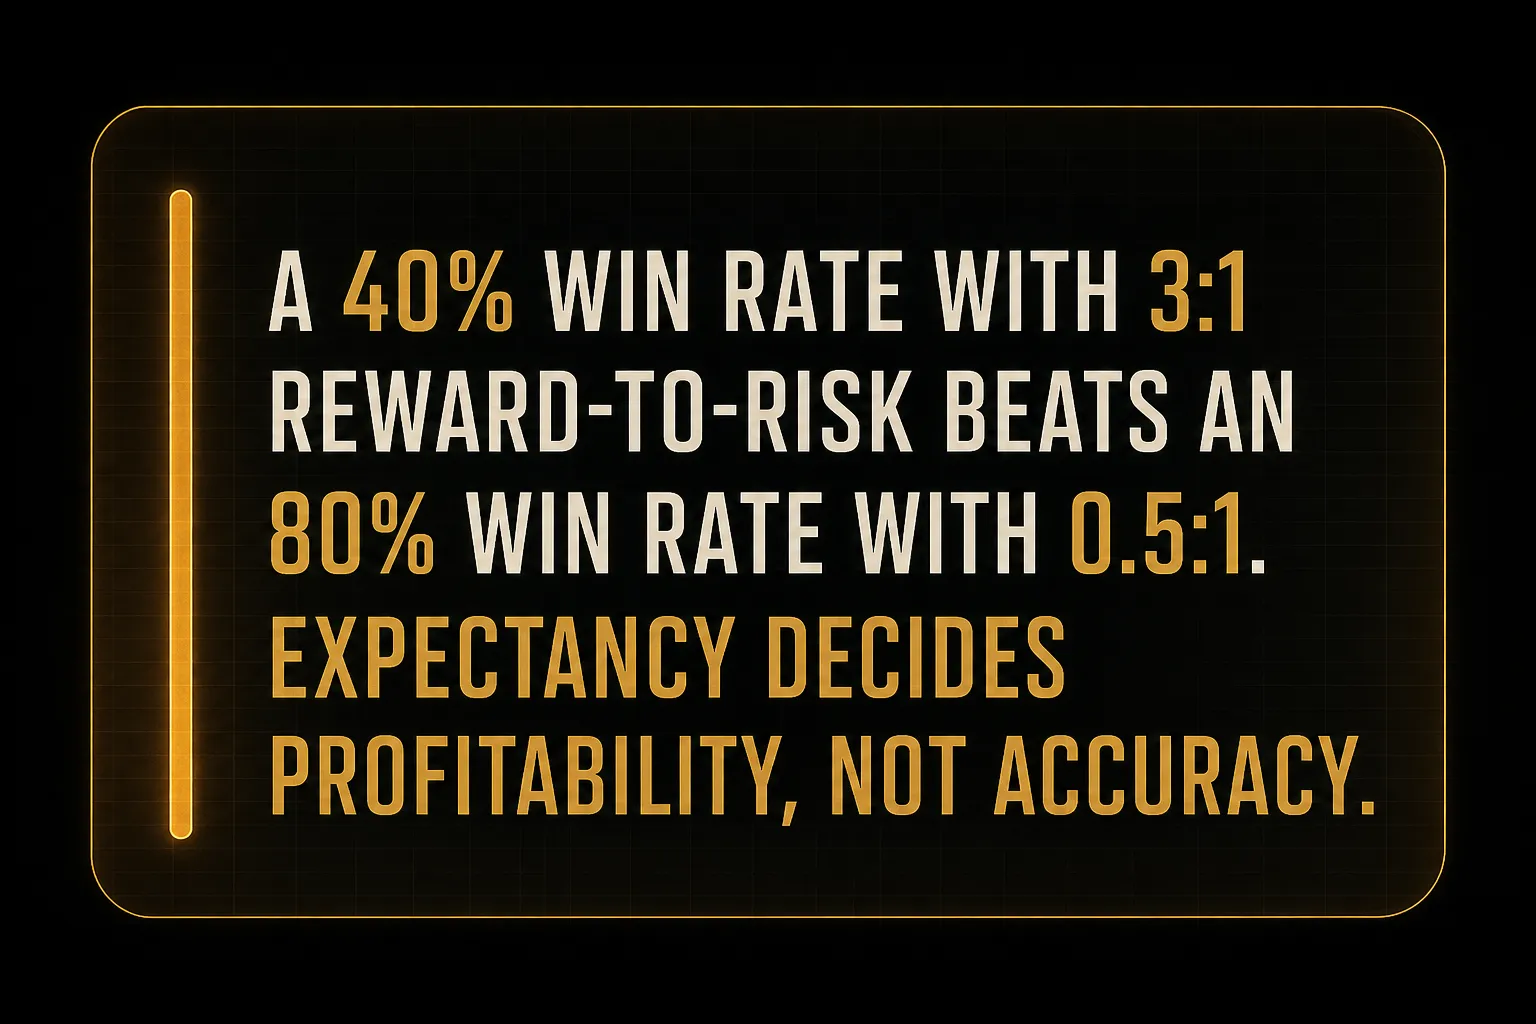
A system winning 40% of trades with an average win of 3R and average loss of 1R has an expectancy of +0.6R per trade.
A system winning 80% with 0.5R wins and 3R losses has an expectancy of ‑0.2R and will bleed the account dry while feeling successful.
Maximum drawdown is the third number.
It tells you the worst peak-to-trough decline the strategy produced, and therefore whether you could psychologically survive it with real money on the line.
Finally, keep a no-trade checklist and honor it.
Skip the setup when price action is choppy with overlapping candles and no clear market structure. Skip it within 15 minutes either side of a major scheduled news release.
Skip it when the spread is more than double its normal level. Skip it during thin liquidity windows.
And skip it whenever the reward-to-risk ratio falls below your minimum, whether that’s 2:1 or 3:1.
The trades you don’t take are part of the strategy.
Common Questions About Buy and Sell Signals
What is the 3-5-7 rule in trading?
The 3-5-7 rule is a risk allocation guideline that caps exposure at three levels: no more than 3% of account equity risked on any single trade, no more than 5% across a group of correlated positions, and no more than 7% total risk across all open trades.
The correlation layer is the part beginners miss.
Three long positions in EUR/USD, GBP/USD, and AUD/USD are not three independent trades; they’re one dollar-short bet in three costumes.
Many traders run tighter numbers, closer to 1-2% per trade, particularly while still validating a strategy.
What is the best buy and sell indicator for beginners?
There is no universally best indicator, and any source claiming otherwise is selling something. Performance depends entirely on market regime, timeframe, and the instrument being traded.
Start with two tools, not ten: one trend filter such as a 50-period exponential moving average, and one confirmation input such as the 14-period relative strength index or volume.
A crowded chart doesn’t produce better decisions, it produces slower ones.
How do you know when to buy and sell in trading?
You buy when a defined setup appears in a market regime that suits it, confirmed on a closed candle, at a price where your stop-loss distance still permits an acceptable risk-to-reward ratio. You sell either when the target is reached, when the stop is hit, or when the reason you entered no longer exists.
The last condition matters most.
If you entered on trend continuation and the market structure breaks, the trade thesis is dead regardless of whether your target or stop has been touched.
What are the signs of a good buy signal?
A good buy signal has confluence and a clear invalidation level. Specifically: alignment with higher-timeframe trend direction, proximity to a meaningful support level or demand zone, confirmation from an independent input such as volume or momentum, and a stop-loss placement that produces at least a 2:1 reward-to-risk ratio.
If you cannot state in one sentence where the trade is wrong, it is not a good signal.
It’s a hope.
Which indicator gives the most accurate buy and sell signals?
No indicator is fully accurate, and accuracy is the wrong target anyway. Every technical tool derives from past price, which means all of them lag to some degree, and any tool that appears not to lag is likely repainting its historical signals.
Multi-timeframe confirmation tends to improve reliability more than swapping one indicator for another, because it filters signals against a broader view of market structure rather than adding another correlated opinion.
Can you make money with buy and sell signals?
Yes, but profitability comes from expectancy and execution discipline, not from the signals themselves. A signal service with 65% accuracy loses money if the average loss exceeds the average win, and a 40% system prints money at 3:1 reward-to-risk.
As of 2026, the availability of automated signal tools has grown considerably, and none of that changes the arithmetic. Position sizing, cost control, and consistent execution decide the outcome.
Trade the Process, Not the Signal
Here’s the decision rule, compressed: if a signal has no clear invalidation level and no confluence, skip it.
Not “watch it closely.”
Skip it.
The market produces thousands of signals a month and you need very few of them.
Filtering aggressively costs you some winners.
It also removes the category of trade that does the most damage, the impulsive entry with an undefined stop and a position size chosen by feel.
One thing to do before your next session.
Take a sheet of paper and write down three lines: the exact condition that triggers your entry, the exact price rule that sets your stop-loss, and the exact condition that closes the trade.
Keep it beside your screen.
When the next green candle appears, you won’t be deciding under pressure. You’ll be checking a plan you already made calmly, which is the only meaningful difference between trading and gambling.
Sources
Risk Disclaimer: Trading involves risk. Past performance doesn't guarantee future results. Only trade with money you can afford to lose. PipTrend is a tool to assist your trading decisions, not financial advice.