
In 2026, markets move faster and with more volatility than ever, making it crucial for traders to understand the forces driving price action. Relying on price alone is no longer enough. Volume-based tools, like the accumulation and distribution indicator, offer powerful insights into institutional buying and selling activity hidden beneath the surface.
This comprehensive guide will demystify the accumulation and distribution indicator, showing you how to calculate, interpret, and apply it in your trading. Whether you want to confirm trends, spot reversals, or sharpen your timing, mastering this tool can give you a real edge. Ready to elevate your trading decisions for 2026? Dive in and discover the strategies that set successful traders apart.
What is the Accumulation and Distribution Indicator?
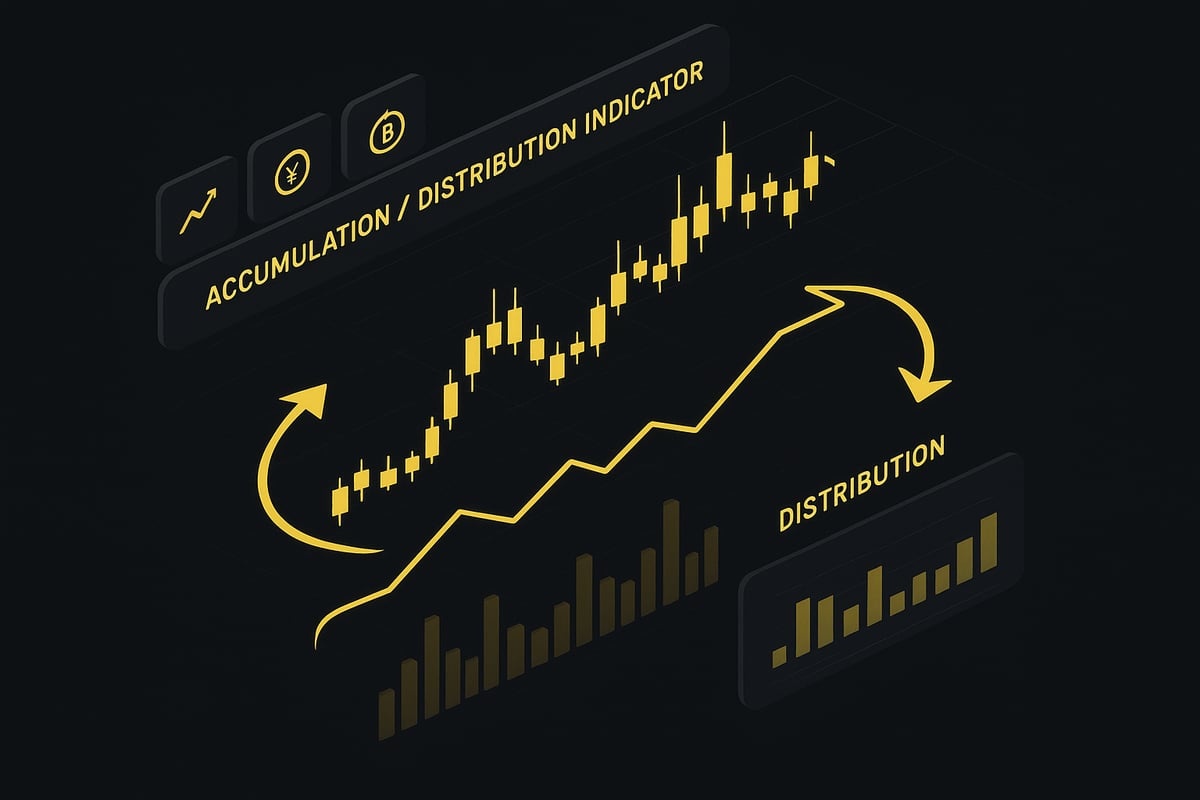
The accumulation and distribution indicator is a foundational tool in technical analysis, helping traders interpret the underlying forces driving price action. Developed to reveal where smart money is moving, this indicator blends price and volume data for deeper market insight. Understanding its history and mechanics is essential for anyone seeking to elevate their trading performance.
Origins and Development
The accumulation and distribution indicator was introduced by Marc Chaikin in the 1970s, originally called the Cumulative Money Flow Line. Chaikin sought to create a method for tracking the flow of capital into and out of stocks, aiming to expose the actions of institutional investors. Since its inception, the indicator has become a mainstay in technical analysis, used across stocks, forex, commodities, and more. Its robust approach to combining price and volume has made it a go-to for professionals and retail traders alike. For a deeper dive into its origins and calculation, see this Accumulation Distribution Indicator: A Beginner’s Guide.
Underlying Principles
At its core, the accumulation and distribution indicator merges price movement with trading volume to highlight buying and selling pressure. The indicator analyzes where a period’s close price sits within its high-low range. If the close is near the high, accumulation is suggested, while a close near the low signals distribution. By factoring in both price location and volume, the indicator uncovers hidden market strength or weakness that is often missed when viewing price alone. This makes it invaluable for detecting subtle shifts in sentiment.
How the Indicator Works
The accumulation and distribution indicator operates as a running total, summing the Money Flow Volume over each period to plot the A/D line. When readings are positive, accumulation is occurring, signaling that buyers are dominant. Negative readings point to distribution, indicating selling pressure. Traders often watch for divergences between the price chart and the A/D line. For example, if price is rising but the A/D line is falling, it may warn of a potential reversal ahead. This predictive element gives traders an edge in volatile markets.
Key Insights and Examples
Historical data reinforces the power of the accumulation and distribution indicator. In 2023, several leading tech stocks displayed clear divergences between price and A/D line before major reversals, allowing observant traders to act early. Both institutional and retail participants use this indicator for trend confirmation and reversal spotting. Notably, a 2024 industry survey ranked volume-based tools like the accumulation and distribution indicator among the top five favorites for active traders, highlighting its ongoing relevance.
Relevance in 2026 Markets
The accumulation and distribution indicator remains vital in today’s fast-evolving markets. With the rise of algorithmic trading, verifying moves with volume-based data is more important than ever. The indicator is highly adaptable, finding use in stocks, forex, crypto, and indices. Its ability to work across both manual and automated systems ensures it remains a staple in traders’ toolkits for 2026 and beyond. Whether confirming trends or spotting early reversals, the accumulation and distribution indicator continues to deliver actionable market insights.
How to Calculate the Accumulation and Distribution Indicator
Understanding how to calculate the accumulation and distribution indicator is essential for traders aiming to decode buying and selling pressure. This section breaks down the process, offers a practical example, clarifies the logic behind the math, highlights common mistakes, and reviews the best tools for calculation.
Step-by-Step Calculation Process
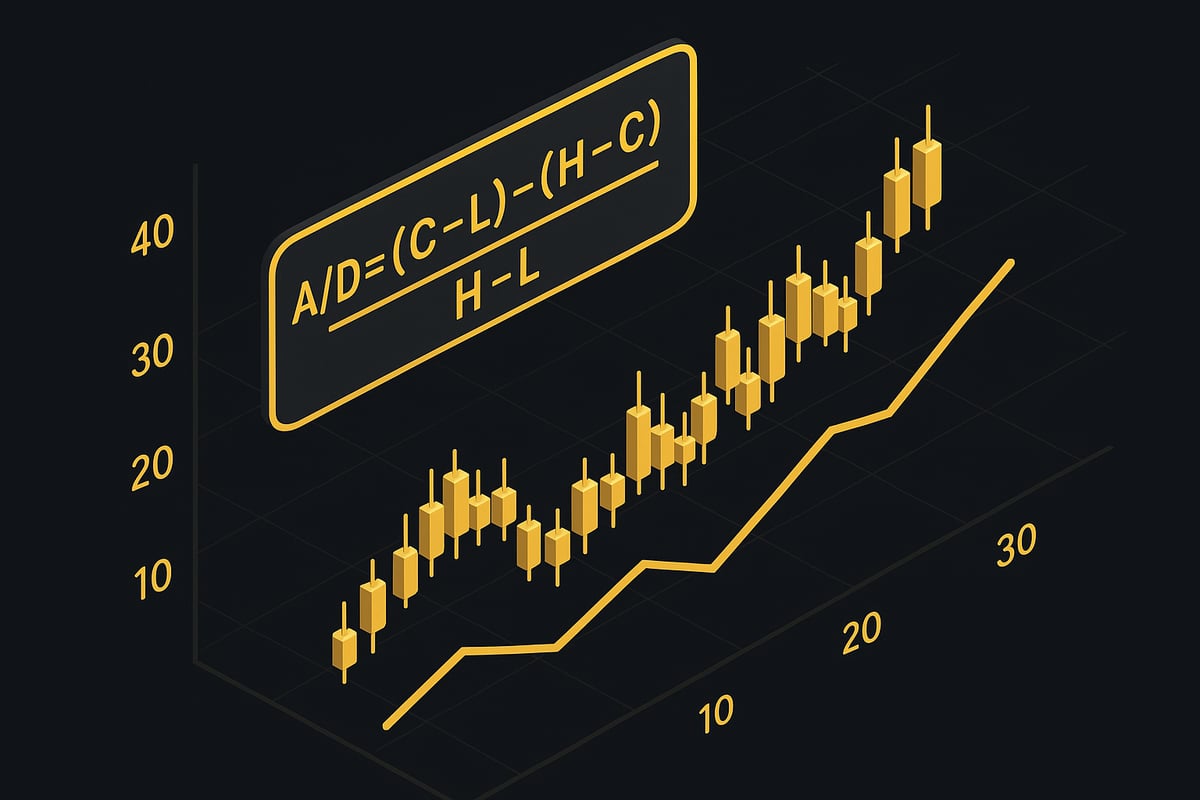
Calculating the accumulation and distribution indicator begins with three essential steps. First, determine the Money Flow Multiplier using this formula:[(Close - Low) - (High - Close)] / (High - Low)
This value reflects where the close falls within the period's range.
Next, multiply the Money Flow Multiplier by the period's volume to get the Money Flow Volume. Finally, add this value to the previous period's A/D value to create a cumulative total.
For a deeper dive into the math and background, refer to the Accumulation/Distribution Index for formula details and practical applications.
Example Calculation
Let’s walk through a simple example with daily stock data. Suppose a stock’s high is 120, low is 100, close is 118, and volume is 20,000. Plug these into the formula to calculate the multiplier.
Result:[(118 - 100) - (120 - 118)] / (120 - 100) = (18 - 2) / 20 = 16 / 20 = 0.8
Multiply 0.8 by 20,000 to get a Money Flow Volume of 16,000. Add this to the previous A/D value to update the accumulation and distribution indicator.
Interpreting the Multiplier
The Money Flow Multiplier can range from +1 to -1. When the close is at the high, the multiplier is +1, signaling strong accumulation. If the close is at the low, it’s -1, suggesting distribution. A close in the middle gives a multiplier near zero, indicating balanced market pressure.
Volume amplifies the effect. A high-volume period with a strong multiplier will impact the accumulation and distribution indicator much more than a low-volume session.
Common Calculation Mistakes
Mistakes often occur when periods with zero volume are included, especially in illiquid assets. Always ensure volume data aligns with price data to avoid skewed results. Failure to adjust for stock splits or dividends can also distort the accumulation and distribution indicator.
Manual errors, like misplacing decimal points or mixing up price fields, are common pitfalls. Double-check your input data and calculations for accuracy.
Tools and Platforms
Most modern trading platforms, such as TradingView and MetaTrader, automatically calculate the accumulation and distribution indicator. These tools also allow for visual customization and integration with other indicators.
Manual calculation remains helpful when building custom strategies or backtesting. Use platform-specific functions or spreadsheets to verify your results before relying on them for real-time trading decisions.
Interpreting the Accumulation and Distribution Indicator in Practice
Understanding how to interpret the accumulation and distribution indicator in real trading scenarios is essential for making informed decisions. This section breaks down the practical steps traders use to decode market activity and improve their timing.
Identifying Accumulation and Distribution Phases
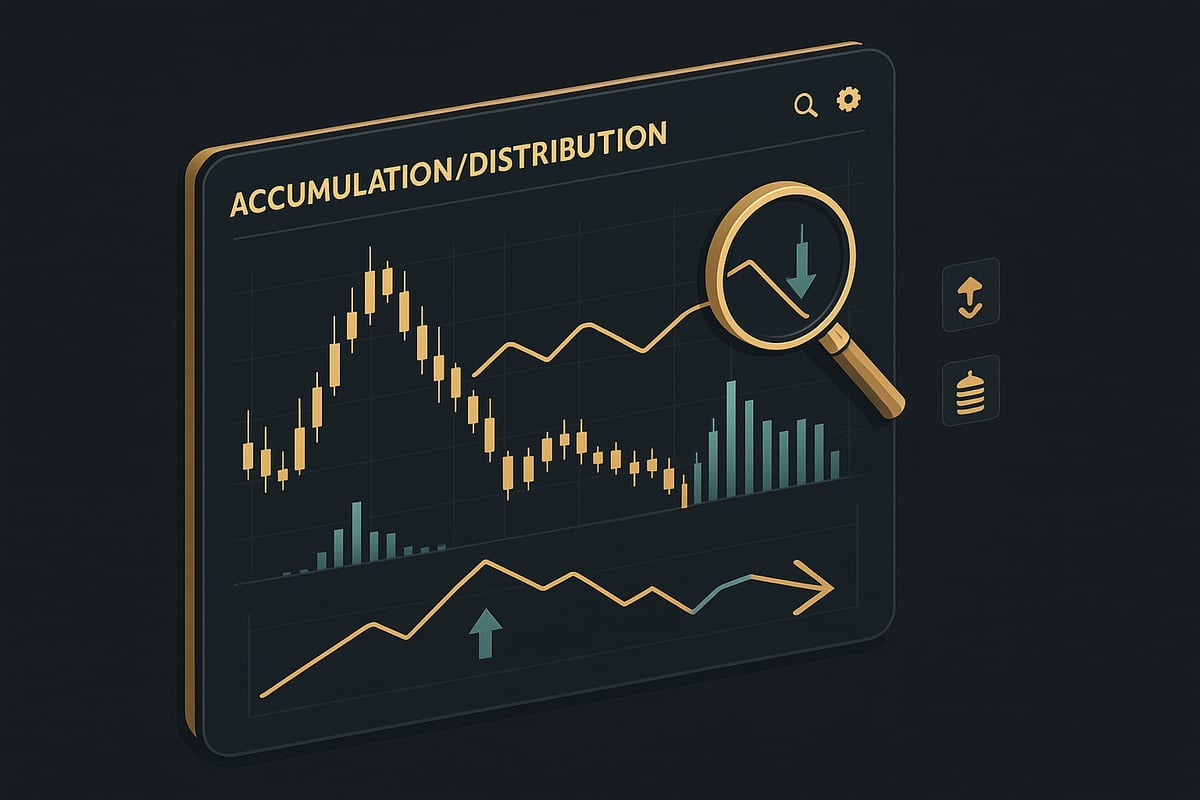
The accumulation and distribution indicator excels at highlighting periods of sustained buying or selling. When the A/D line trends upward, it reflects accumulation, signaling that buyers dominate. A downward path indicates distribution, with sellers in control. Flat movement suggests market indecision or balanced pressure.
To spot these phases, analyze the A/D line alongside price action. For a deeper dive into recognizing these cycles and their chart patterns, explore the Accumulation, Manipulation, and Distribution Cycle in Action. Mastering these basics helps traders anticipate potential breakouts or reversals.
Confirming Price Trends
The accumulation and distribution indicator is a powerful tool for confirming the strength of current price trends. When both price and the A/D line move in the same direction, it validates the trend's momentum. For example, during a strong rally, an A/D line that rises in tandem with price confirms persistent buying.
If the indicator lags or moves sideways as price climbs, it may signal weakening conviction. This confirmation process can help filter out false moves and keep traders aligned with genuine market sentiment. Always compare the indicator's trajectory with price patterns for optimal results.
Spotting Divergences
Divergences between price and the accumulation and distribution indicator often reveal early signs of reversals. A bullish divergence occurs when price sets new lows but the A/D line begins to rise, hinting at underlying accumulation. Conversely, if price hits fresh highs while the A/D line falls, a bearish divergence signals potential distribution.
These divergence signals are especially valuable in volatile markets. Historical examples, such as the 2023 cryptocurrency market, show how A/D divergences can precede major shifts. Monitoring these patterns empowers traders to anticipate turning points.
| Divergence Type | Price Action | A/D Line Direction | Signal |
|---|---|---|---|
| Bullish | Lower lows | Rising | Potential low |
| Bearish | Higher highs | Falling | Potential top |
Volume Spikes and Anomalies
Sudden increases in volume often cause sharp movements in the accumulation and distribution indicator. A large volume spike that drives the A/D line sharply upward can precede a breakout, while a similar drop might signal a breakdown.
Watch for these volume anomalies, especially when they coincide with key support or resistance levels. However, during low liquidity periods, the indicator may generate unreliable signals. Always consider market context and avoid overreacting to isolated spikes.
- Look for volume surges with corresponding A/D jumps.
- Be cautious with signals during thinly traded sessions.
- Use volume context to validate breakouts or breakdowns.
Limitations and False Signals
While the accumulation and distribution indicator is robust, it is not immune to limitations. In illiquid markets, price manipulation can distort the A/D line, creating misleading signals. News-driven volatility may also trigger false moves that do not reflect underlying accumulation or distribution.
To reduce the risk of misinterpretation, pair the indicator with trend or momentum tools. Recognize that no single indicator is foolproof. The best results come from a holistic approach, blending volume-based insights with broader technical analysis.
Practical Tips
To maximize the effectiveness of the accumulation and distribution indicator, keep these strategies in mind:
- Always confirm signals with price action and other volume indicators.
- Use higher timeframes for greater reliability.
- Adjust your approach for asset-specific behaviors, such as forex or stocks.
- Avoid overtrading during periods of low or erratic volume.
- Maintain discipline and review your trades regularly for continual improvement.
By following these guidelines, traders can leverage the accumulation and distribution indicator to sharpen their market edge and make more confident decisions.
Advanced Strategies Using the Accumulation and Distribution Indicator
Mastering advanced strategies with the accumulation and distribution indicator can dramatically improve your trading accuracy. By combining its volume-based insights with structured methodologies, traders can filter noise, enhance entry and exit timing, and manage risk more effectively.

Trend Confirmation and Filtering
The accumulation and distribution indicator excels at validating price breakouts and filtering trades. Before entering a position, check if the A/D line moves in the same direction as the price trend. If both are rising, it confirms bullish momentum. Conversely, a falling A/D line during a price rally warns of a potential false breakout.
To filter trades:
- Only take long positions when both price and A/D trend upward.
- Avoid trades when the A/D line is flat or diverging from price.
- Combine with chart patterns for higher-probability setups.
This approach helps traders focus on high-conviction moves, using the accumulation and distribution indicator as a confidence booster.
Divergence-Based Entries and Exits
Divergence analysis is a powerful application of the accumulation and distribution indicator. When price forms a new high but the A/D line fails to confirm, it signals a possible trend reversal. The same logic applies for bullish divergence when price makes lower lows, but the A/D line begins to rise.
Steps for divergence-based trading:
- Identify divergence between price and the A/D line.
- Enter on confirmation, such as a break of support or resistance.
- Place stop-loss orders beyond recent swing points for protection.
Backtests on major indices between 2023 and 2025 show that divergence signals from the accumulation and distribution indicator often precede significant price reversals.
Integrating with Other Indicators
Combining the accumulation and distribution indicator with complementary tools can refine your strategy. Moving averages are ideal for trend validation, while RSI or MACD offer momentum insights. For example, an A/D line confirming a bullish trend, paired with a moving average crossover and RSI above 50, increases the likelihood of a sustained move.
A table summarizing integration strategies:
| Indicator Combo | Use Case | Benefit |
|---|---|---|
| A/D + Moving Average | Trend confirmation | Fewer false signals |
| A/D + RSI | Momentum and divergence | Earlier entries |
| A/D + MACD | Trend and momentum alignment | Improved timing |
For more on combining these tools, see the Moving Average Indicator Uses guide.
Multi-Timeframe Analysis
Advanced traders use the accumulation and distribution indicator across multiple timeframes. Analyzing the A/D line on a weekly chart provides a macro trend, while the daily or intraday chart helps pinpoint entry and exit points. For example, crypto traders often confirm the primary direction with the weekly A/D, then use the 4-hour chart for precise trades.
Best practices:
- Align trades with the dominant A/D trend on higher timeframes.
- Use lower timeframes for tactical entries.
- Avoid countertrend trades unless strong divergence appears.
This layered approach leverages the accumulation and distribution indicator for both strategic and tactical advantages.
Algorithmic and Automated Strategies
The accumulation and distribution indicator is a favorite among algorithmic traders. Rules-based systems can trigger buy signals when the A/D line crosses above a moving average or when a divergence is detected. Integrating A/D into trading bots enhances decision-making by factoring in both price and volume dynamics.
Key automation tactics:
- Program alerts for A/D crossovers or sharp spikes.
- Combine with other criteria, such as volatility or pattern recognition.
- Backtest algorithms using historical A/D data to refine parameters.
By leveraging automation, traders can execute strategies with the accumulation and distribution indicator efficiently and consistently.
Risk Management and Position Sizing
Sound risk management is vital when using the accumulation and distribution indicator. During distribution phases, reduce position sizes or avoid new trades to limit exposure. Conversely, strong accumulation confirmed by the A/D line can justify slightly larger positions, provided stop-losses are in place.
Tips for effective risk management:
- Adjust trade size according to A/D strength or weakness.
- Set stop-loss orders beyond key swing levels.
- Monitor volume for confirmation before scaling in.
Disciplined use of the accumulation and distribution indicator helps traders avoid overtrading and manage capital prudently.
Real-World Case Studies
Several recent case studies highlight the practical power of the accumulation and distribution indicator. In 2025, institutional accumulation in the energy sector was detected early by a rising A/D line, preceding a major rally. Similarly, forex traders used A/D divergence to anticipate EUR/USD trend reversals with notable accuracy.
These examples underscore the value of integrating the accumulation and distribution indicator into advanced trading systems. Applying these strategies can help traders navigate volatile markets with greater confidence and effectiveness.
Comparing the Accumulation and Distribution Indicator with Similar Tools
Navigating the crowded field of volume-based analysis requires clarity on how each tool functions. The accumulation and distribution indicator stands out, but how does it compare to other popular technical indicators? Understanding these differences empowers traders to select the right tool for their strategy. For a broader look at technical indicators and their roles, see Technical Indicators Explained.
A/D vs. On-Balance Volume (OBV)
The accumulation and distribution indicator and OBV both track price and volume, but their methodologies differ. OBV calculates a running total based solely on whether the price closes higher or lower, ignoring the position within the range. In contrast, the accumulation and distribution indicator considers where the close falls between the high and low, offering a more nuanced view.
| Feature | Accumulation/Distribution | OBV |
|---|---|---|
| Price-Volume | Yes | Yes |
| Range Position | Yes | No |
| Sensitivity | Moderate | High |
This distinction allows the accumulation and distribution indicator to spot subtle accumulation or distribution phases that OBV might miss. For example, in 2024, hidden buying in tech stocks was detected earlier using the accumulation and distribution indicator, while OBV lagged.
A/D vs. Chaikin Money Flow (CMF)
Comparing the accumulation and distribution indicator to CMF reveals key differences in calculation and application. CMF takes the average of the money flow multiplier over a set period, resulting in a value that oscillates around zero. The accumulation and distribution indicator, however, is cumulative, building a line that reflects ongoing buying or selling pressure.
CMF excels at highlighting short-term shifts in sentiment, while the accumulation and distribution indicator is tailored for identifying sustained trends. Traders seeking to capture longer trends may prefer the accumulation and distribution indicator, while those focusing on quick reversals often use CMF.
A/D vs. Money Flow Index (MFI)
The accumulation and distribution indicator and MFI both incorporate price and volume, but the MFI functions as an oscillator, generating overbought and oversold signals. The accumulation and distribution indicator, meanwhile, tracks the direction of money flow without fixed bounds.
MFI is ideal for timing entries during pullbacks or when markets are extended, whereas the accumulation and distribution indicator is more effective for confirming the underlying trend. This makes them complementary, rather than interchangeable, in a trader’s toolkit.
Strengths, Weaknesses, and When to Use Each
The accumulation and distribution indicator excels at confirming trends and spotting divergences, making it invaluable for swing and position traders. OBV offers simplicity and speed for broad scans, while CMF and MFI add layers of confirmation, especially for momentum or reversal strategies.
A recent industry survey found that 67% of traders combined the accumulation and distribution indicator with at least one other volume-based tool for improved accuracy. Use the accumulation and distribution indicator for in-depth volume analysis in trending markets, and supplement with OBV, MFI, or CMF when seeking additional confirmation or specific signals.
Integrating the Accumulation and Distribution Indicator with Modern Trading Platforms
Modern traders demand seamless access to powerful analysis tools. The accumulation and distribution indicator is widely supported across popular trading platforms, making integration straightforward in 2026.
Platform support for the accumulation and distribution indicator is robust. Leading platforms like TradingView, MetaTrader, and NinjaTrader offer native integration. Most broker platforms also include the indicator in their default toolkits, ensuring accessibility for both new and experienced traders.
Setting up the accumulation and distribution indicator is simple. On TradingView, for example, you can add it to any chart with just a few clicks. For a detailed walkthrough, refer to the TradingView Indicators Setup guide, which covers adding, customizing, and visualizing indicators like A/D. Custom scripting options are available for advanced users who wish to tweak parameters or develop hybrid indicators.
Backtesting strategies using the accumulation and distribution indicator is highly recommended. Platforms allow you to analyze historical price and volume data to optimize your approach. Adjust the indicator’s sensitivity to fit asset classes such as stocks, forex, or crypto. This ensures your trading strategy remains responsive to market conditions.
Automation and alerts take your trading to the next level. Set up notifications for key A/D events, like crossovers or significant divergences, so you never miss a trading signal. Many platforms support automated trading systems, letting you integrate the accumulation and distribution indicator into algorithmic bots for hands-off execution.
Mobile compatibility is now essential. The accumulation and distribution indicator is fully supported on most trading apps, including the TradingView mobile app. This enables you to monitor signals and manage trades from anywhere, with real-time synchronization across all your devices.
However, be mindful of platform-specific pitfalls. Ensure your data feed includes reliable volume information, especially in forex or cryptocurrency markets. Always verify that your chart’s time zone and session settings align with the market you are analyzing. These small details can affect the accuracy of the accumulation and distribution indicator.
Integrating the accumulation and distribution indicator into your trading platform empowers you to make more informed decisions in 2026. With proper setup, backtesting, and real-time alerts, you can confidently use this tool across all devices and market environments.
Frequently Asked Questions about the Accumulation and Distribution Indicator
Understanding the accumulation and distribution indicator is essential for modern traders who want a deeper edge in technical analysis. Here, we answer the most pressing questions to help you use this tool with confidence in any market environment.
What types of assets is the accumulation and distribution indicator best suited for?
The accumulation and distribution indicator works well across a diverse set of assets. Its effectiveness is highest in markets with transparent and reliable volume data. Here’s a quick summary:
| Asset Type | Suitability | Notes |
|---|---|---|
| Stocks | Excellent | Reliable volume, supports A/D well |
| ETFs | Excellent | High liquidity, accurate readings |
| Commodities | Good | Volume may vary by contract |
| Forex | Good (major pairs) | Volume is tick-based, less precise |
| Cryptocurrencies | Very Good | 24/7 trading, volume transparency |
The accumulation and distribution indicator is most effective for stocks, ETFs, and crypto. Use caution in illiquid or low-volume markets.
How does the accumulation and distribution indicator handle gaps and illiquid periods?
Price gaps can create sudden spikes in the accumulation and distribution indicator. It is important to interpret such moves in context, as gaps might not always reflect genuine buying or selling pressure.
Illiquid periods often produce unreliable readings. Thinly traded assets can distort the accumulation and distribution indicator line, leading to misleading signals. Always cross-reference with volume and price action.
Can the accumulation and distribution indicator be used for intraday trading?
Yes, the accumulation and distribution indicator is widely used by intraday traders, especially on highly liquid assets. It helps confirm momentum and trend direction on short timeframes.
For example, forex scalpers often use the accumulation and distribution indicator on 5-minute charts to spot momentum shifts. However, shorter timeframes can be noisier, so combine with other indicators for best results.
How often should traders check the accumulation and distribution indicator line?
The frequency depends on your trading style. Swing traders should review the accumulation and distribution indicator daily, focusing on overall trend and divergence.
Active or intraday traders may monitor the line throughout the trading session. Setting up automated alerts for key events, such as divergence or crossovers, ensures that you never miss a critical signal.
What are the most common mistakes when using accumulation and distribution indicator?
Relying solely on the accumulation and distribution indicator without considering price action is a frequent error. Ignoring divergence warnings or overtrading during low-volume periods can also lead to losses.
To avoid mistakes, always combine the accumulation and distribution indicator with other tools. For instance, pairing it with the RSI Index Trading Guide can strengthen your trend confirmation and divergence analysis.
How does the accumulation and distribution indicator compare to price-only indicators?
The accumulation and distribution indicator offers unique insights by incorporating volume, unlike price-only tools. This allows traders to detect shifts in market sentiment that price alone may not reveal.
For example, the accumulation and distribution indicator often identifies trend reversals earlier than moving averages or simple price-based oscillators. It adds a valuable layer of confirmation for any technical strategy.
Are there risks of false signals?
Yes, the accumulation and distribution indicator can generate false signals, especially during news-driven volatility or in thinly traded markets. Sudden spikes in volume can distort the indicator and lead to incorrect conclusions.
Mitigate risk by using longer timeframes and combining the accumulation and distribution indicator with complementary indicators. Always validate any signal with broader market context.
Can the accumulation and distribution indicator be customized or improved?
Advanced traders often customize the accumulation and distribution indicator by applying moving averages or smoothing techniques. Some integrate the indicator into algorithmic or AI-driven systems for more precise signals.
Hybrid models, such as combining the accumulation and distribution indicator with momentum oscillators, can enhance reliability and adapt to specific asset classes or trading styles.
Additional Resources and Learning
To deepen your understanding of the accumulation and distribution indicator, explore professional documentation like the Accumulation Distribution | Financial | Formulas | Analyze Data | Documentation | Learning guide. For further study, consider books on volume analysis, online trading courses, or joining active trading communities. Many platforms also offer tutorials to help you master the accumulation and distribution indicator in real-world scenarios.
After exploring how the Accumulation and Distribution indicator can help you spot real market moves and avoid false signals, it’s clear that reliable, up-to-the-minute tools are essential for consistent trading success in 2026. That’s where PipTrend comes in—it brings clarity and confidence to your decision-making with real-time buy and sell signals, multi-timeframe analysis, and instant alerts. If you’re ready to take what you’ve learned about volume-based indicators and put it into practice with an AI-powered edge, you owe it to yourself to See Your Trading Improve With PipTrend.