
In 2026, volatility is the battleground where trading fortunes are made. Are you truly reading the signals the markets send, or are you missing out on critical cues?
This guide unlocks the secrets of the atr range indicator, the essential tool for decoding market turbulence. Whether you are a novice or a seasoned trader, understanding this indicator can transform how you approach risk, timing, and profit potential.
We will explore what ATR is, how it measures volatility, detailed calculation steps, advanced strategies, integration with modern trading platforms, and the future of volatility analysis.
Get ready to master the atr range indicator and gain the edge you need for smarter, more profitable trades in today’s unpredictable markets.
Understanding the ATR Range Indicator: Foundations & Evolution
The atr range indicator is a cornerstone of modern technical analysis, designed to help traders measure one thing: volatility. Unlike many indicators that focus on price direction, ATR zeroes in on how much price moves, regardless of which way it moves. This unique focus gives traders a clear sense of the market’s “pulse,” helping to distinguish between periods of calm and times of turbulence.
Developed by J. Welles Wilder Jr. in 1978, the atr range indicator quickly earned its place among essential trading tools. Wilder originally introduced ATR in his book "New Concepts in Technical Trading Systems," aiming to solve the problem of measuring volatility in commodities. Over time, its usefulness led to widespread adoption across forex, stocks, indices, and more. Today, ATR is a staple for both discretionary and algorithmic traders.
Why does volatility matter so much? The atr range indicator acts as a radar for market activity. When ATR values rise, it signals that price swings are becoming larger, often due to news events or shifts in market sentiment. Low ATR readings, on the other hand, suggest consolidation and less risk for sudden moves. For risk management and timing, understanding volatility is as critical as predicting direction.
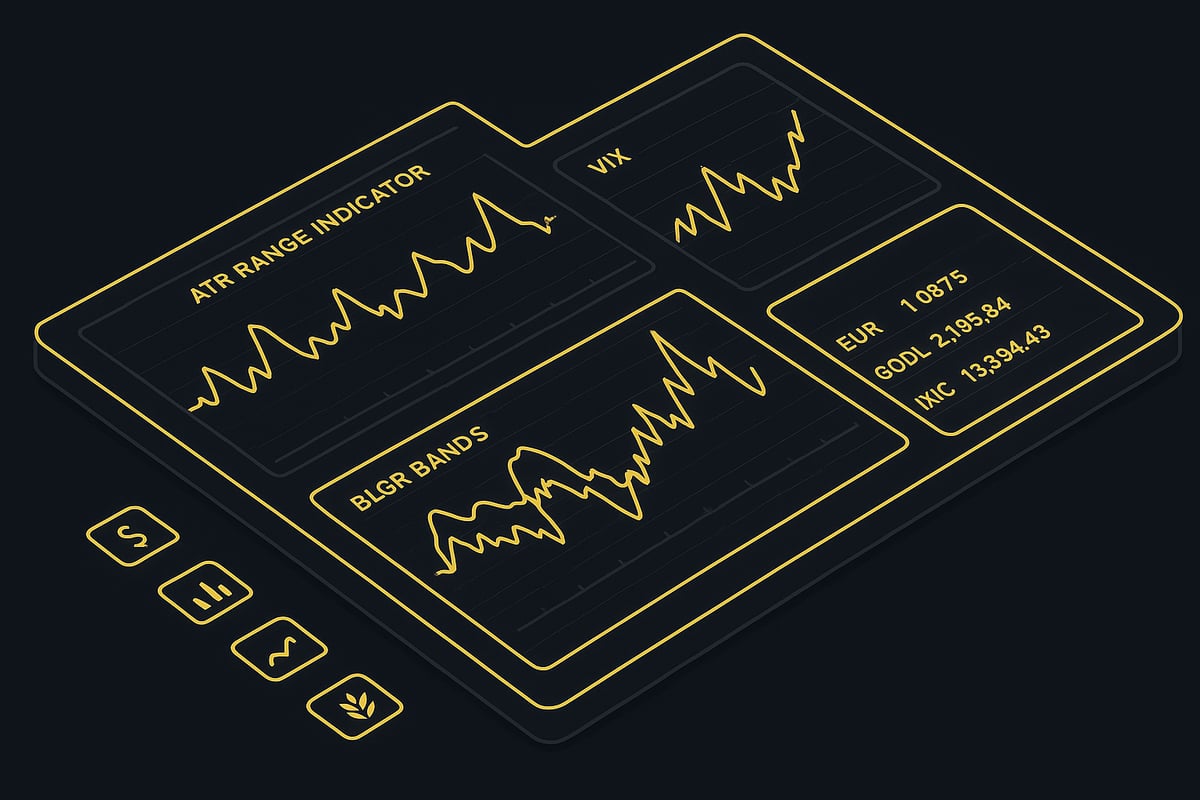
How does the atr range indicator compare to other volatility tools? While ATR uniquely measures average price movement over time, indicators like Bollinger Bands and the VIX approach volatility differently. Bollinger Bands use price envelopes based on standard deviation, visually expanding and contracting with volatility. The VIX, meanwhile, tracks implied volatility in options markets. For a deeper dive into these distinctions, see Bollinger Bands vs ATR.
| Indicator | Focus | Best Use Case |
|---|---|---|
| ATR | Historical volatility | Measuring daily price swings |
| Bollinger Bands | Price deviation | Identifying overbought/sold |
| VIX | Implied volatility | Gauging market fear |
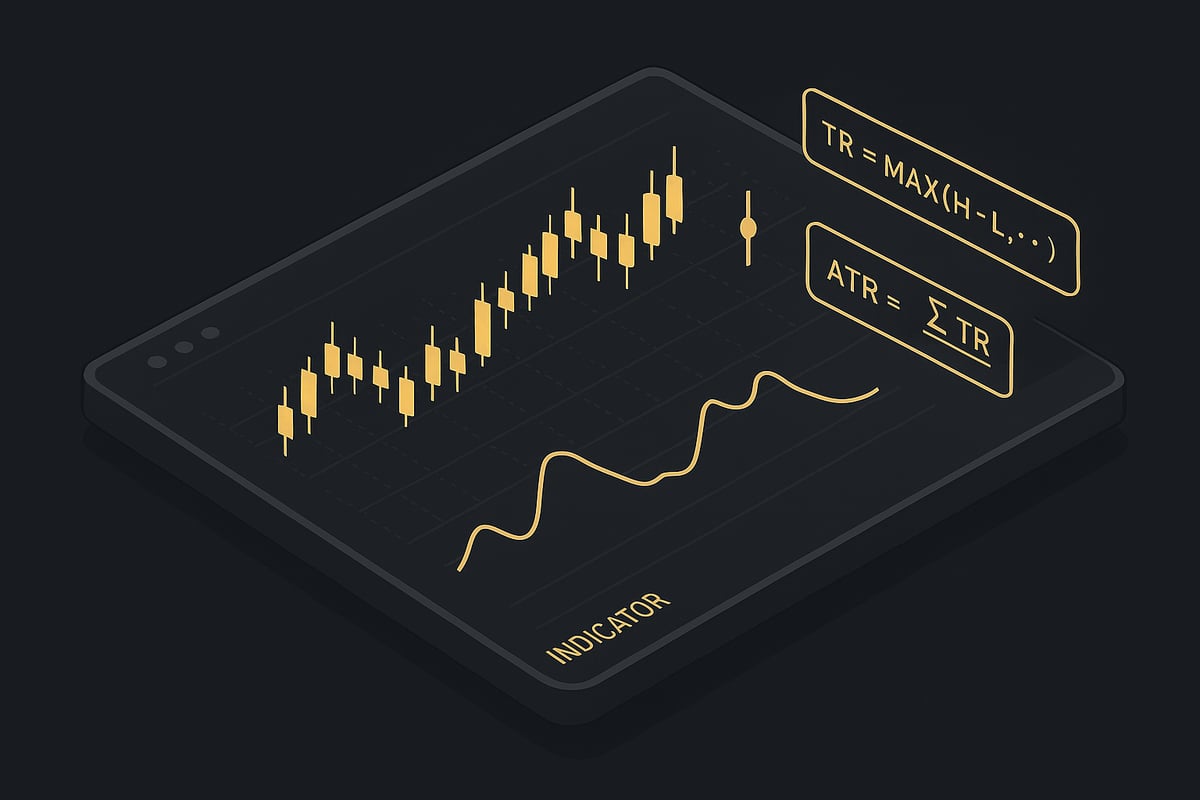
The calculation at the heart of the atr range indicator starts with the concept of True Range, which captures the greatest of three values: current high minus low, absolute high minus previous close, or absolute previous close minus low. Averaged over a typical period (14 bars by default), this rolling measure adapts to both slow and fast markets.
ATR’s adaptability is a key strength. You’ll find the atr range indicator used in:
- Forex (measuring pips and setting dynamic stops)
- Stocks (identifying breakout candidates)
- Indices (gauging overall market volatility)
- Commodities (adapting to seasonal price swings)
Consider how ATR values shift in different environments. In a trending market, the atr range indicator tends to rise as price moves accelerate. In a ranging or consolidating market, ATR contracts, reflecting tighter price action. For example, during an earnings season, a stock’s ATR may spike, signaling increased trading opportunities.
The most important insight? The atr range indicator does not predict whether prices will go up or down. Instead, it reveals how intense the movement is, letting traders adjust their risk and strategy accordingly.
How to Calculate and Interpret ATR: Step-by-Step Guide
Understanding how to calculate and interpret the atr range indicator is essential for every trader aiming to master volatility. This step-by-step guide breaks down the ATR process, building from the core calculation to real-world interpretation and customization.
Step 1: Calculating True Range (TR)
The foundation of the atr range indicator is the True Range (TR). Unlike a simple high-low calculation, True Range captures all price movement, including gaps and overnight volatility.
The formula for TR is:
TR = max(
 current_high - current_low,
 abs(current_high - previous_close),
 abs(previous_close - current_low)
)
Why use True Range? Markets often gap up or down between sessions, and these moves represent real volatility. By considering the absolute difference from the previous close, the TR ensures that all price shocks are included.
For example, imagine a stock with:
- Previous close: $50
- Current high: $53
- Current low: $49
Calculate:
- High – Low = $4
- High – Previous Close = $3
- Previous Close – Low = $1
So, TR = max($4, $3, $1) = $4
This approach means the atr range indicator gives a more accurate volatility read, especially in fast-moving or news-driven markets. In volatile sessions, TR will often be much higher than the simple daily range, providing a better sense of risk.
Step 2: Averaging the True Range (ATR)
With True Range values in hand, the next step in using the atr range indicator is to calculate the Average True Range (ATR). Traditionally, this uses a 14-period window, but traders can adjust this based on their strategy or asset class.
There are two common methods:
- Simple Moving Average (SMA): A straightforward average of TR values.
- Exponential Moving Average (EMA): Weighs recent TRs more heavily, making the ATR more responsive.
Suppose your last 14 TR values are: 0.8, 1.0, 0.9, 1.2, 1.1, 0.7, 1.3, 1.0, 0.8, 1.1, 0.9, 1.2, 1.0, 1.1. The 14-period ATR (using SMA) would be the sum of these values divided by 14.
Most trading platforms automate this process, but manual calculation builds your confidence and skill with the atr range indicator. Shorter ATR periods react quickly to market changes, while longer periods smooth out noise.
To explore detailed walkthroughs and visual examples, see this ATR Calculation and Interpretation resource.
Step 3: Interpreting ATR Readings
Interpreting the numbers from the atr range indicator is where volatility insights come alive. A high ATR reading means the market is experiencing large price swings, often tied to news, breakouts, or reversals. Low ATR signals a quiet, consolidating market.
For instance, if ATR spikes right before a major economic announcement in forex, it can hint at an impending breakout. Conversely, a low ATR could mean prices are moving sideways, suggesting less opportunity for big moves.
It is critical to remember the atr range indicator reveals volatility, not direction. Traders sometimes make the mistake of assuming that rising ATR means a new trend will start. Instead, ATR simply quantifies the intensity of price movement.
A smart approach is to use ATR in tandem with price action. For example, if ATR climbs while a currency pair breaks out of a range, this can provide a high-probability entry. On the other hand, shrinking ATR often signals trend exhaustion, suggesting a potential exit.
Common Customizations & Pitfalls
Customizing the atr range indicator for different assets and timeframes is vital. Day traders might use a 7-period ATR for quick signals, while swing traders might prefer a smoother 21-period setting. Backtesting is essential to ensure your chosen ATR period matches your strategy and asset volatility.
Common pitfalls include:
- Overfitting ATR to past data, leading to unreliable results.
- Ignoring the broader market context when interpreting ATR.
- Using the same ATR period for all assets, which can reduce effectiveness.
Always ensure your atr range indicator settings are tailored and tested. This adaptive approach helps you avoid common mistakes and make the most of ATR's powerful volatility insights.
ATR in Action: Practical Trading Strategies for 2026
In 2026, the atr range indicator stands at the core of modern trading strategies. Traders leverage its ability to quantify volatility, adapting their approach across various markets and conditions. Let us break down how you can use the atr range indicator for precise stop loss placement, risk management, entry and exit timing, and robust multi-indicator systems.
ATR-Based Stop Loss and Take Profit Placement
Setting stop losses and take profits with the atr range indicator transforms risk control from guesswork into a data-driven process. Unlike static pip or point stops, ATR-based stops adapt to market volatility, reducing the risk of being stopped out by random price spikes.
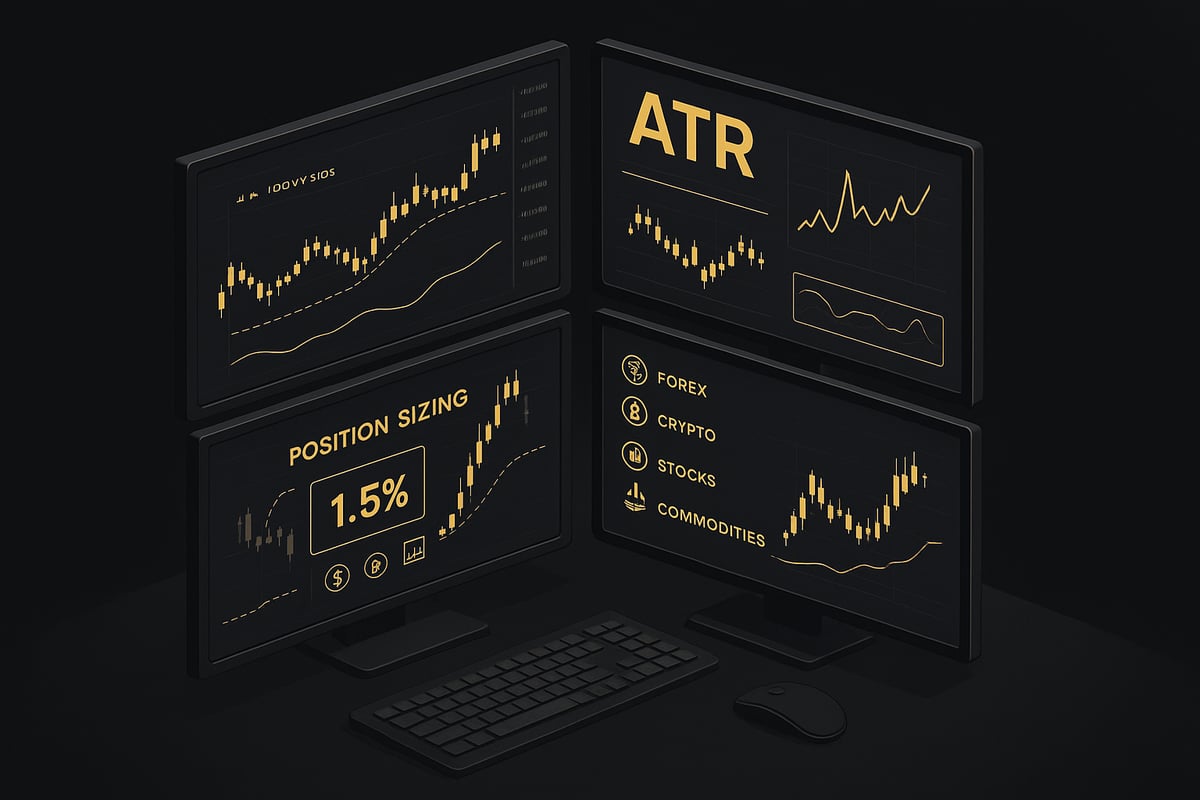
A popular approach is to set stops at a multiple of the current ATR value. For example, a trader might place a trailing stop at 1.5 times the ATR below the entry price in a long trade. This method accounts for current market turbulence and allows trades room to breathe during high-volatility sessions.
| Strategy | Multiplier | Use Case |
|---|---|---|
| Conservative | 1.0 x ATR | Tight risk, low volatility |
| Standard | 1.5 x ATR | Trending markets |
| Aggressive | 2.0 x ATR | High volatility, swing |
Take profits can also be scaled using the atr range indicator. For instance, some traders target 2x or 3x ATR from entry, capturing moves that match or exceed recent volatility. This dynamic approach aligns profit targets with the market’s current “mood.”
One key advantage: ATR-based stops are less likely to be triggered by random volatility, especially during news releases or market opens. However, avoid rigidly applying the same multiplier to every asset or timeframe. Backtest your settings and remain flexible to market context.
For a deeper dive into these techniques, you can explore practical examples and strategies in this ATR-Based Trading Strategies guide.
Position Sizing and Risk Management with ATR
The atr range indicator is invaluable for sizing positions according to real-time volatility. When ATR is high, price swings are larger, so using the same position size as in calm periods can quickly lead to outsized losses.
A common formula links risk per trade directly to ATR:
Position Size = Dollar Risk per Trade / (ATR x Multiplier)
If you risk $100 per trade and ATR is 0.0050 in EUR/USD, using a 1.5 multiplier, your position size would be:
Position Size = $100 / (0.0050 x 1.5) = 13,333 units
This ensures that, regardless of market conditions, your risk stays consistent. In highly volatile environments, the atr range indicator prompts you to reduce position size. When markets are calm, you can scale up safely.
Retail trading data shows that over 70% of accounts lose money, often due to poor risk management. By calibrating your trade size to the atr range indicator, you protect yourself from the risk of ruin during sudden surges. Always adjust your ATR period for the asset and timeframe in play, and backtest your risk models regularly.
ATR for Entry and Exit Timing
The atr range indicator is not just for managing risk; it is also a powerful timing tool. When ATR values spike above their historical average, it often signals a breakout or trend initiation. Traders look for these volatility surges as confirmation that a price move has real strength.
For example, if a forex pair has been consolidating with a low ATR, and suddenly ATR jumps as price breaks out of a range, this is a high-probability entry signal. Conversely, when ATR contracts after a strong move, it may indicate trend exhaustion and a good time to exit.
Combine the atr range indicator with price action to filter out false signals. Entering trades during low ATR periods often results in little movement and lower opportunity. Use ATR as a volatility filter for both trend-following and mean-reversion strategies, ensuring you only act when the market is truly moving.
Combining ATR with Other Indicators
The real power of the atr range indicator emerges when combined with other technical tools. For example, overlaying ATR with moving averages helps confirm trend direction. Adding RSI or Stochastic can pinpoint overbought or oversold conditions, adjusted for current volatility.
A practical setup might involve using the atr range indicator as a filter: only take trades when ATR is above a certain threshold, and the moving average confirms the trend. This reduces whipsaws in choppy markets and strengthens your overall trade setup.
ATR also fits into multi-indicator systems. For example, you might set up a strategy where a trade is only triggered if ATR is elevated, a moving average crossover occurs, and RSI is in alignment. This layered approach adds robustness and helps avoid common pitfalls like trading against dominant volatility flows.
Remember, the atr range indicator does not predict direction; it clarifies the intensity of price movement. When contextualized with other indicators and market context, ATR becomes a cornerstone for professional, disciplined trading.
Advanced ATR Techniques and Automation in Modern Trading
Navigating today’s markets requires more than basic tools. The atr range indicator has evolved into a critical component for traders seeking precision and adaptability. Let’s explore advanced techniques and automation strategies that will define ATR mastery in 2026.

Multi-Timeframe ATR Analysis
Harnessing the atr range indicator across multiple timeframes provides a panoramic view of market volatility. By analyzing ATR values on daily, 4-hour, and 1-hour charts, traders uncover hidden patterns that single timeframe analysis might miss.
For example, a high daily ATR combined with a low intraday ATR can signal underlying consolidation. This insight helps traders avoid false breakouts and align entries with the dominant volatility trend. Advanced traders employ ATR heatmaps and volatility dashboards, which visually map out ATR shifts across several assets and timeframes. This approach minimizes the risk of trading against prevailing volatility flows.
Multi-timeframe analysis is essential for both discretionary and algorithmic strategies. For a deep dive into structuring trades with this approach, review Multi-Timeframe Trading Strategies for practical applications.
Key advantages:
- Improved trade alignment with major volatility cycles
- Enhanced detection of breakout or consolidation zones
- Data-driven avoidance of whipsaw trades
Incorporating the atr range indicator in this way transforms raw data into actionable intelligence for all markets.
ATR in Algorithmic and AI-Powered Trading Systems
The integration of the atr range indicator into algorithmic and AI-driven trading has become a game changer. Modern trading bots use ATR to dynamically adjust stop-losses and position sizes in real time, responding instantly to shifts in volatility.
AI-powered systems analyze historical ATR data to generate predictive signals and filter out market noise. For instance, an ATR-based bot might increase stop distances during news-driven volatility, reducing the chance of premature stop-outs.
Backtesting is vital. By testing ATR-driven strategies on historical data, traders can validate their edge and optimize parameters. The result is a more robust approach that enhances consistency and risk control.
As automation accelerates, the atr range indicator remains central to building adaptive, resilient trading systems that thrive in unpredictable markets.
Integrating ATR with TradingView and Leading Platforms
Deploying the atr range indicator on platforms like TradingView and MetaTrader is straightforward yet powerful. Here is a quick setup guide:
- Open your preferred chart and add the ATR indicator from the platform’s library.
- Adjust the period setting (default is 14, but customization is encouraged).
- Use custom scripts to create ATR-based alerts, such as notifications when ATR exceeds a set threshold.
- Visualize ATR trends with overlays or color-coded bands for immediate clarity.
Many platforms allow traders to personalize ATR visuals, including color schemes and line thickness, which aids in rapid decision-making. Automated alerts can be configured to notify you of volatility spikes or contractions, ensuring you never miss a key signal.
| Platform | ATR Setup Steps | Customization Options |
|---|---|---|
| TradingView | Add indicator, adjust period, set alerts | Color, line style, scripts |
| MetaTrader | Attach ATR, modify settings | Templates, expert advisors |
| NinjaTrader | Insert ATR, choose timeframe | Automated strategies |
Integrating the atr range indicator with these tools streamlines your workflow and keeps volatility insights front and center.
How AI-Powered Tools Like PipTrend Enhance ATR-Based Trading
AI-powered tools such as PipTrend are redefining how traders use the atr range indicator. PipTrend’s algorithms interpret ATR signals in real time, delivering actionable buy and sell alerts across forex, crypto, stocks, and indices.
By automatically detecting trends and volatility shifts, PipTrend removes much of the guesswork from ATR interpretation. Its multi-timeframe analysis ensures you act in harmony with both short and long-term volatility. Instant alerts mean you do not need to monitor charts constantly, freeing up your time without sacrificing opportunity.
The beginner-friendly interface makes advanced ATR strategies accessible, while an active trading community and ongoing updates keep your approach aligned with evolving market dynamics.
ATR Range Indicator in Different Markets: Forex, Crypto, Stocks, and Indices
The atr range indicator is a remarkably adaptive tool, providing traders with volatility insights across diverse asset classes. Its flexibility allows for effective risk management, tailored strategies, and improved decision-making whether you trade forex, crypto, stocks, or commodities. Understanding how the atr range indicator functions in each market type is essential for extracting its full value.
ATR in Forex Trading
The atr range indicator is a staple for forex traders, prized for its ability to measure pip volatility and adapt stop-loss levels to ever-changing currency conditions. In the forex market, where news events like Nonfarm Payroll (NFP) releases can trigger sharp price swings, the atr range indicator helps traders anticipate and respond to volatility.
For example, during an NFP announcement, the EUR/USD pair may experience a sudden ATR spike, signaling increased risk and opportunity. Scalpers often use a shorter ATR period to quickly adjust stops, while swing traders may prefer a longer setting to filter out noise.
A key insight is that ATR-based strategies help manage risk in high-leverage forex environments, where improper stop placement can quickly erode capital. For further context on how ATR fits within broader technical toolkits, see Technical Indicators in Trading.
ATR in Cryptocurrency Markets
Cryptocurrency markets are known for their extreme and unpredictable volatility. Here, the atr range indicator becomes even more valuable, offering structure amid chaos. When Bitcoin faces regulatory news or sudden market crashes, ATR values can surge, alerting traders to heightened risk.
Position sizing using the atr range indicator is crucial in crypto since price swings can be abrupt and substantial. For instance, a trader might reduce their position size when ATR readings spike to avoid outsized losses. However, it is important not to overreact to every short-term ATR surge, as crypto markets can revert quickly.
The atr range indicator provides a disciplined framework for navigating crypto’s wild price action, helping traders avoid emotional decisions and adapt to market shocks.
ATR in Stock and Index Trading
In equities and indices, the atr range indicator serves as a filter for identifying stocks with strong breakout potential or for avoiding low-volatility periods. For instance, during earnings season, the S&P 500’s ATR often increases, signaling a window for momentum trades.
Traders can use ATR to select stocks that are moving, sidestepping those stuck in consolidation. For indices, the atr range indicator offers a snapshot of overall market volatility and sector rotation. Studies have shown that ATR-based dynamic stops outperform static stop-loss systems, especially in fast-moving equity markets.
Stocks with persistently low ATR values may indicate a lack of interest or an upcoming breakout. Applying the atr range indicator here ensures that trading strategies remain responsive to evolving market conditions. For a comprehensive overview of ATR’s calculation and applications, consider the Average True Range Indicator Overview.
Adapting ATR to Commodities and Other Asset Classes
The atr range indicator is equally effective in commodities like gold, oil, and agricultural futures. Volatility in these markets can be driven by seasonal patterns, geopolitical events, or supply shocks. For example, oil’s ATR often surges during OPEC meetings, signaling traders to adjust their risk parameters.
Customization is key. Thinly traded or highly leveraged assets may require tailored ATR periods for accurate signals. One common mistake is relying on default ATR settings without considering asset-specific volatility characteristics.
By adjusting the atr range indicator to each commodity’s unique profile, traders can better anticipate periods of turbulence and capitalize on price expansions. The indicator’s adaptability cements its role as a universal volatility gauge across asset classes.
The Future of ATR: Trends, Enhancements, and Pro Tips for 2026
As we look toward 2026, the atr range indicator is positioned at the heart of evolving market dynamics. Volatility is no longer a seasonal visitor; it is a constant companion, shaped by algorithmic trading, geopolitical shifts, and rapid-fire news cycles. Traders who adapt their strategies to these shifts will find the atr range indicator remains invaluable for navigating uncertainty.
Evolving Market Volatility and ATR’s Role
Market volatility in 2026 is more unpredictable than ever. The atr range indicator helps traders decode this uncertainty by acting as a universal “volatility language” across asset classes. As algorithmic trading increases and new asset types like tokenized securities emerge, ATR’s ability to quantify turbulence remains essential.
For example, during a sudden geopolitical event, the atr range indicator can quickly highlight abnormal volatility spikes, allowing traders to adapt before the crowd reacts. This tool is especially valuable given the speed at which news impacts prices today. If you want a deeper dive into how ATR functions in volatile markets, consider reviewing the ATR in Volatile Markets resource for further context.
As traders expand into new markets, ATR continues to adapt, providing clarity amid chaos. Its relevance only grows as the pace of change accelerates.
ATR Enhancements: Smarter Indicators and Hybrid Approaches
The next generation of the atr range indicator is all about intelligence and adaptability. Hybrid indicators are gaining traction, combining ATR with volume, volatility bands, and even adaptive algorithms. These enhancements help filter out noise and respond to regime shifts more effectively.
A quick comparison of modern ATR enhancements:
| Enhancement | Description | Benefit |
|---|---|---|
| ATR Bands | Visualizes volatility envelopes | Easier breakout detection |
| ATR + Volume | Adds confirmation to signals | Reduces false alarms |
| Adaptive ATR | Machine learning auto-tunes period | Stays in sync with market mood |
Machine learning now helps auto-tune ATR periods, adjusting sensitivity based on market conditions. This reduces the risk of relying on outdated settings and helps traders stay agile. For a broader understanding of how these innovations fit within the trading toolbox, you can explore Trading Indicator Insights.
These smarter tools make the atr range indicator a more robust ally for both manual and automated strategies.
Pro Tips for Mastering ATR in 2026
Mastering the atr range indicator requires both discipline and flexibility. Here are actionable tips for traders aiming to stay ahead:
- Regularly recalibrate ATR settings to reflect current volatility.
- Integrate ATR with news and event calendars for richer context.
- Backtest ATR-based strategies across different years and asset classes to ensure reliability.
- Use the atr range indicator as a gauge of market “mood,” not just a number.
- Keep your approach simple; often, straightforward strategies outperform overly complex ones.
By internalizing these habits, traders can leverage the atr range indicator for more consistent and confident decision-making.
Common Mistakes and How to Avoid Them
Despite its power, the atr range indicator can be misused. Avoid these common pitfalls:
- Relying solely on the atr range indicator without considering trend, volume, or news.
- Applying static ATR settings universally, ignoring asset or market-specific volatility.
- Missing major breakouts by overlooking ATR contractions.
- Overreacting to sudden ATR spikes without price confirmation.
- Treating the atr range indicator as a stand-alone solution instead of part of a comprehensive strategy.
Awareness of these mistakes ensures the atr range indicator remains a powerful, context-aware tool in your trading arsenal.
As you’ve seen, mastering ATR isn’t just about understanding volatility—it’s about acting on timely, reliable signals that can transform your trading results in 2026 and beyond. With PipTrend’s AI-powered tools, you no longer have to second-guess your entries or exits. You get real-time, clear alerts across forex, crypto, stocks, and indices, all backed by robust multi-timeframe analysis. If you’re ready to put the ATR strategies from this article into action and finally trade with true confidence, Start Catching Winning Trades, Right Now!