Average daily range indicator: how ADR works and how to use it
On this page
What the average daily range indicator actually shows
Most traders who lose money on a “good” setup lose it because their target was never realistic in the first place. Price moved in the right direction, then stalled 20 pips short because the market had already done its work for the day.
The average daily range indicator exists to flag that problem before you commit capital.
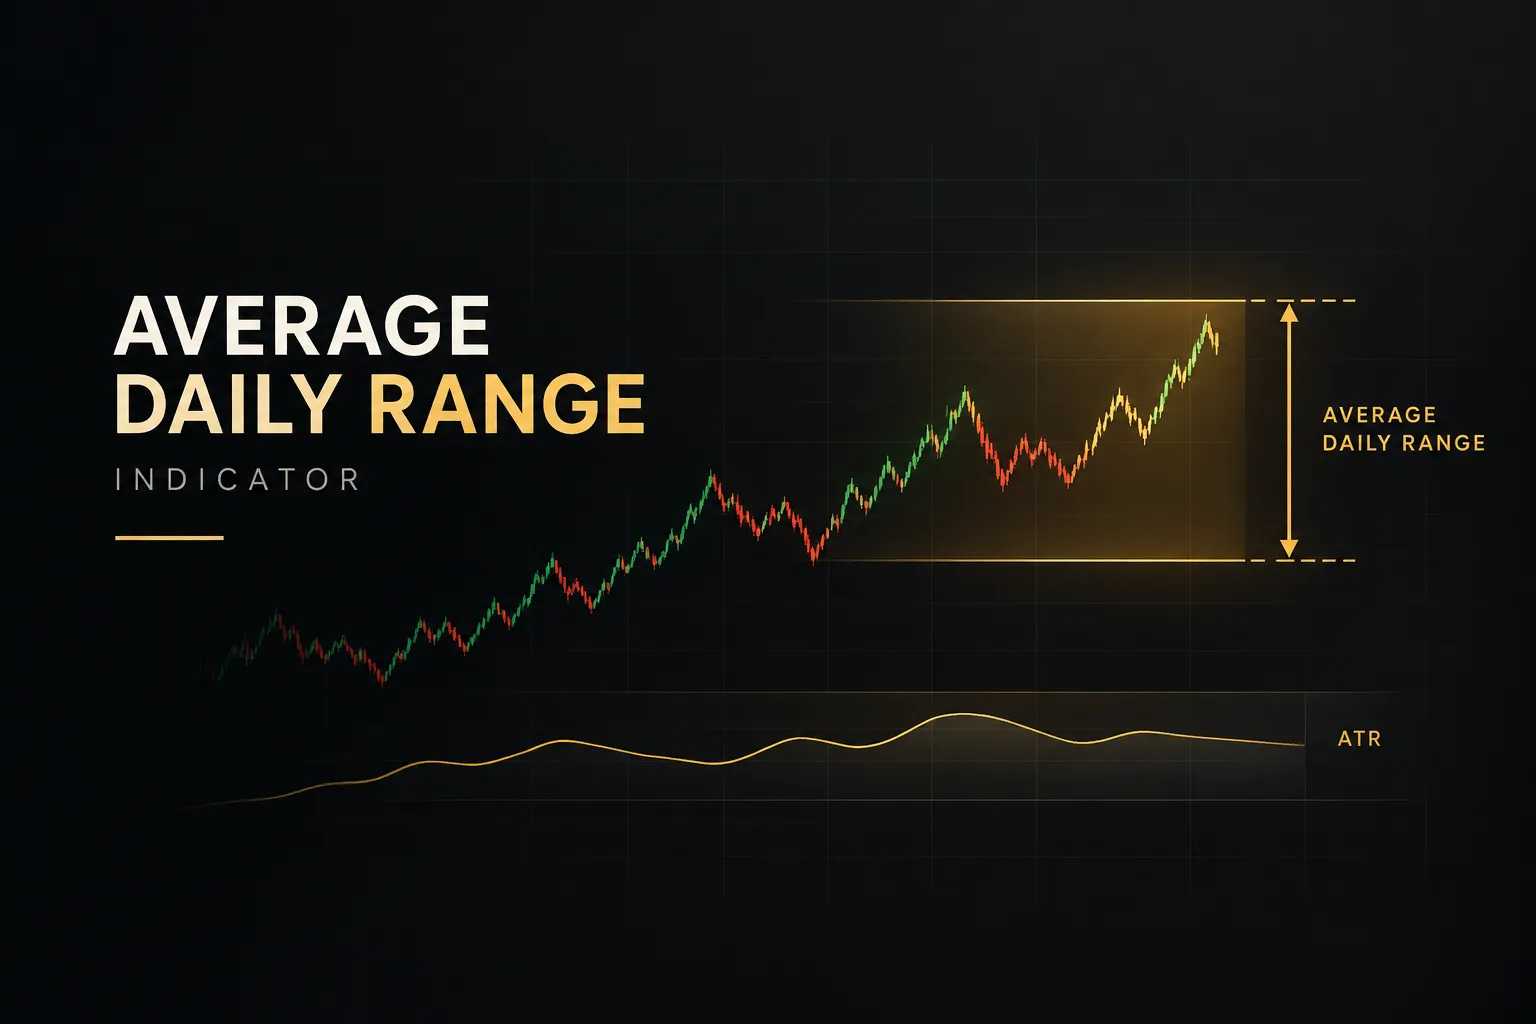
Average daily range (ADR) is the historical average of a security’s daily high-minus-low range over a chosen lookback period. It is expressed in pips for forex, points for indices and futures, dollars for stocks, or as a percentage of price.
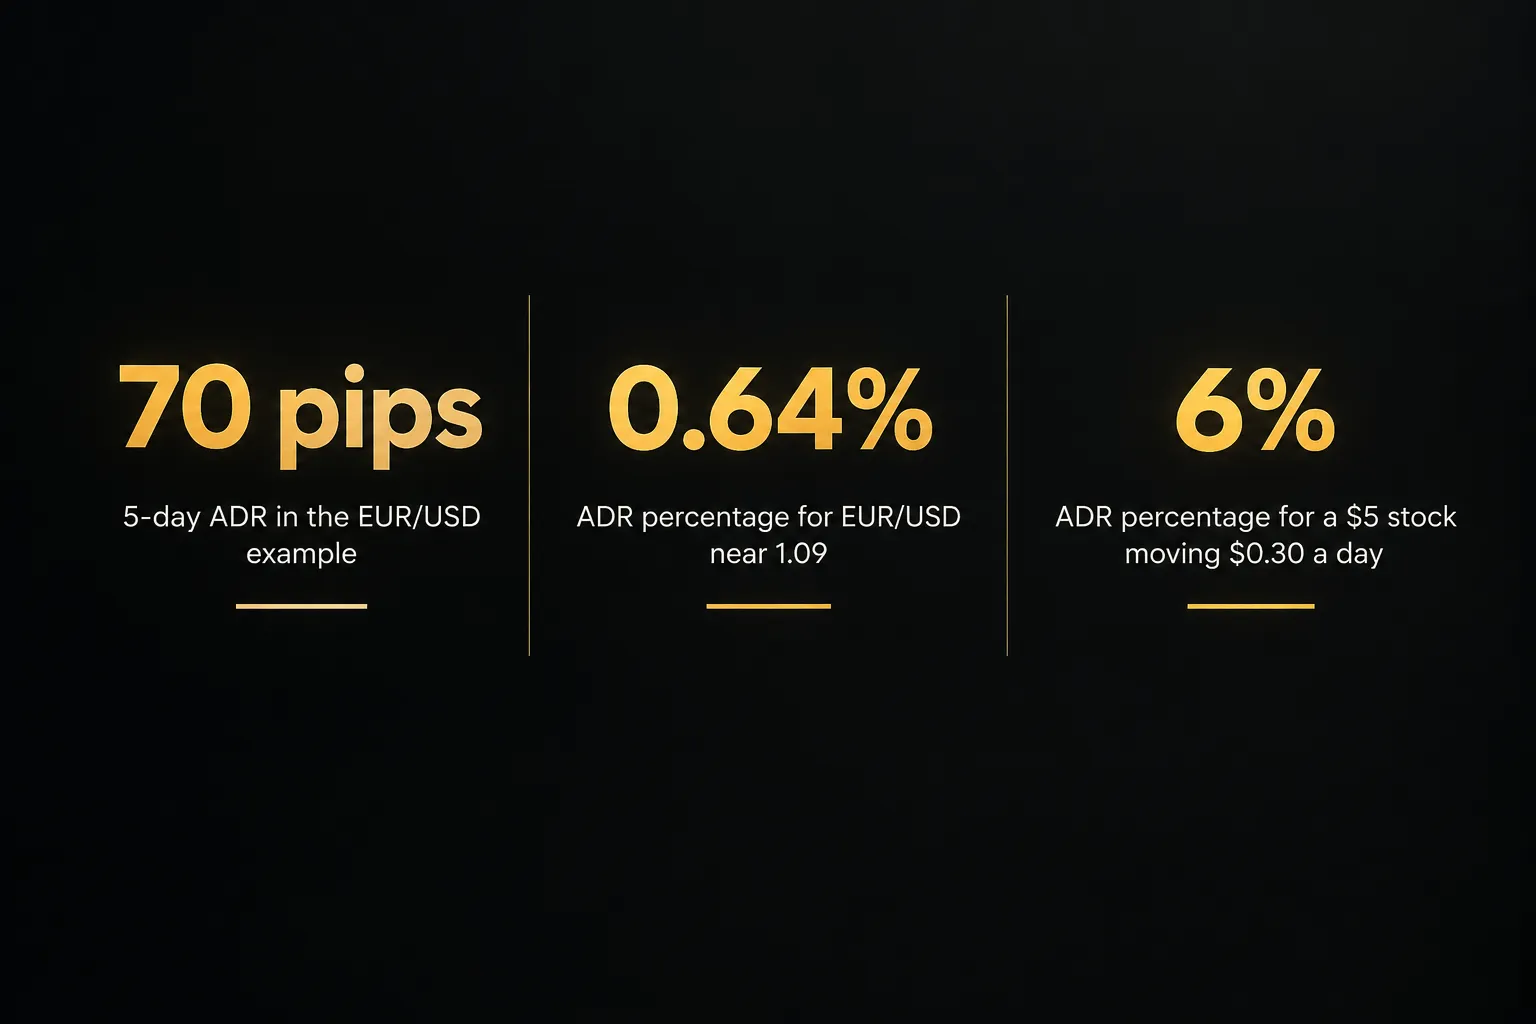
If EUR/USD has an ADR of 70 pips, the pair has typically traveled about 70 pips from its daily low to its daily high over recent sessions.
That is all it tells you.
ADR measures the magnitude of typical intraday price movement. It says nothing about direction, trend strength, or the odds of a reversal.
ADR answers one question well: how much room does price usually have today? It does not answer where price is going.
This guide also corrects three mistakes that show up constantly in trading forums and course material:
- Confusing ADR with average true range (ATR), which treats price gaps very differently.
- Treating 100% of ADR as a hard ceiling that price cannot break.
- Using ADR alone as a buy or sell signal.
Forex traders use ADR to set session expectations and size targets. Stock and futures traders use it to judge whether a breakout has fuel left. Crypto traders, dealing with some of the widest daily high-low ranges in any market, use it to keep stop-loss distance in proportion to market volatility.
As of 2026, it ships as a default or free indicator on nearly every major charting platform.
How ADR is calculated
The math behind ADR is simple enough to do on a napkin. That simplicity is a strength, because you can verify any platform’s number by hand in under two minutes.
The ADR formula step by step
The ADR formula is: ADR = (sum of each day’s high minus low) ÷ n, where n is the number of days in your lookback period. Here is a 5-day EUR/USD example worked through in full.
| Day | High | Low | Range (pips) |
|---|---|---|---|
| Day 1 | 1.0920 | 1.0850 | 70 |
| Day 2 | 1.0905 | 1.0830 | 75 |
| Day 3 | 1.0880 | 1.0820 | 60 |
| Day 4 | 1.0950 | 1.0860 | 90 |
| Day 5 | 1.0940 | 1.0885 | 55 |
- Record each day’s high and low. Pull the daily candle data for the number of days you want to average, making sure every candle uses the same session cutoff.
- Subtract the low from the high for each day. This gives you the daily range: 70, 75, 60, 90, and 55 pips in the table above.
- Add the ranges together. 70 + 75 + 60 + 90 + 55 = 350 pips.
- Divide by the number of days. 350 ÷ 5 = 70 pips. That is your 5-day ADR.
- Check it with the alternative method. Average the five highs (1.0919) and the five lows (1.0849) separately, then subtract: 1.0919 − 1.0849 = 0.0070, or 70 pips. Same answer.
Why does step 5 work? Because subtraction distributes over addition. The sum of (high − low) equals the sum of highs minus the sum of lows, so dividing either version by n gives an identical result.
Some indicator scripts calculate ADR this way, and now you know it’s not a different formula.
Picking a lookback period: 5, 10, 14, or 20 days
The lookback period controls the trade-off between responsiveness and stability. There is no universally correct number, only one that fits your instrument and holding time.
- Start with 14 days as a baseline. It roughly covers three trading weeks, which smooths out a single wild session without lagging months behind the current market.
- Shorten to 5 or 10 days if volatility shifts fast. Short periods react quickly to volatility expansion after a central bank decision or earnings report, but one outlier day can swing the average by 15-20%.
- Lengthen to 20 days for steadier instruments. A 20-day ADR (about one trading month) filters noise well but can take a week or more to reflect a new volatility regime, whether that’s expansion or volatility contraction.
- Match the period to the instrument’s behavior. Lower-priced stocks, small caps, and many crypto assets change character quickly, so a shorter lookback often describes “today’s” market more accurately.
- Compare two periods side by side. If your 5-day ADR is far above your 20-day ADR, the market is in an expansion phase. If it sits well below, conditions are compressing, which often precedes a larger move.
Pips, points, dollars, and ADR percentage
An ADR of 70 means nothing until you know the unit and the price. Seventy pips on EUR/USD and 70 cents on a stock are completely different animals.
- Use absolute units for single-instrument planning. Pips and points work for forex and index futures, and dollars work for stocks. These are the units your stop-loss distance and take-profit target are actually measured in.
- Convert to ADR percentage for comparisons. Divide ADR by the current price and multiply by 100. For EUR/USD at 1.0900 with a 70-pip ADR, that’s 0.0070 ÷ 1.0900 = roughly 0.64%.
- Compare instruments on the same scale. A $5 stock with a $0.30 ADR has an ADR percentage of 6%. Relative to its price, it moves almost ten times more per day than EUR/USD, even though “$0.30” sounds tiny.
- Use percentage for watchlist screening. Sorting a watchlist by ADR percentage instantly separates the slow movers from the instruments that can hit a target in one session.
Reading ADR on your chart
Two traders can look at the same ADR value and reach opposite conclusions about how much room is left. The difference comes down to where the projection starts and what each platform counts as a “day.”
Projecting ADR bands from the open
ADR bands are horizontal lines that project the average range onto today’s chart. Where you anchor them changes the story they tell.
- From the daily open: Many indicators plot the daily open plus and minus ADR (or plus and minus half the ADR for a symmetrical envelope). This shows the typical extremes if price trends in one direction from the start of the day, but it ignores everything that has happened since.
- From the session open: Forex traders often anchor to the London or New York open instead of the midnight server open. This better reflects the hours when most volume arrives, since much of the daily range in major pairs forms during the London and New York sessions.
- From the current high and low (dynamic bands): The upper projection becomes today’s low plus ADR, and the lower projection becomes today’s high minus ADR. As the day’s range grows, the bands tighten, giving the most honest picture of remaining room.
- From current price: Some traders simply add and subtract remaining range from the live price. It’s intuitive but can overstate room if price is already sitting near the day’s extreme.
Dynamic bands are usually the most practical for intraday decisions. Bands fixed at the daily open look clean, but by mid-session they can suggest 60 pips of room that no longer exists.
Calculating range used and remaining range
Two quick numbers turn ADR from a static reading into a live decision tool. Both take seconds to calculate.
- Range consumed (%) = (today’s high − today’s low) ÷ ADR × 100. This tells you what share of a typical day’s movement has already happened.
- Remaining daily range = ADR − (today’s high − today’s low). This is the approximate distance price might still travel if today behaves like an average day.
- Worked example: GBP/USD has an 80-pip ADR. By 10:00 London time, the day’s high is 1.2700 and the low is 1.2645, a 55-pip range. Range consumed = 55 ÷ 80 = 68.75%, and remaining range = 80 − 55 = 25 pips.
- What that means for a trade: A 40-pip long target from 1.2690 needs price to reach 1.2730, which would push today’s range to 85 pips (106% of ADR). Possible, but you’d be betting on an above-average day.
- Where the remaining range applies: The 25 pips can come from either direction. Price could extend to 1.2725 above or 1.2620 below, which is exactly why ADR needs a separate directional read.
Why two platforms show different ADR values
Open the same pair on two brokers and you may see ADR values that differ by 5-10 pips.
Neither is necessarily wrong.
They’re measuring slightly different “days.”
- Broker server time and session cutoff: A broker on New York close (5 p.m. ET) builds daily candles differently from one on GMT midnight. The GMT version can create a small extra candle and split Asian-session moves across two days, changing every range in the average.
- Weekend and extended-hours candles: Platforms that print a short Sunday candle in forex add a low-range day that drags ADR down. For stocks, including pre-market and after-hours data widens daily ranges compared with regular-session-only data.
- Data-feed differences: Forex is decentralized, with the BIS 2022 Triennial Survey estimating daily turnover at roughly $7.5 trillion spread across many liquidity providers. Each broker’s feed prints slightly different highs and lows, especially during fast markets.
- Gap handling: Most ADR scripts use only each candle’s own high and low, ignoring any price gap from the prior close. Some custom versions fold gaps in, which effectively turns them into a variant of true range.
- Lookback and smoothing choices: A 14-day simple average and a 14-day exponential average will diverge, particularly after one unusually large day.
The fix is consistency.
Pick one platform, confirm its session cutoff, and base your planning on that data every day.
Using ADR for targets, stops, and trade filtering
Here is where ADR earns its place on a chart.
Not as a signal generator, but as a reality check that filters out trades with poor odds before they cost you anything.
Setting realistic take-profit and stop levels
The cleanest use of ADR is sanity-checking a take-profit target. If the remaining daily range is 25 pips and your target is 60 pips away, you are asking the market to deliver a day roughly 40% larger than average.
That can happen.
It just shouldn’t be your base case.
A simple rule works well: keep intraday targets within the remaining range, or accept that the trade may need to be held overnight. This also protects your risk-reward ratio.
A 1:3 setup on paper is really closer to 1:1 if the 3R target sits beyond where price typically stops for the day.
Stops are a different story.
It’s tempting to set a stop at, say, 50% of ADR and call it volatility-adjusted.
But a stop based on distance alone ignores four things that actually decide whether it survives.
- Spread: A 3-pip spread on an exotic pair eats a meaningful chunk of a 20-pip stop.
- Slippage: During economic news volatility, fills can land several pips past your level.
- Market structure: A stop placed just inside a swing low or a clear support and resistance zone tends to get hit by routine noise.
- Position sizing: The stop distance should set your position size, not the other way around.
The better approach is to place your stop at the invalidation level, the price where your trade idea is objectively wrong. Then use ADR to check whether that stop distance is reasonable.
If invalidation sits 90 pips away on a pair with a 70-pip ADR, the setup is probably too wide for an intraday trade, and you’d need a much smaller position to keep risk fixed.
Stops belong at invalidation. ADR tells you whether that invalidation level is a sensible distance for the time frame you’re trading.
ADR versus ATR: the real difference
ADR and average true range (ATR) look almost identical on a calm market.
Then a weekend gap or a surprise rate decision hits, and they split apart.
ATR, introduced by J. Welles Wilder in his 1978 book New Concepts in Technical Trading Systems, is built on true range. True range is the greatest of three values: today’s high minus today’s low, today’s high minus yesterday’s close, or yesterday’s close minus today’s low.
That means a price gap through the previous close counts as part of the day’s movement.
Standard ADR uses only the current day’s high and low. If a stock closes at $50 and opens at $54 after earnings, then trades between $53 and $55, ADR records a $2 range.
ATR records $5, because the true range reaches back to the $50 close.
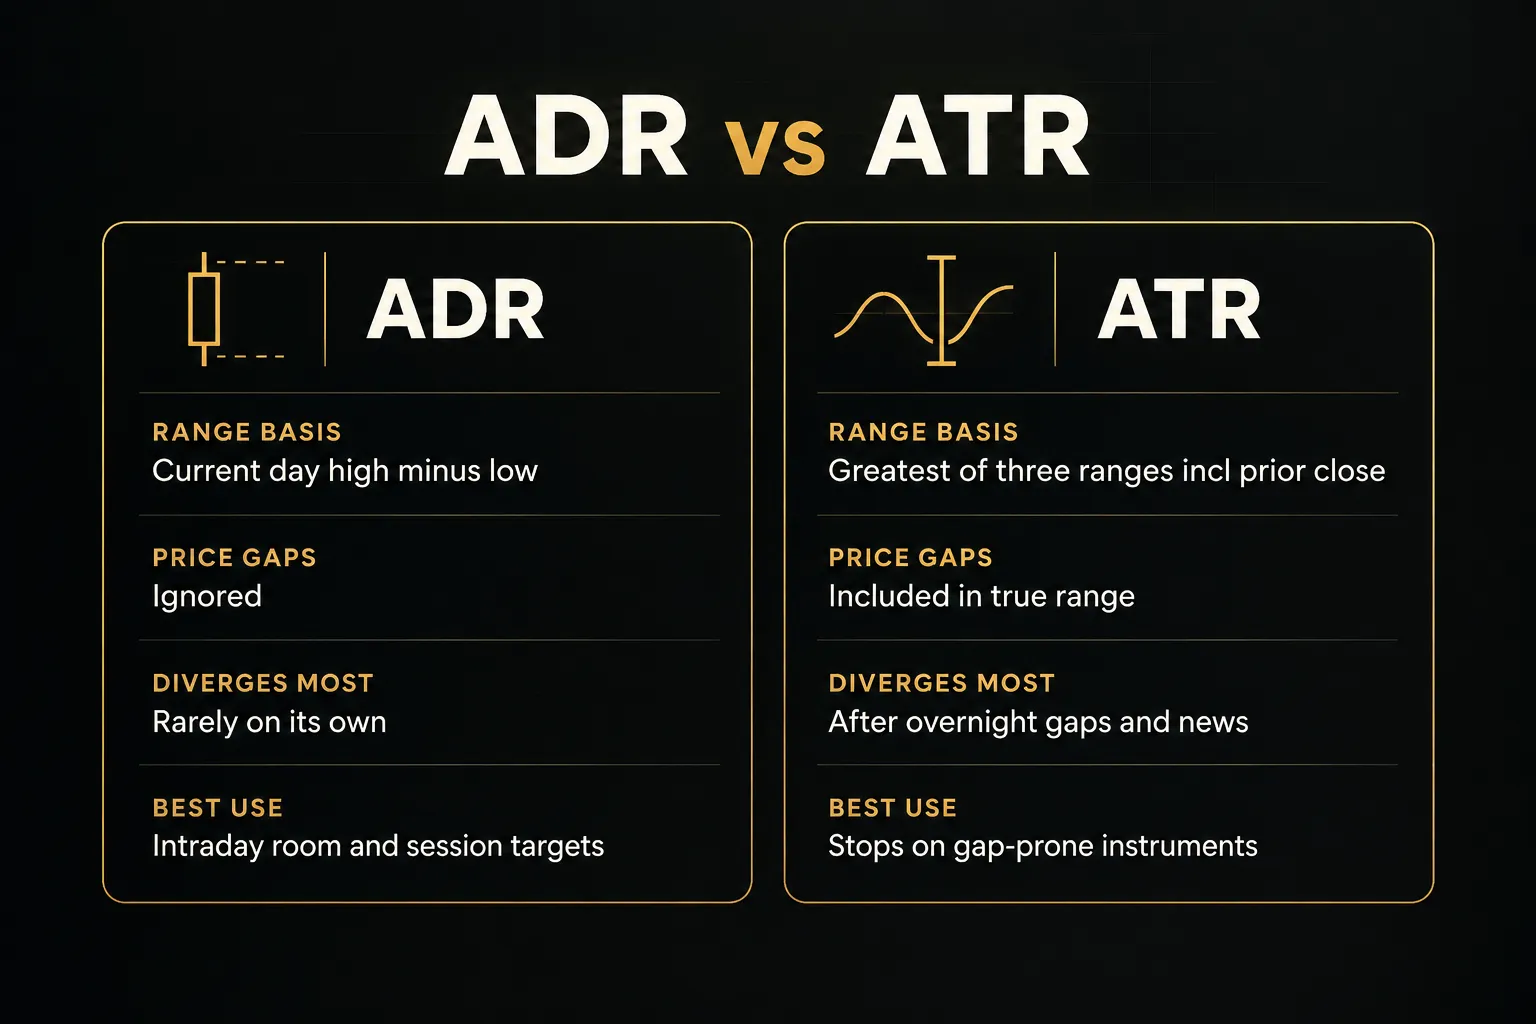
In practice, the two diverge most around overnight gaps, weekend opens, and economic news events. For 24-hour forex majors, the gap difference is usually small.
For individual stocks and index futures, it can be large.
One more correction.
Neither indicator caps price.
ADR regularly exceeds 100% during breakouts, central bank days, and major data releases like U.S. non-farm payrolls, where a single session can print 150% to 200% of normal range.
ADR is a guide to typical behavior, not a ceiling.
Pairing ADR with a directional signal like PipTrend
So if ADR can’t tell you direction, what does? You need a separate framework, and the two tools should answer different questions without overlapping.
A practical workflow looks like this.
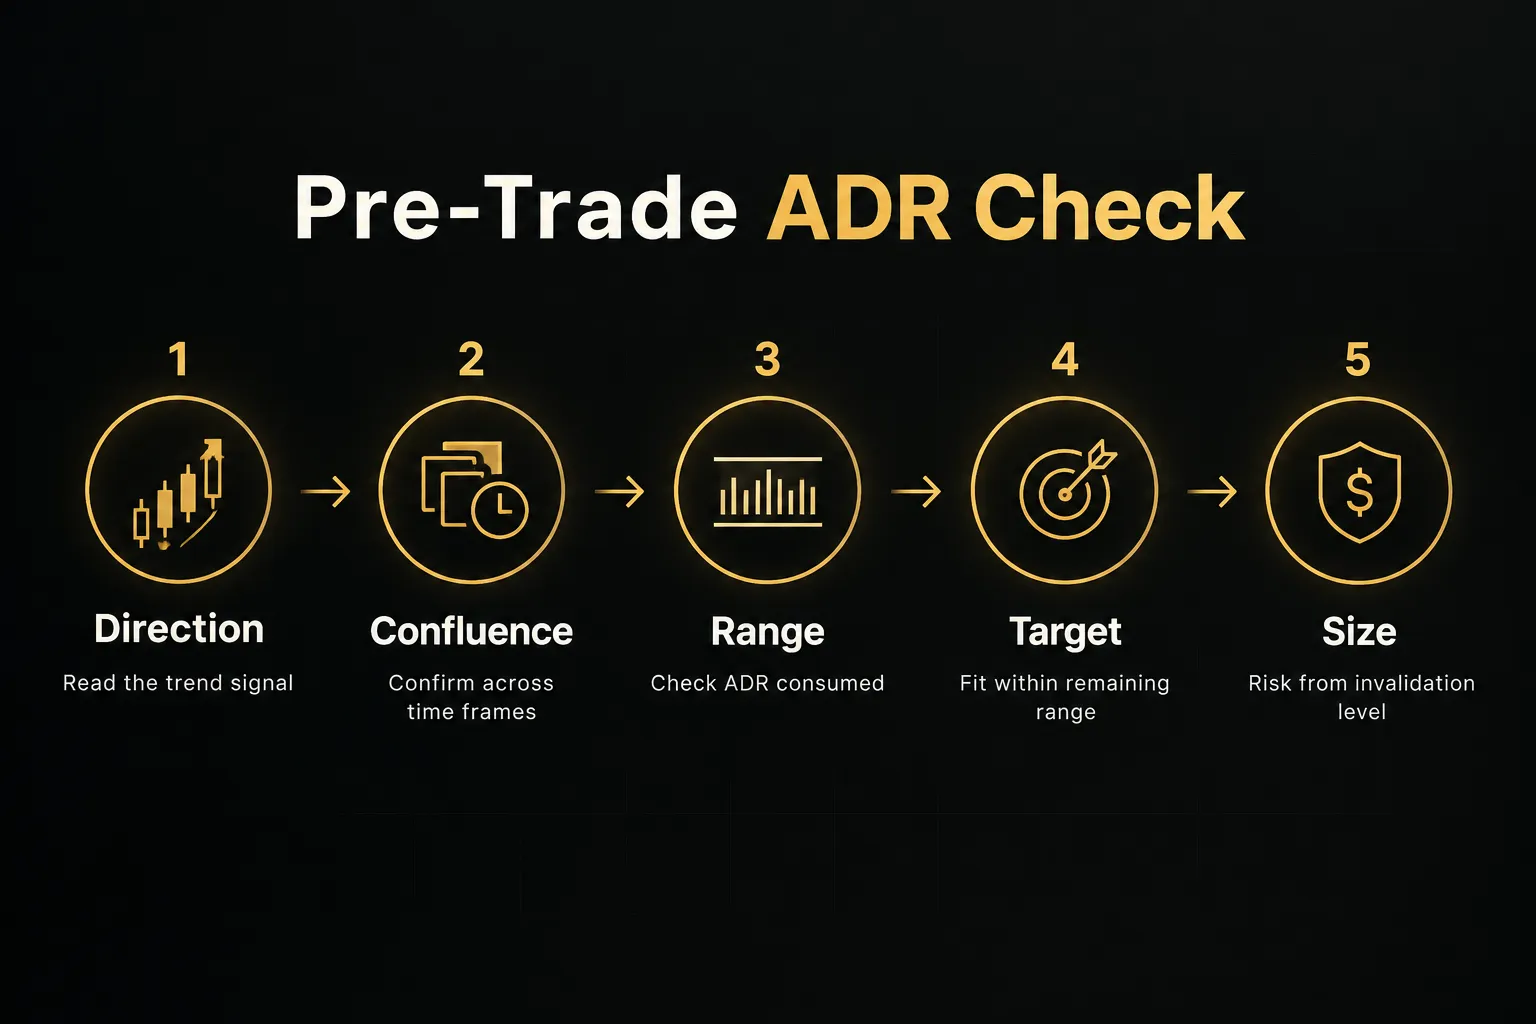
PipTrend’s color-coded trend signal gives you directional bias at a glance, and its multi-timeframe table shows whether the higher and lower time frames agree. That combination supplies trend confirmation and confluence around the entry level, the “which way and where” of the trade.
ADR then supplies the “how far.”
Before committing size, you check range consumed and remaining range. If PipTrend shows aligned bullish signals across time frames but 90% of today’s ADR is already used, the setup may be valid for tomorrow rather than right now.
Think of it like planning a road trip.
The trend signal is your map, and multi-timeframe analysis confirms you’re on the right highway.
ADR is the fuel gauge, telling you whether there’s enough left to reach the destination today… or whether you should stop and refuel first.
Used this way, ADR becomes a volatility filter rather than a standalone trigger.
It never tells you to buy.
It tells you when a buy signal has room to pay off.
Frequently asked questions
What is the best setting for the average daily range indicator?
A 14-day lookback is the most common default for the average daily range indicator. It balances responsiveness with stability for most forex pairs and liquid stocks.
Shorter periods (5-10 days) suit fast-changing or lower-priced instruments, while 20 days works better for steady markets and longer holding periods.
How do you use the ADR indicator in forex?
Forex traders use ADR mainly to judge how much room a pair has left in the current session. Check the range consumed against ADR before entering, and keep intraday targets within the remaining daily range.
Anchoring projections to the London or New York open often gives a more relevant read than the midnight server open.
What is the difference between ADR and ATR?
ATR includes price gaps through the previous close, while standard ADR uses only the current day’s high and low. ATR is built on true range, which takes the largest of three measurements including yesterday’s close.
The two values diverge most after overnight gaps, weekend opens, and major news releases.
How accurate is the average daily range indicator?
ADR is an accurate description of past movement but not a prediction of today’s range. Price often exceeds 100% of ADR during breakouts, central bank decisions, and data releases, and quiet days can finish well below it.
Treat ADR as a guide to typical volatility, not a ceiling or a floor.
How do you calculate the remaining daily range?
Remaining daily range equals ADR minus the distance between today’s high and low so far. For example, with an 80-pip ADR and a 55-pip range already printed, the remaining range is 25 pips.
That remaining distance can extend in either direction, so pair it with a directional read.
Can ADR be used for stop loss and take profit?
ADR can inform stop-loss and take-profit levels, but it shouldn’t set them alone.
Targets should fit within the remaining range, while stops belong at a structural invalidation level adjusted for spread and slippage. Combine ADR with support and resistance, proper position sizing, and an independent directional signal for reliable trade planning.
The takeaway on trading with ADR
If you take one habit from this guide, make it this: before entering any trade, check how much of today’s ADR has already been used.
It takes ten seconds.
It will quietly remove some of your worst trades.
The decision rule is straightforward.
If most of the ADR is already consumed (say, 80% or more), scale down your target, tighten your expectations, or wait for the next session instead of chasing a move that has likely run its course. If little of the ADR is used, there may be genuine room for your planned move, provided your directional read supports it.
Keep the earlier corrections in mind as well. ADR is not ATR, so expect them to differ after gaps and news.
And 100% of ADR is not a wall.
Volatility expansion days blow straight through it, which is precisely why stops belong at invalidation levels rather than at arbitrary ADR multiples.
Most of all, remember what the tool is for.
ADR measures room to move.
It does not tell you where price will go.
That’s why it works best inside a complete framework: a directional signal for bias, multi-timeframe confluence for entries, structure for stops, and ADR as the final filter that asks whether today’s market can realistically deliver your target.
Use it that way, and the average daily range indicator stops being just another line on the chart.
It becomes the check that keeps your expectations honest.
Risk Disclaimer: Trading involves risk. Past performance doesn't guarantee future results. Only trade with money you can afford to lose. PipTrend is a tool to assist your trading decisions, not financial advice.