On this page
Why most swing setups fail
Most traders who lose money on swing trades never had a setup at all.
They had a picture.
A bull flag, a double bottom, or a moving average crossover looks convincing on a chart, but a shape on its own tells you almost nothing about whether to risk money on it.
A real swing trading setup has five parts: a market condition that favors the trade, an objective trigger that tells you when to enter, a stop placed at a logical level, a measurable target, and an invalidation point that proves the idea wrong.
Take away any one of those and you are guessing with extra steps.
The classic beginner mistake looks like this.
A trader spots a breakout pattern, buys the moment price pokes above resistance, and never checks whether the broader market is trending or chopping sideways.
No confirmation.
No regime check.
The breakout fails within two days, and the trader blames the pattern.
The pattern did not fail. The process did. A breakout in a ranging market is a different trade from a breakout in a trending one, even if the chart looks identical.
This guide gives you a setup-validation framework you can apply to any trade idea before you put capital behind it. You will learn how to grade a setup, where to place stops, how to size positions from risk, and why setups that look perfect still lose.
Indicators and tools help.
A multi-timeframe table like PipTrend’s can confirm that trends line up across timeframes.
But tools support a defined process.
They never replace one.
What makes a setup valid
Here is a fact that surprises many new traders: the same chart pattern can have a positive edge in one market and a negative edge in another.
A pullback to the 20-day moving average works beautifully in a steady uptrend and gets shredded in a sideways range.
Context decides the outcome far more than the shape does.
That is the core difference between a chart pattern and a complete setup.
A chart pattern is a visual shape.
A complete setup is that shape plus written rules for entry, stop, target, and exit.
Before any trade, run it through this six-point checklist:
- Regime fit: The setup matches the current market regime (trending, ranging, or high-volatility). A trend-following setup in a range fails by design.
- Defined trigger: You know exactly what price event gets you in, such as a daily close above a level or a break of the prior candle’s high. “It looks ready” is not a trigger.
- Structural stop location: Your stop sits beyond a swing high, swing low, or volatility buffer where the trade idea is clearly wrong.
- Measurable target: You have a price objective based on the next support or resistance level, a measured move, or an ATR multiple.
- Invalidation level: You know what would cancel the setup before entry, such as price closing back inside a range.
- Acceptable risk-reward: The distance to target is at least twice the distance to stop. Anything under 1.5:1 needs a very high win rate to survive.

Market regime comes first
Before you look at a single pattern, classify the market. You can do this with two simple tools: price structure and average true range (ATR).
- Trending regime: Price prints higher highs and higher lows (or lower highs and lower lows in a downtrend). Pullbacks and breakout-retests perform best here.
- Ranging regime: Swing highs and swing lows cluster around the same levels, and moving averages flatten out and tangle together. Mean-reversion trades near support and resistance work better than breakouts.
- High-volatility regime: The 14-period ATR sits well above its 50-day average (roughly 1.5x or more). Stops get hit more often, so size down or wait for volatility to settle.
- Transitional regime: Structure breaks but has not yet established a new trend. This is the most dangerous phase for swing traders, and sitting out is a legitimate position.
Structural stop placement
Arbitrary percentage stops are one of the quietest account killers.
A 5% stop means nothing to the market.
It ignores where buyers and sellers actually defended price.
- Swing-based stops: For a long trade, place the stop a small buffer below the most recent swing low. If price breaks that low, the market structure that justified the trade is gone.
- ATR-based stops: Place the stop 1.5x to 2x ATR away from entry. This adapts automatically to the instrument’s normal noise, so you avoid being shaken out by routine fluctuations.
- Combined approach: Use whichever is further, the swing level or the ATR buffer. Then let position size absorb the wider stop, not your risk budget.
Targets and invalidation rules
A target without logic is a wish.
Your exit plan should be just as specific as your entry.
- Level-based targets: Aim for the next significant resistance (for longs) or support (for shorts) on the daily chart, since that is where opposing orders tend to sit.
- Measured-move targets: For breakouts, project the height of the prior range from the breakout point.
- Invalidation rules: Write down the condition that cancels the trade before your stop is hit, such as a daily close back below the breakout level. Exiting on invalidation often saves a full 1R loss.
Core setups and when to use them
You do not need twenty setups.
Most consistent swing traders run two or three, and they know exactly where each one breaks down.
The table below compares five of the most widely used swing trading setups by the conditions they need and the way they typically fail.
| Setup | Required regime | Entry trigger | Stop location | Target logic | Typical failure mode |
|---|---|---|---|---|---|
| Pullback in a trend | Trending, normal ATR | Bullish reversal candle at 20/50 MA or prior resistance-turned-support | Below pullback swing low or 1.5x ATR | Prior swing high, then trail | Pullback deepens into a trend reversal |
| Initial breakout | Late-stage range or early trend | First daily close beyond resistance | Back inside the range, below breakout candle low | Measured move (range height) | False breakout that reverses within 1-3 bars |
| Confirmed breakout | Trending or expanding volatility | Close beyond level with volume 1.5x+ average and a follow-through bar | Below breakout level minus ATR buffer | Measured move or next major level | Late entry with poor risk-reward |
| Breakout-retest | Trending after a range break | Rejection candle at the broken level from the new side | Just beyond the retested level | Prior high, then measured move | Retest never comes, or level breaks back through |
| RSI/volume divergence | Extended trend near major support or resistance | Price makes new extreme while RSI does not, plus a structure break | Beyond the divergence extreme | Mean of the prior range or nearest moving average | Divergence persists as trend keeps running |
Pullbacks in a trend
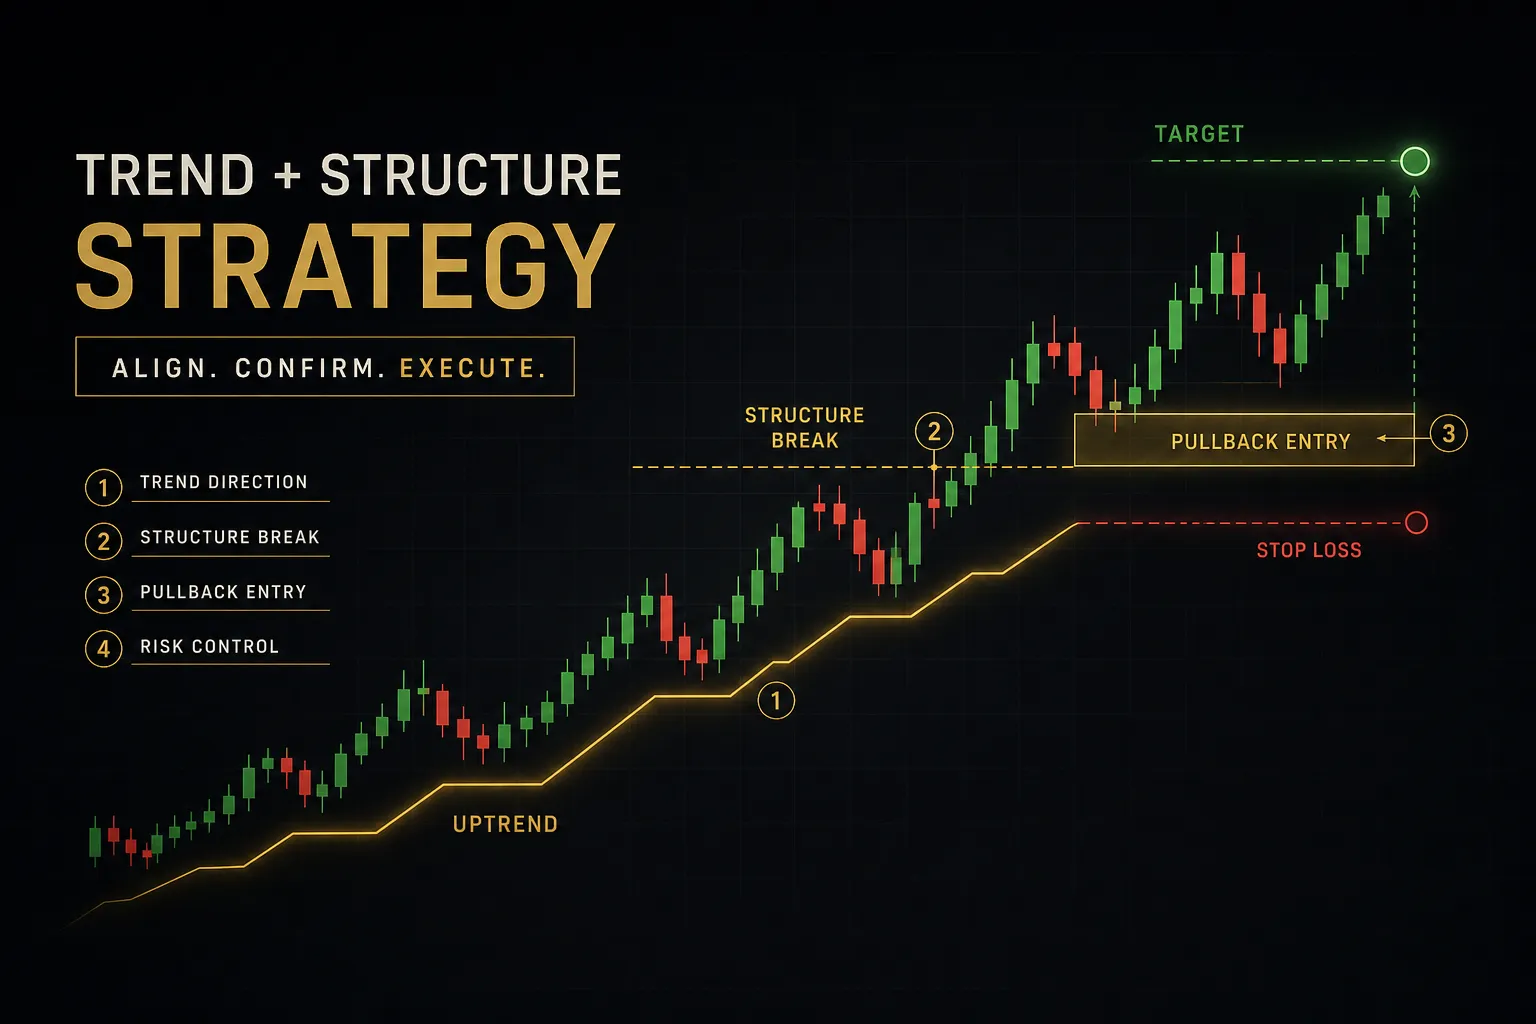
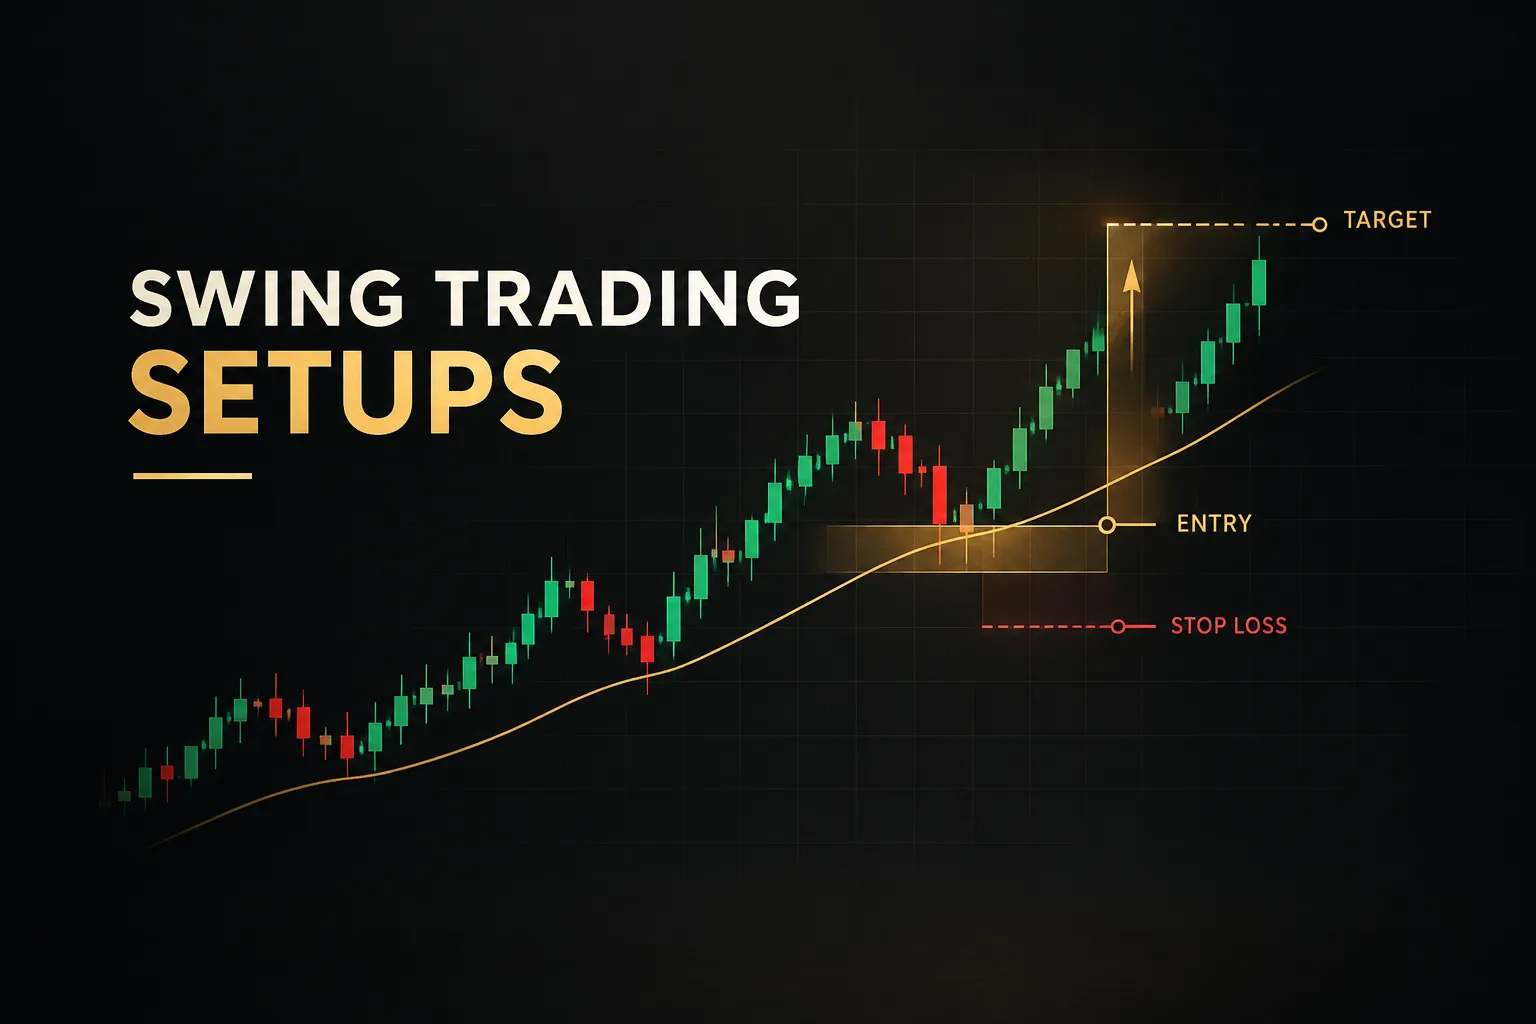
The pullback entry is the workhorse of swing trading. You wait for a confirmed trend, let price retrace toward a moving average or former resistance, and enter when buyers step back in.
The strongest pullbacks show moving average confluence, where the 20-day and 50-day averages sit close to a horizontal support level.
Shallow pullbacks of 38% to 50% of the prior leg tend to hold better than deep ones.
Once a pullback retraces more than 78%, you are no longer trading a pullback.
You are trading a potential reversal.
Breakouts and breakout-retests
Breakouts come in three distinct flavors, and mixing them up causes a lot of losses.
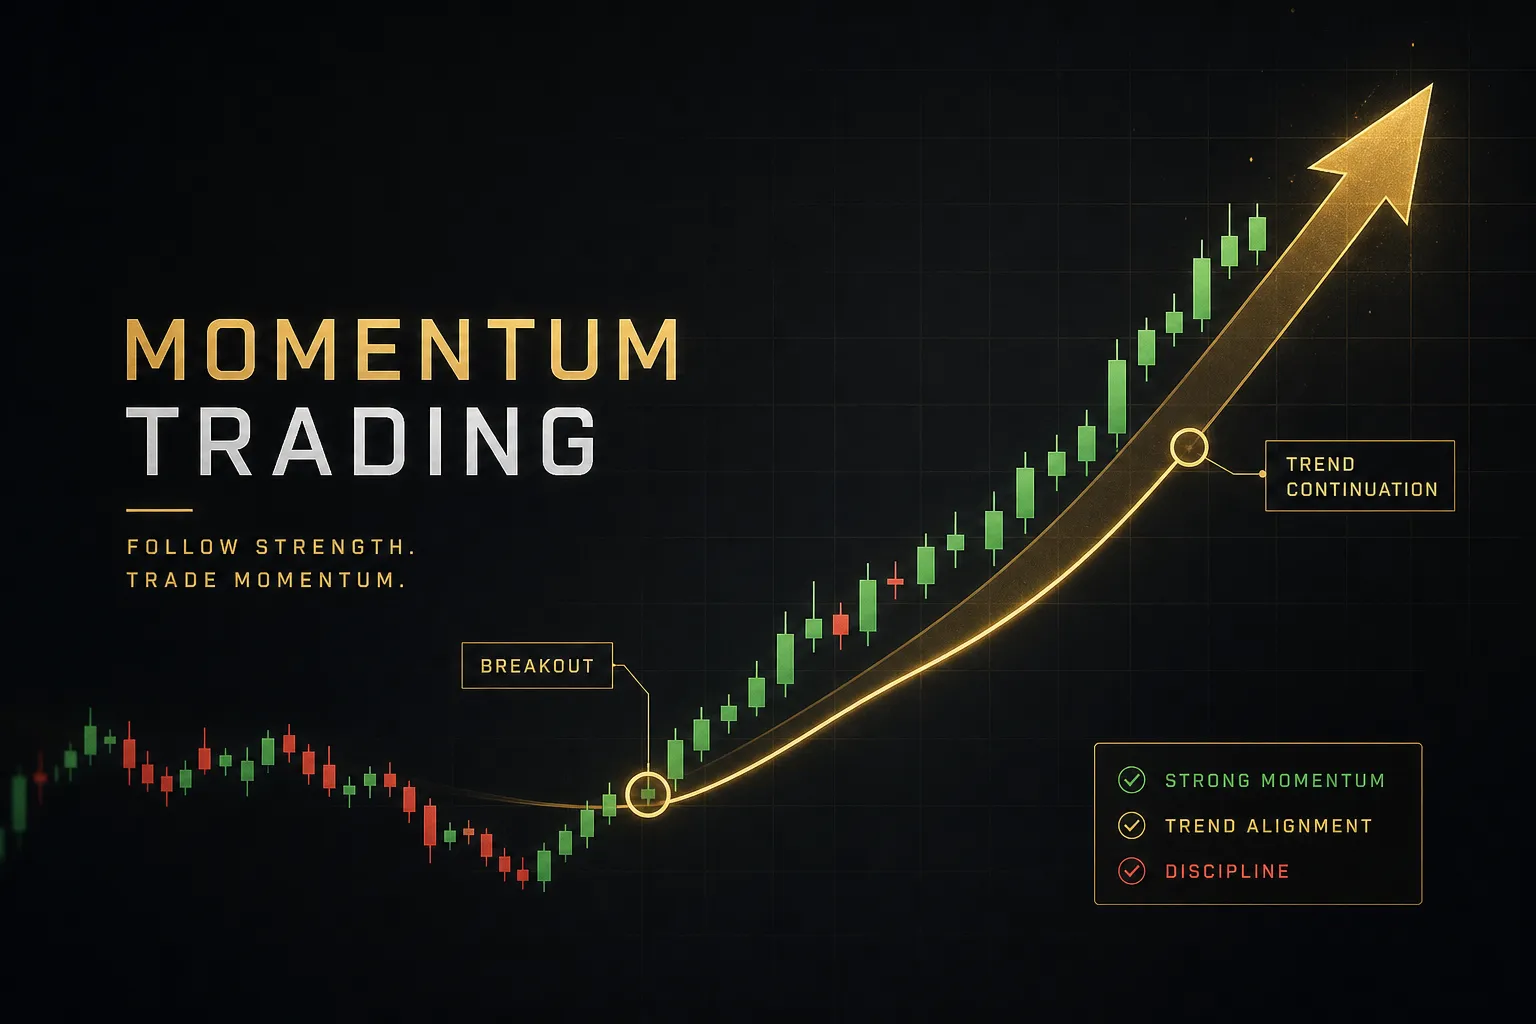
An initial breakout is simply the first close beyond resistance.
It offers the best price but the lowest certainty.
A confirmed breakout adds evidence: volume confirmation (often 1.5x the 20-day average or more) and a follow-through candle that holds above the level.
A breakout retest happens when price returns to test the broken level from the other side before continuing. Old resistance becomes new support, and you get a tighter stop with more confirmation.
But watch for the late-entry trap.
If 60% to 70% of the measured move has already happened by the time you enter, the remaining reward rarely justifies the risk.
One quick check: if the last two or three candles together cover more than twice the ATR, the expansion has likely already been spent.
Wait for a retest or skip it.
Aligning higher and lower timeframes
Good multi-timeframe analysis follows a strict hierarchy.
The higher timeframe (daily or H8) sets directional bias. The lower timeframe (H4 or H1) only times the entry.
Conflicts arise when traders let the lower timeframe override the higher one.
If the daily trend is up and the H4 shows a short-term downswing, that downswing is your pullback, not a reason to short.
Only take lower-timeframe signals that agree with the higher-timeframe direction, and you remove most of the contradictory noise.
Stops, sizing and confirmation
Ask ten losing traders why they blew up and few will say “bad entries.”
They will describe one oversized position that went wrong.
Stops and sizing are where survival is decided, and confirmation tools only matter once those two are locked in.
Placing a stop that makes sense
A sensible stop answers one question: at what price is my trade idea objectively wrong?
For a long pullback trade, that is usually just below the swing low that formed during the pullback. For a breakout-retest, it is just below the level that was retested.
Add a small buffer, typically 0.25x to 0.5x ATR, so routine noise and stop-hunting wicks do not take you out.
Then accept the distance the market gives you.
Tightening a stop to fit a bigger position is how traders turn a sound setup into a coin flip.
Sizing the position from risk
Position size should be the last number you calculate, not the first. It comes from three inputs: account size, risk percentage, and stop distance.
Here is a worked example.
You have a $10,000 account and risk 1% per trade, which is $100.
You want to buy a stock at $48 with a structural stop at $46, so your stop distance is $2 per share.
Divide the dollar risk by the stop distance: $100 ÷ $2 = 50 shares.
If the stop is hit, you lose $100 plus any slippage.
If your target sits at $53, the trade offers $5 of reward against $2 of risk, a 2.5:1 ratio.

Notice what this does.
A wider stop automatically produces a smaller position, so every trade risks the same amount regardless of volatility.
The same logic works for forex lots or crypto units.
Only the contract math changes.
Confirmation without indicator overload
More indicators feel safer.
They usually are not.
The problem is that most indicators measure the same thing in slightly different ways.
Redundant signals happen when two tools from the same family agree.
RSI and Stochastic both turning up is one momentum reading counted twice.
It creates false confidence without adding information.
Conflicting signals are the opposite problem.
A trend tool says up while an oscillator flashes overbought, and the trader freezes or picks whichever one matches their bias.
Five indicators on one chart almost guarantees at least one conflict on every trade.
One trend tool plus one momentum or volume tool covers nearly everything a swing trader needs. Beyond that, each extra indicator adds more noise than signal.
A multi-timeframe confluence table solves a different problem.
PipTrend’s 12-timeframe dashboard, for example, shows trend direction across timeframes in a single view.
If the daily, H8, and H4 all point the same way, your directional bias has backing before you look for an entry trigger.
That is confirmation, not prediction.
The dashboard tells you trends are aligned.
It does not tell you where price goes next, and it should not be used as a standalone buy or sell signal.
No indicator predicts outcomes.
Confirmation tools reduce uncertainty.
They do not remove risk.
This is exactly why PipTrend separates its signal from its entry: the signal tells you a directional condition exists, while the entry still waits for a price-level trigger.
That gap is deliberate, and it exists to stop impulsive entries on a color change.
Why valid-looking setups still fail
You can tick every box on the checklist and still lose.
That is not a flaw in the framework.
It is how probability works, and it is why the framework focuses on managing losses rather than avoiding them.
Gaps, earnings and weekend risk
Stops protect you during market hours.
They do very little when price jumps over them.
An overnight gap can open a stock 8% below your stop, turning a planned 1R loss into a 3R or 4R hit.
The biggest gap risk comes from known catalysts: earnings reports, central bank decisions, CPI and jobs data.
The simplest rule is to avoid new entries in the two to three days before a scheduled earnings release.
If you hold through one, cut the position to half size or less.
Forex and crypto bring their own version.
Forex closes on weekends and can gap at the Sunday open after geopolitical news.
Crypto trades all weekend, often on thin liquidity, so sharp wicks through stops are common.
Reducing size on Friday positions is a cheap insurance policy.
Expectancy beats win rate
Win rate is the most overrated number in trading. What matters is expectancy, the average amount you make per trade over time:
Expectancy = (win rate × average win) − (loss rate × average loss)
Compare two traders, each with an average loss of 1R.
Trader A wins 40% of the time with an average win of 2.5R: (0.40 × 2.5) − (0.60 × 1) = +0.40R per trade.
Trader B wins 65% of the time with an average win of 0.8R: (0.65 × 0.8) − (0.35 × 1) = +0.17R per trade.
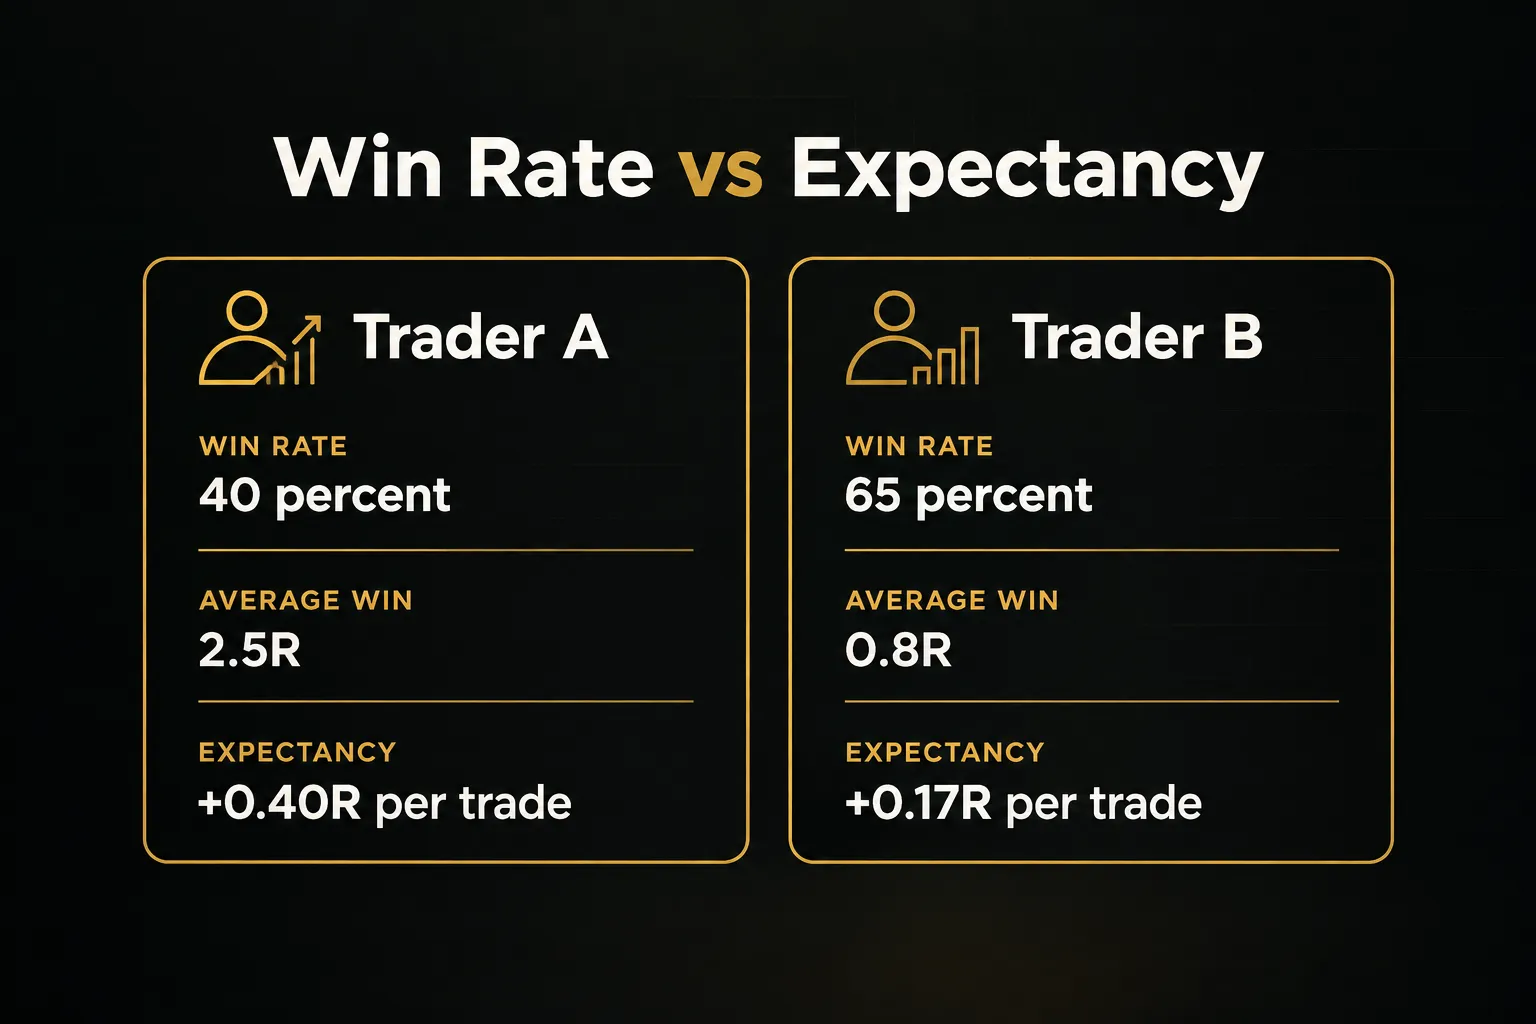
Trader A loses more often and earns more than double.
Over 100 trades risking $100 each, that is roughly $4,000 versus $1,700.
This is why the 2:1 risk-reward rule in the checklist matters so much: it lets you be wrong most of the time and still grow the account.
Backtesting and journaling without bias
Backtests lie when you let them.
Hindsight bias makes you “see” the obvious setup on a historical chart that would have been ambiguous in real time.
Survivorship bias creeps in when you test only stocks that still exist today, ignoring the ones that delisted.
Look-ahead bias happens when your rules accidentally use data that was not available at the moment of entry, such as a daily close you could not have known at noon.
The fix is boring and effective.
Scroll charts forward one bar at a time, write rules before testing, and log a minimum of 30 to 50 trades before trusting any setup.
Fewer than 30 trades and a lucky streak can look exactly like an edge.
For live trading, keep a simple journal with six fields: date, setup type, market regime, trigger quality (A, B, or C), execution notes, and outcome in R-multiples.
Grading trigger quality is the hidden gem here.
After 50 trades, most traders discover their A-grade setups carry the whole account while their C-grade setups quietly drain it… and that single insight is worth more than any new indicator.
Frequently asked questions
What is the most reliable swing trading setup?
No single swing trading setup is universally reliable. Reliability comes from matching the setup to the market regime and applying the same validation checklist every time.
That said, pullbacks in an established trend and breakout-retests tend to offer the best balance of win rate and risk-reward for most traders, because both give a clear structural stop.
What is the 3-5-7 rule in swing trading?
The 3-5-7 rule is a risk-control guideline: risk no more than 3% on any single trade, no more than 5% across one sector or correlated group, and no more than 7% in total open risk.
Treat it as a ceiling, not a target.
Many experienced swing traders risk only 0.5% to 1% per trade and stay well under the 7% total cap.
What is the best timeframe for swing trading?
The most common combination is the daily chart for trend bias and the H4 or H8 chart for entry timing. The daily filters out intraday noise, while the lower timeframe tightens your entry and stop.
Weekly charts add useful context for longer holds of two to six weeks.
How do you identify a good swing trade?
A good swing trade has four features: regime fit, a clear trigger, a favorable risk-reward of at least 2:1, and a defined invalidation point. If any one is missing, the trade is not ready.
Grading each idea A, B, or C before entry helps you filter out marginal setups.
What indicators are best for swing trading?
Moving averages, average true range, and volume are generally the most useful indicators for swing trading. They cover trend, volatility, and participation without overlapping.
Oscillators like RSI or MACD momentum readings add value for spotting RSI divergence, but they are lagging and unreliable used alone. Confirmation tools such as PipTrend’s trend engine work best when paired with price-level entries rather than treated as triggers.
How much money do you need to start swing trading?
Most traders can start swing trading with $500 to $2,000 or more, depending on the instrument and broker minimums. Forex and fractional-share brokers allow smaller accounts, while some futures and options require more.
Risk percentage matters far more than account size.
A $1,000 account risking 1% per trade will outlast a $50,000 account risking 10%.
Trade the process, not the pattern
A setup is only as good as its stop, target, and invalidation rules.
The pattern is just the starting point.
Regime, structure, sizing, and expectancy decide whether it makes money over time.
Your next step is simple.
Pick one setup type from the table, write out its complete rule set using the six-point checklist, and paper-test it for 20 trades before risking capital.
Log every trade in R-multiples.
You will learn more from those 20 trades than from 200 hours of watching charts.
Consistency in 2026 does not come from finding a better pattern.
It comes from grading every setup the same way, every time.
Use tools like PipTrend for confirmation, to check that timeframes agree and bias is clear.
Never use them as a shortcut for judgment.
The process is the edge.
Sources
Risk Disclaimer: Trading involves risk. Past performance doesn't guarantee future results. Only trade with money you can afford to lose. PipTrend is a tool to assist your trading decisions, not financial advice.