Best Indicators for Stock Trading in 2026: Top Picks Compared
On this page
Introduction
Most traders don’t lose money because they lack indicators. They lose because they stack five tools that all say the same thing, then enter late on a signal that repaints two candles later.
This guide compares the best indicators for stock trading in 2026 across every experience level: day traders working 1-minute to 15-minute charts, swing traders holding for days, position traders and long-term investors reading weekly structure, and prop firm challenge traders who need fixed rules to survive drawdown limits.
We looked at free technical analysis indicators built into TradingView, mid-tier paid TradingView indicators, and premium suites that cost four figures.
Every tool here was judged on the same seven criteria: signal clarity, entry precision, multi-timeframe confirmation, repainting and lag transparency, market coverage, trial and refund terms, and total cost of ownership (not just the sticker price).
That last point matters more than most roundups admit. A $40/month indicator that requires a paid TradingView plan and three extra tools is not cheaper than a $67/month system that does everything.
PipTrend takes the top spot because it’s the only option here that unifies direction, entry, and exit management into a single repeatable workflow, with a public results page showing verified live outcomes rather than backtest screenshots.
But it isn’t the right answer for everyone.
Free stock trading indicators like the relative strength index and moving averages still teach fundamentals better than any paid suite.
Smart-money specialists will prefer Flux Charts. Session and futures traders may get more from AlgoXpert.
Here’s the honest breakdown.
Quick Picks: Best Indicators for Stock Trading Compared
A side-by-side look at the seven tools covered in this guide, ranked by how well they serve most stock traders. Pricing reflects publicly listed 2026 rates.
| Tool | Best For | Starting Price | Notable Strength |
|---|---|---|---|
| PipTrend | Best Overall Complete System | From $40/mo (billed yearly, $479.99) | Direction + entry + exit unified, with a 12-timeframe confirmation table and verified live results |
| Free TradingView Indicators (RSI, MACD, MAs) | Best for Beginners on a Budget | $0 | Zero cost, universally taught, built into every TradingView plan |
| LuxAlgo | Best All-in-One Ecosystem | From $39.99/mo (Premium) | Signals, Price Action Concepts, Oscillator Matrix, screeners and backtesting in one platform |
| Flux Charts | Best for Smart Money Concepts | From $41.99/mo (annual, $503.92/yr) | Order blocks, fair value gaps, breaker blocks and liquidity grabs with dedicated screeners |
| ChartPrime | Best for Adaptive Signals with TP/SL | From $67/mo (Pro, or $489/yr) | Market Oracle signals with real-time take-profit and stop-loss levels |
| Zeiierman | Best for the Largest Indicator Library | From $37.99/mo (annual) | 80+ premium TradingView tools, nine buy/sell algorithms, two strategy bots |
| Market Cipher | Best for Brand Recognition and Oscillator Depth | $600/yr promotional (listed $1,000) | Established four-part suite with 24-hour Discord support |
| AlgoXpert | Best for Session-Based Auction Theory | From $58/mo (yearly, $696) | Auction Map with value areas, POC and session profiles in 61 modules |
Prices verified against public pricing pages as of 2026. Several vendors run rotating promotional discounts, so check the checkout page before committing.
PipTrend: Best Overall for a Complete Direction-to-Exit Trading System
PipTrend is the top pick because it fixes the problem almost every other indicator creates: the impulse entry.
Here’s the design principle.
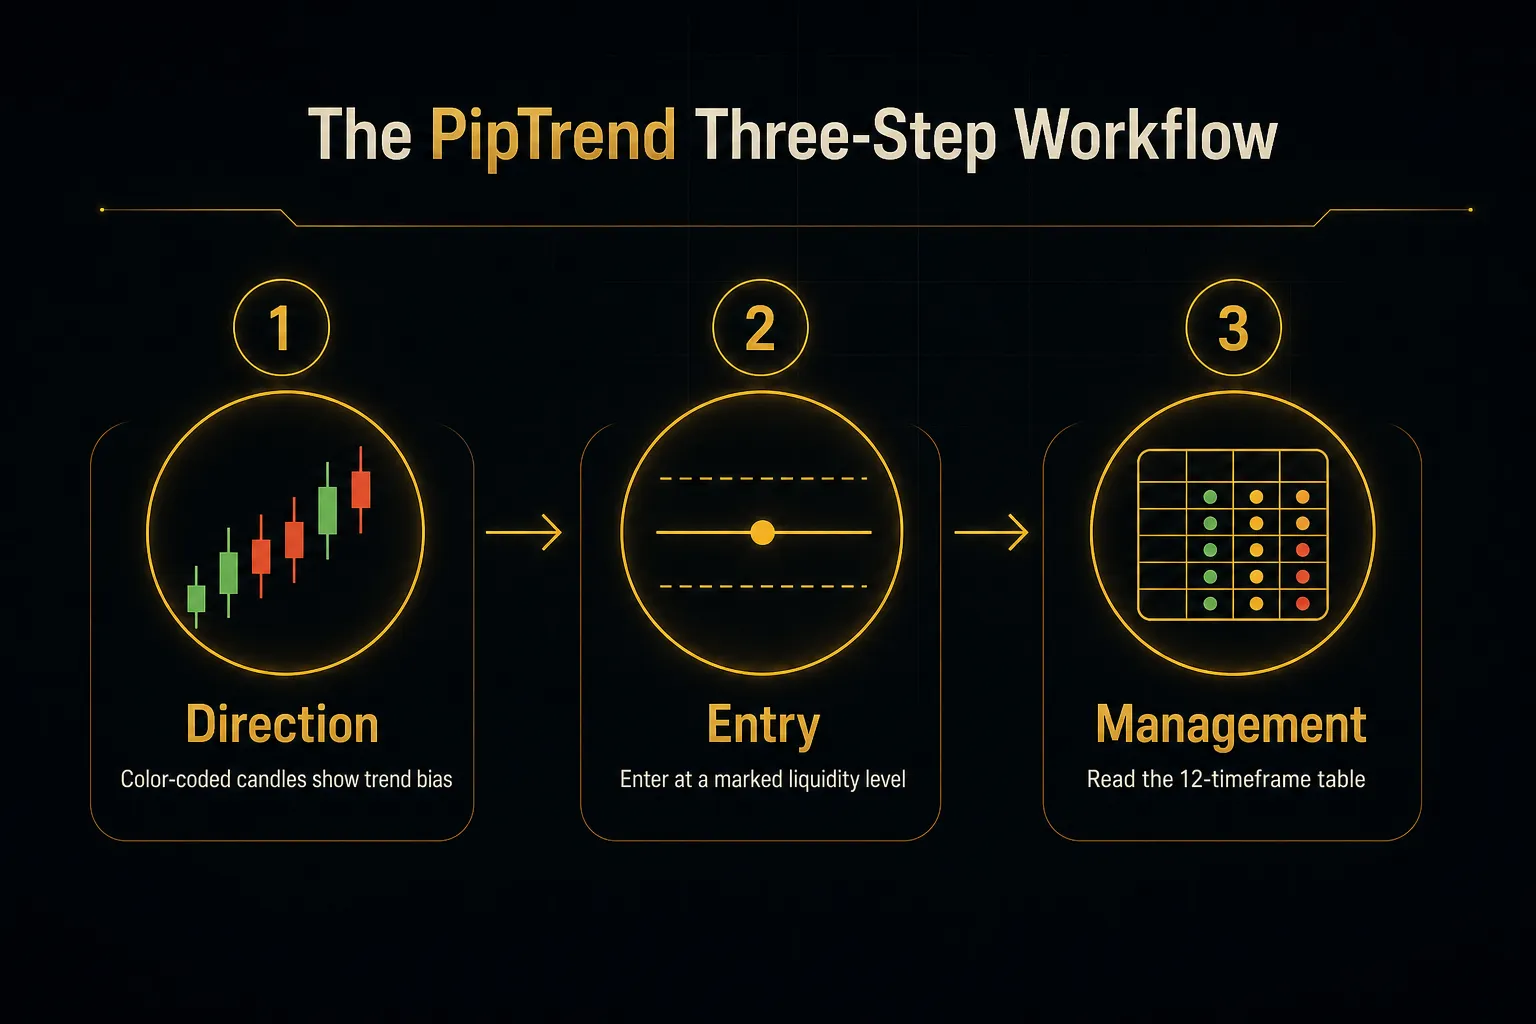
The signal tells you direction only. The entry comes from a marked price level.
That separation is deliberate, and it’s why PipTrend users stop buying tops the second a green arrow appears.
Direction comes from adaptive trend detection that paints candles directly on the chart. Green for bullish momentum, red for bearish pressure, gray while a trend is still forming.
A built-in whipsaw filter keeps you out of choppy, low-probability conditions instead of firing signals into every fake breakout.
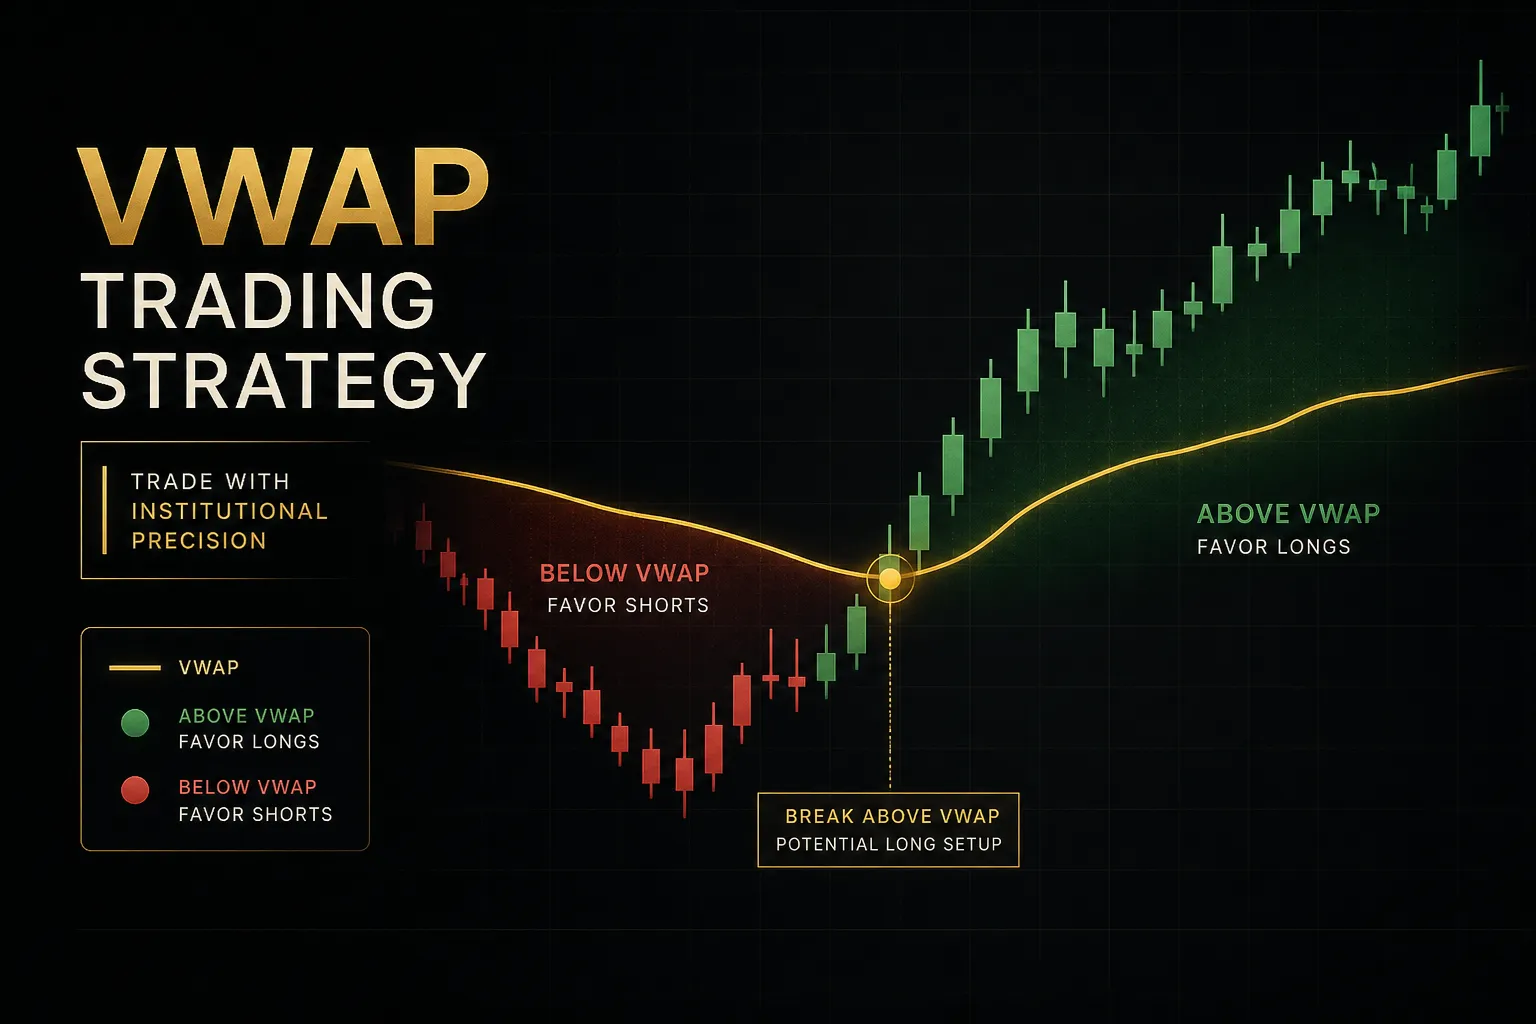
Entries come from marked levels: VWAP, session highs and lows, previous day high and low, supply and demand zones with mitigation tracking, and fair value gap detection. There’s also a Confidence Band, a dynamic zone showing where pullback entries tend to hold as support in uptrends and resistance in downtrends.
Then there’s the part most roundups skip entirely: trade management.
The 12-timeframe confirmation table shows BUY, SELL or NEUTRAL status from the 1-minute chart all the way to Monthly. Use it to confirm confluence before entering, and to decide whether to hold longer or bank profit.
That single dashboard is the difference between “I got a good entry” and “I knew when to get out.”
Coverage spans Forex, Crypto, Indices, Commodities and Stocks, with real-time push, email and desktop alerts on any instrument and timeframe.
Session killzones for Asian, London, New York AM and New York PM auto-adjust to your timezone.
And signals confirm on candle close, so a printed signal doesn’t change afterwards.
On transparency, PipTrend publishes trade ideas taken with the indicator on a public results page, with verified cTrader statements including losses and break-evens.
Not a highlight reel.
Pricing: $59.99/mo monthly, $45/mo quarterly (billed $134.99 every 3 months), or $40/mo yearly (billed $479.99).
All plans include every indicator, all future updates, community access, and 18 free companion tools covering position sizing, risk-reward, expectancy and more.
There’s a 3-day free trial and a 30-day money-back guarantee on every plan.
Best for: day traders, swing traders, long-term investors and prop firm challenge traders who want one repeatable workflow instead of stacking unrelated tools that argue with each other.
Honest drawback: it’s a subscription, not a one-time purchase, and there’s a real learning curve. Reading a 12-timeframe table alongside marked entry zones takes a week or two of screen time before it becomes second nature.
Free TradingView Indicators (RSI, MACD, Moving Averages): Best for Beginners on a Budget
If you’ve been trading less than six months, start here.
Not with a paid suite.
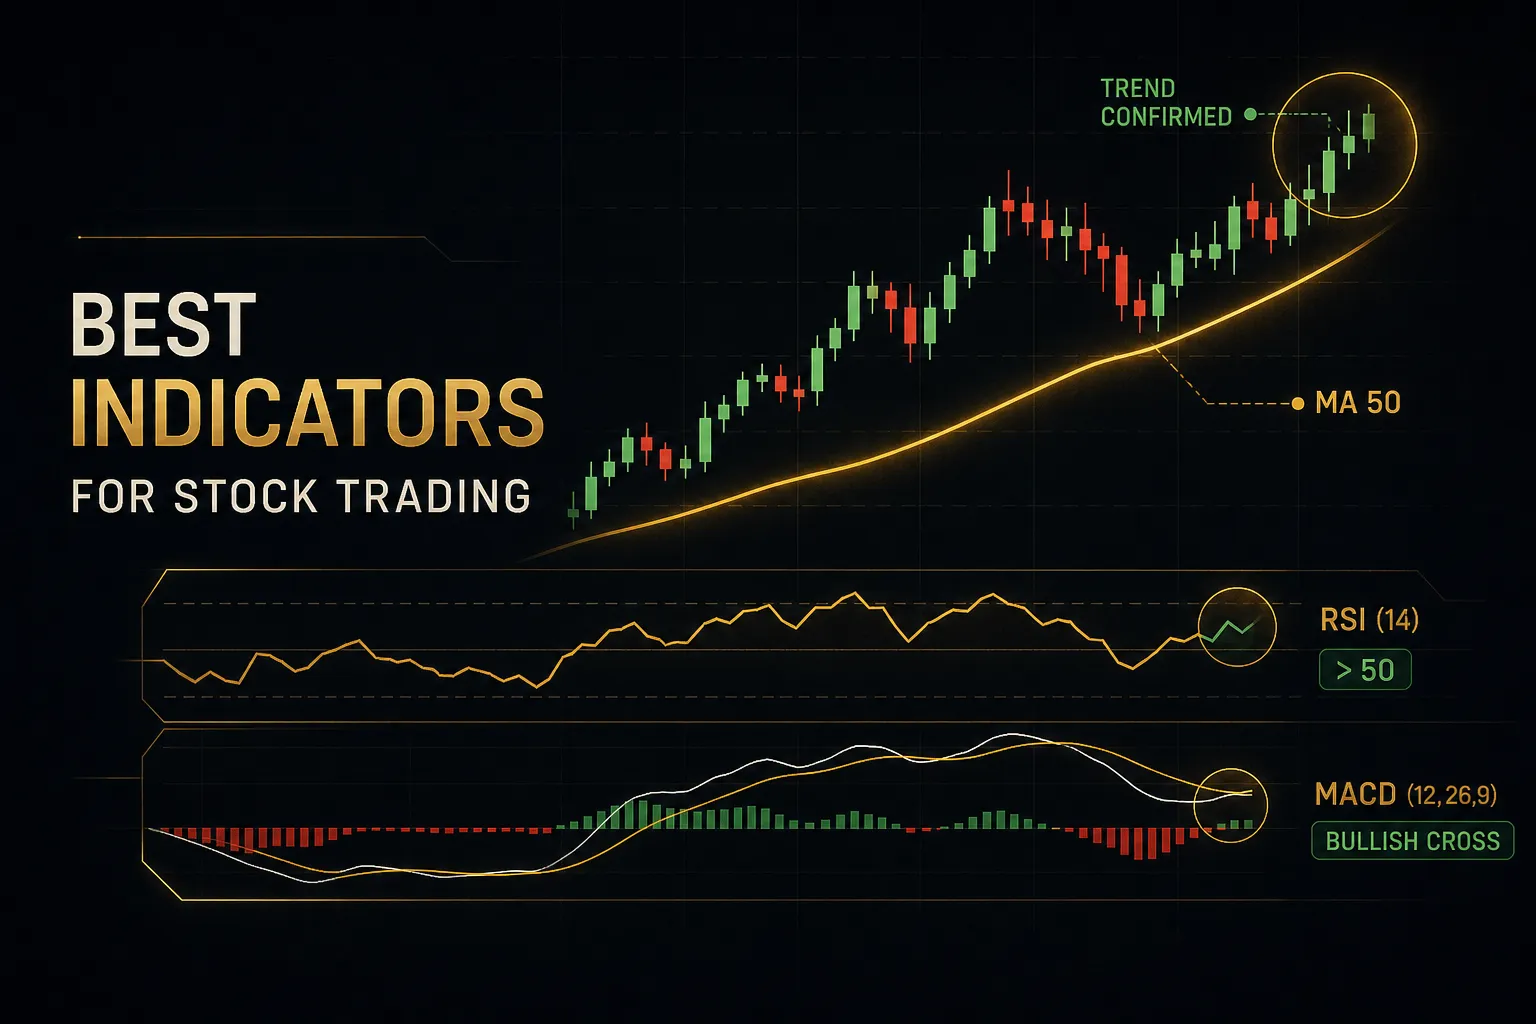
The built-in library covers the classics: simple and exponential moving averages, the relative strength index, the MACD indicator, Bollinger Bands, average directional index, on-balance volume and VWAP. All free, all included with a basic TradingView account.
They’re also the most widely taught stock chart indicators in existence, which means free education is everywhere. Understanding why a 50-period EMA crossing a 200-period EMA matters is foundational knowledge no paid tool replaces.
RSI and MACD both work well in trending markets.
The catch? They measure the same thing.
Stack them together and you get two tools nodding at each other, not confirmation.
Pricing: free with any TradingView account, including the free tier (limited to two indicators per chart).
Best for: newer investors and beginners learning support and resistance, trend structure and momentum before committing money to a paid system.
Honest drawback: no entry-location precision, no built-in risk management tools, and a high false-signal rate in choppy or ranging markets. There’s no multi-timeframe confirmation logic either, so you’re manually flipping charts to check alignment.
That’s fine when you’re learning.
It gets expensive when you’re trading size.
LuxAlgo: Best for an All-in-One Technical Analysis Ecosystem
LuxAlgo is the most feature-dense ecosystem on this list, and one of the most established.
The toolkit splits into three main modules.
Signals & Overlays handles confirmation and contrarian signals plus trend tools like Smart Trail. Price Action Concepts covers market structure and order blocks. Oscillator Matrix handles momentum and divergence analysis.
Beyond the indicators, you get screeners, strategy alerts, backtesters and AI-assisted strategy research. It’s a genuinely mature platform with years of iteration behind it.
The tiering is generous too.
A free library gives you access to a meaningful chunk of tools before paying anything, which makes it easy to test the workflow at zero risk.
Pricing: free plan available. Premium at $39.99/month, Ultimate at $59.99/month, with annual billing discounts and a 30-day money-back guarantee.
Best for: traders who want a broad, mature toolkit and are comfortable assembling their own workflow from several modules.
Honest drawback: the sheer volume of tools cuts both ways. Chart clutter is a real risk, and figuring out which combination of Signals, Price Action Concepts and Oscillator Matrix settings suits your style takes longer than with a purpose-built single system.
You’re buying components, not a finished process.
Flux Charts: Best for Smart Money Concepts and Liquidity-Based Entries
If your strategy is built on smart money concepts, Flux Charts is the sharpest specialist here.
The SFX Algo Toolkit handles entry and exit analysis, while the Price Action Toolkit covers the full SMC vocabulary: market structure shifts, break of structure and change of character, order blocks, fair value gaps, breaker blocks, liquidity grabs and premium/discount zones. A separate multi-timeframe Supply & Demand Zones Toolkit rounds it out.
What separates Flux from generic SMC scripts is the supporting infrastructure. There are dedicated screeners and backtesters for SFX, PAT and Supply & Demand, plus TradingView alerts for BOS, CHoCH, fair value gaps and order block taps.
The community side is strong as well, with a Discord, live educational classes and a strategy library.
Pricing: the Pro plan is publicly listed at $41.99/month billed annually ($503.92/year). Monthly and lifetime options are displayed on the pricing page but exact figures aren’t consistently published, so verify at checkout.
Best for: traders committed to smart-money and price-action methodology who want depth in that specific discipline rather than a general-purpose system.
Honest drawback: the narrow focus is the trade-off. Structure-based tools tell you where institutional interest might sit, but they don’t cover momentum, volatility or trade management.
You’ll still be adding separate tools for those, which pushes your real monthly cost above the headline price.
ChartPrime: Best for Adaptive Signals with Built-In Take-Profit and Stop-Loss Levels
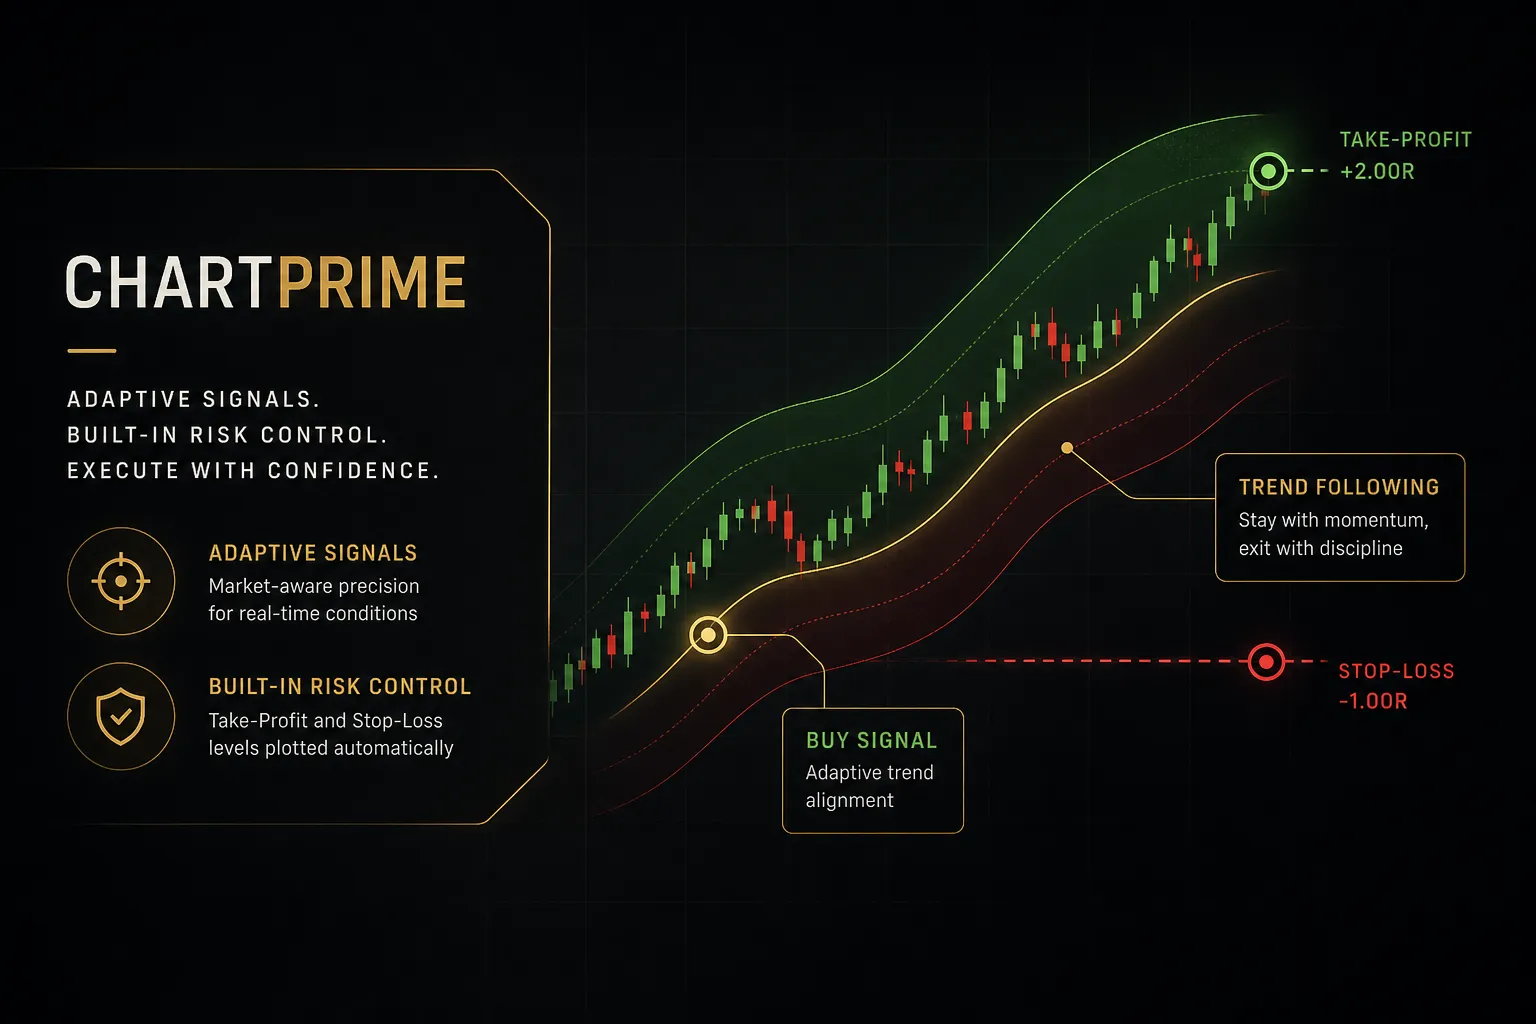
ChartPrime’s edge is that it tells you where to exit, not just where to enter.
The core is Market Oracle, an adaptive buy/sell signal engine that plots real-time take-profit and stop-loss levels on the chart. Pair that with Prime Oscillators for momentum shifts, divergence, overbought/oversold zones and exhaustion signals, and you have a fairly complete entry-to-exit package out of the box.
Four core indicators ship with ChartPrime Pro. The higher Plus tier unlocks custom signal-building, letting you define your own conditions rather than accepting the defaults.
Markets covered include stocks, crypto, forex, futures and commodities. Members also get live strategy sessions, daily market insights and a private community.
Pricing: Pro at $67/month or $489/year. Plus at $117/month or $708/year.
A 20% promotional code is frequently advertised on the site, so check before paying list.
Best for: traders who want explicit TP and SL levels handed to them and don’t want to build their own exit rules from scratch.
Honest drawback: at $67/month for the entry tier, ChartPrime sits at the higher end of the mid-market.
And the jump to Plus at $117/month is hard to justify unless you genuinely need custom signal construction.
Most traders won’t.
Test Pro first and only upgrade if you hit a wall.
Zeiierman: Best for Traders Who Want the Largest Indicator Library
Nobody offers more tools per dollar than Zeiierman.
Membership unlocks more than 80 premium TradingView tools, including nine advanced buy and sell algorithms, a dedicated Smart Money Concepts indicator, liquidity signals, overbought/oversold signals and two automated strategy bots.
Coverage is broad by design: trends, breakouts, momentum, supply and demand, support and resistance, smart-money concepts and volume all have dedicated tools. There’s also a real-time backtesting algorithm for validating combinations before you trade them.
Community and education come bundled through a VIP Discord, tutorials and posted trade setups.
Pricing: current public listings show roughly $49/month for monthly access (with a promotional code), $59.99/month billed quarterly, and $37.99/month billed annually. Lifetime access is offered but the amount isn’t clearly published, so verify at checkout before committing.
Best for: experienced traders who want maximum optionality and enjoy curating their own indicator stack from a large library.
Honest drawback: 80+ tools with no guidance on which to pair is a double-edged sword. It’s genuinely easy to end up running three momentum oscillators that all say the same thing, mistaking repetition for confluence.
If you already know exactly what you’re missing, this is excellent value.
If you don’t, the library will make your charts worse before it makes them better.
Market Cipher: Best for Established Brand Recognition and Oscillator Depth
Market Cipher is the legacy name in this category, and it’s priced like one.
The suite has four components.
Market Cipher A handles chart-based trend and signal analysis. Market Cipher B is the flagship oscillator and the piece most traders actually know it for. Market Cipher SR maps lower-timeframe support and resistance, and Market Cipher DBSI refines directional signals.
It works across stocks, crypto, currencies, futures, bonds and precious metals, with a Discord community offering 24-hour support plus educational guides and tutorials.
The brand recognition genuinely matters here. Because so many traders use it, there’s a deep well of community discussion, shared setups and third-party tutorials that newer suites can’t match.
Pricing: Professional 12-month access lists at $1,000 with a displayed promotional price of $600. Lifetime lists at $3,000 with a displayed promotional price of $1,500.
Enterprise pricing is by request.
Best for: experienced traders who already trade an oscillator-based methodology and want a recognizable tool with a large existing community.
Honest drawback: the upfront cost is steep next to $40 to $60 monthly alternatives, and there’s no low-commitment way to test it. The product design also shows its age compared with newer adaptive suites.
You’re paying partly for the name.
AlgoXpert: Best for Session-Based Auction Theory and Futures/Intraday Trading
AlgoXpert is the most specialized tool here, and for the right trader it’s the most useful.
Everything is built around auction theory.
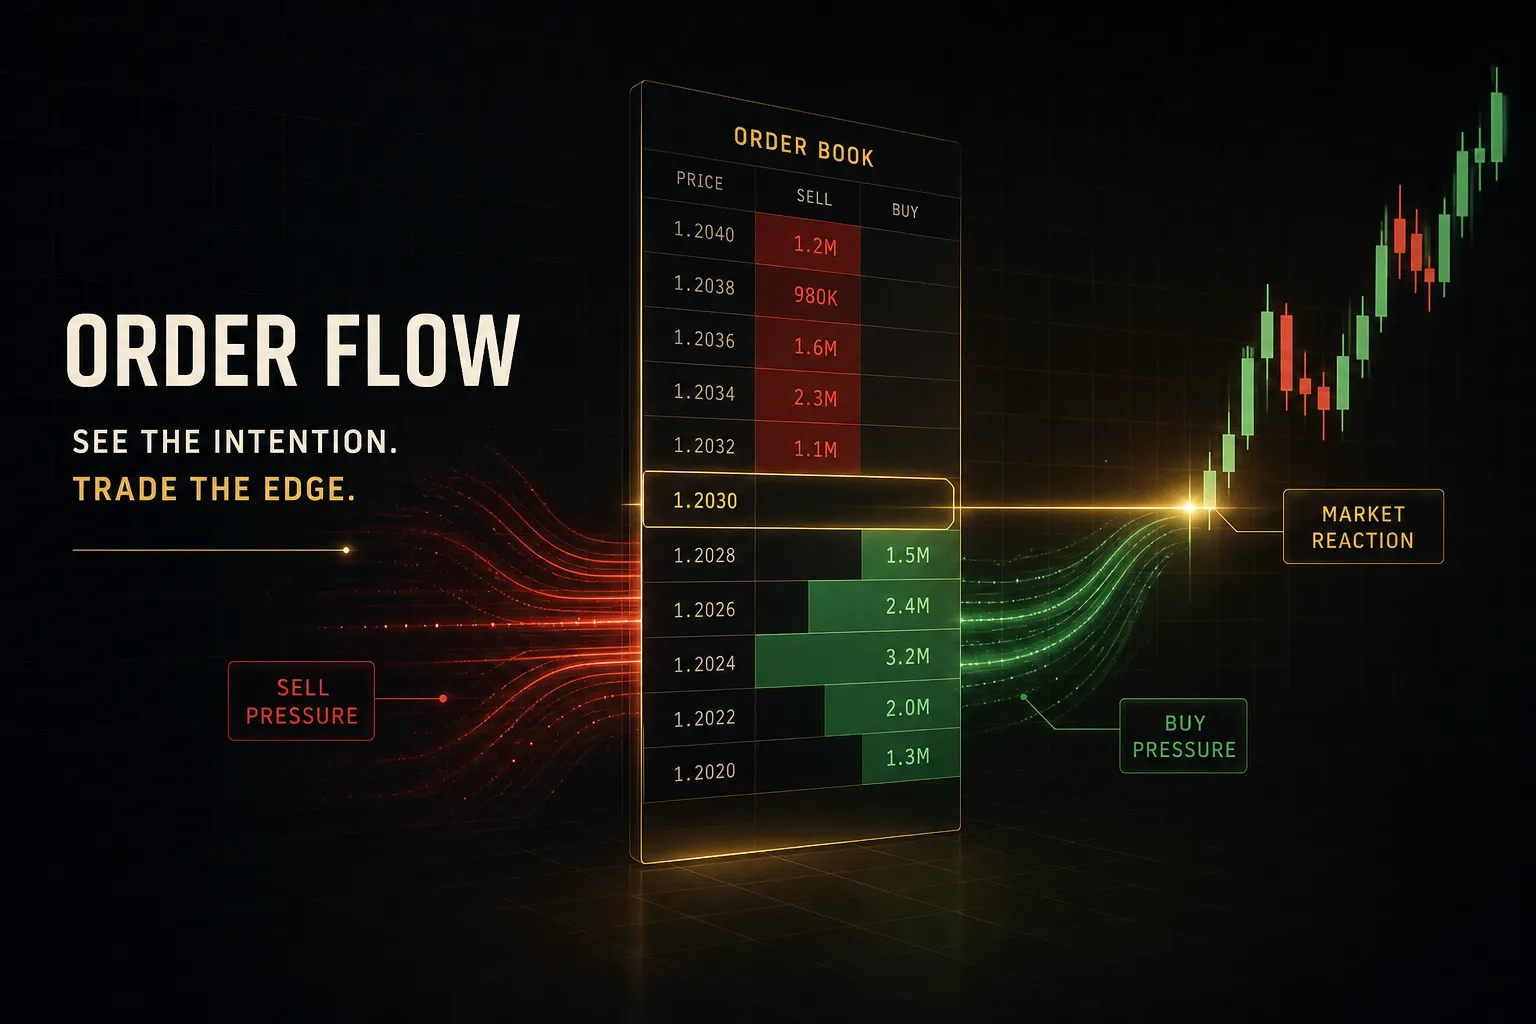
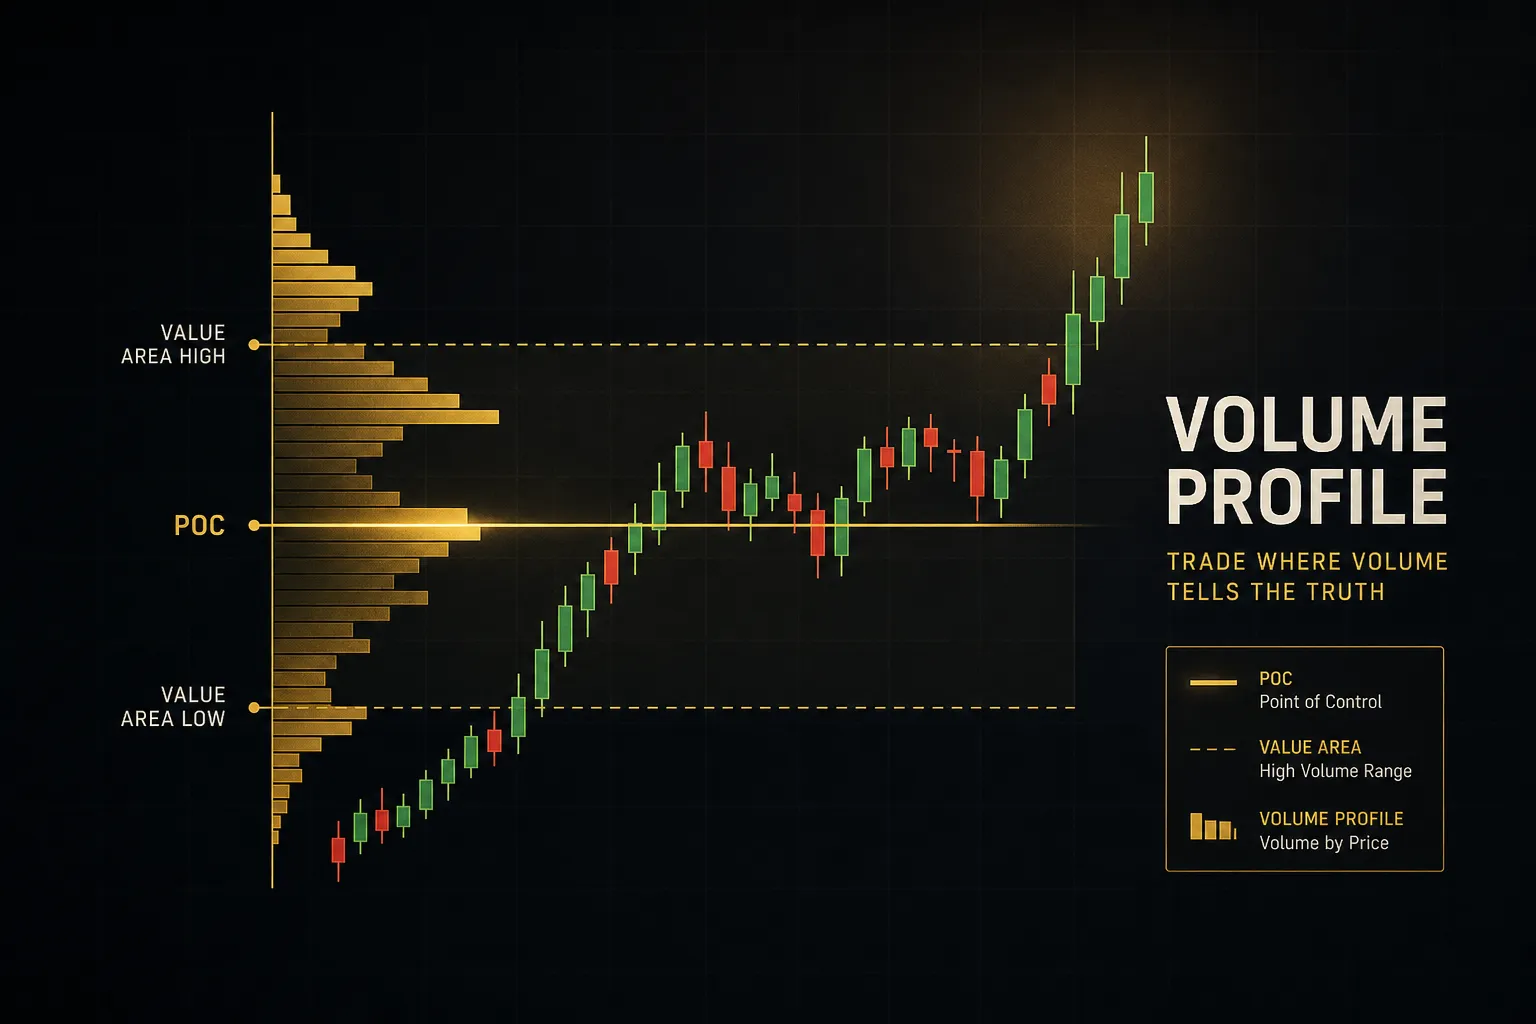
The Auction Map plots value areas, point of control, session and composite profiles, untested points of control and low-volume zones. Add session frames, initial balance, the VWAP indicator with deviation bands, a momentum cloud and a confirmed entry orb, and you have a proper order-flow workflow inside TradingView.
The engineering feat is packing 61 modules into a single TradingView indicator slot, which matters if you’re on a plan with tight indicator limits. The product page also cites 35 checks per signal.
Two claims stand out: no repainting, and no requirement for a second platform or paid order-flow data feed. Both address transparency gaps that plague this category.
Pricing: $79/month monthly after a 7-day free trial, $66/month quarterly ($198 every three months), or $58/month yearly ($696/year).
Best for: session traders and futures traders who build their day around initial balance, value area rotation and point-of-control tests.
Honest drawback: the learning curve is steep.
Auction theory is a discipline in itself, and 61 modules is a lot to configure before you place a trade.
For swing traders or long-term investors who never trade a session open, it’s substantial overkill.
How to Choose the Right Indicator or Indicator System
The single most useful question you can ask before buying anything: what question is my current setup failing to answer?
Most traders add tools to fix a problem they haven’t diagnosed. Then they wonder why the charts got busier and the results didn’t change.
Match the Indicator Type to Your Trading Style and Timeframe
There are five functional categories of technical analysis indicators, and each answers a different question.
- Trend indicators (moving averages, exponential moving average ribbons, average directional index) answer: which direction should I be trading?
- Momentum oscillators (relative strength index, MACD indicator, Stochastic) answer: is this move gaining or losing steam?
- Volatility tools (Bollinger Bands, ATR) answer: how much room should this trade need, and how wide should my stop be?
- Volume tools (volume profile, on-balance volume) answer: is real participation behind this move?
- Entry-location tools (VWAP indicator, support and resistance, supply and demand zones, fair value gaps) answer: where exactly do I get in?
Now map that to how you trade.
Day traders need session-based entry tools and VWAP above everything else. Direction on a 5-minute chart is only half the job; a precise level is what keeps the stop tight enough to be worth taking.
Swing traders live and die by multi-timeframe trend confirmation.
Entering long on a 4-hour signal while the Daily is rolling over is the most common way to donate money.
Long-term investors should weight Weekly and Monthly signals heavily and treat intraday noise as irrelevant. A tool that shows Monthly trend state at a glance is worth more than ten intraday oscillators.
Prop firm challenge traders need something different again: fixed, repeatable rules.
Drawdown limits punish discretionary decisions.
If your process changes based on how you feel about a candle, you will fail the challenge eventually.
Avoid Redundant Indicator Stacks and Watch for Repainting
Running RSI and Stochastic together feels like confirmation.
It isn’t.
Both measure momentum through similar mathematics, so when they agree, you’ve learned one thing twice.
The better structure is one tool from three different categories: a trend tool for direction, a momentum tool for timing, and an entry-location tool for the actual level.
Three tools, three answers, no overlap.
Then there’s repainting, which is the quiet scandal of the paid indicator market.
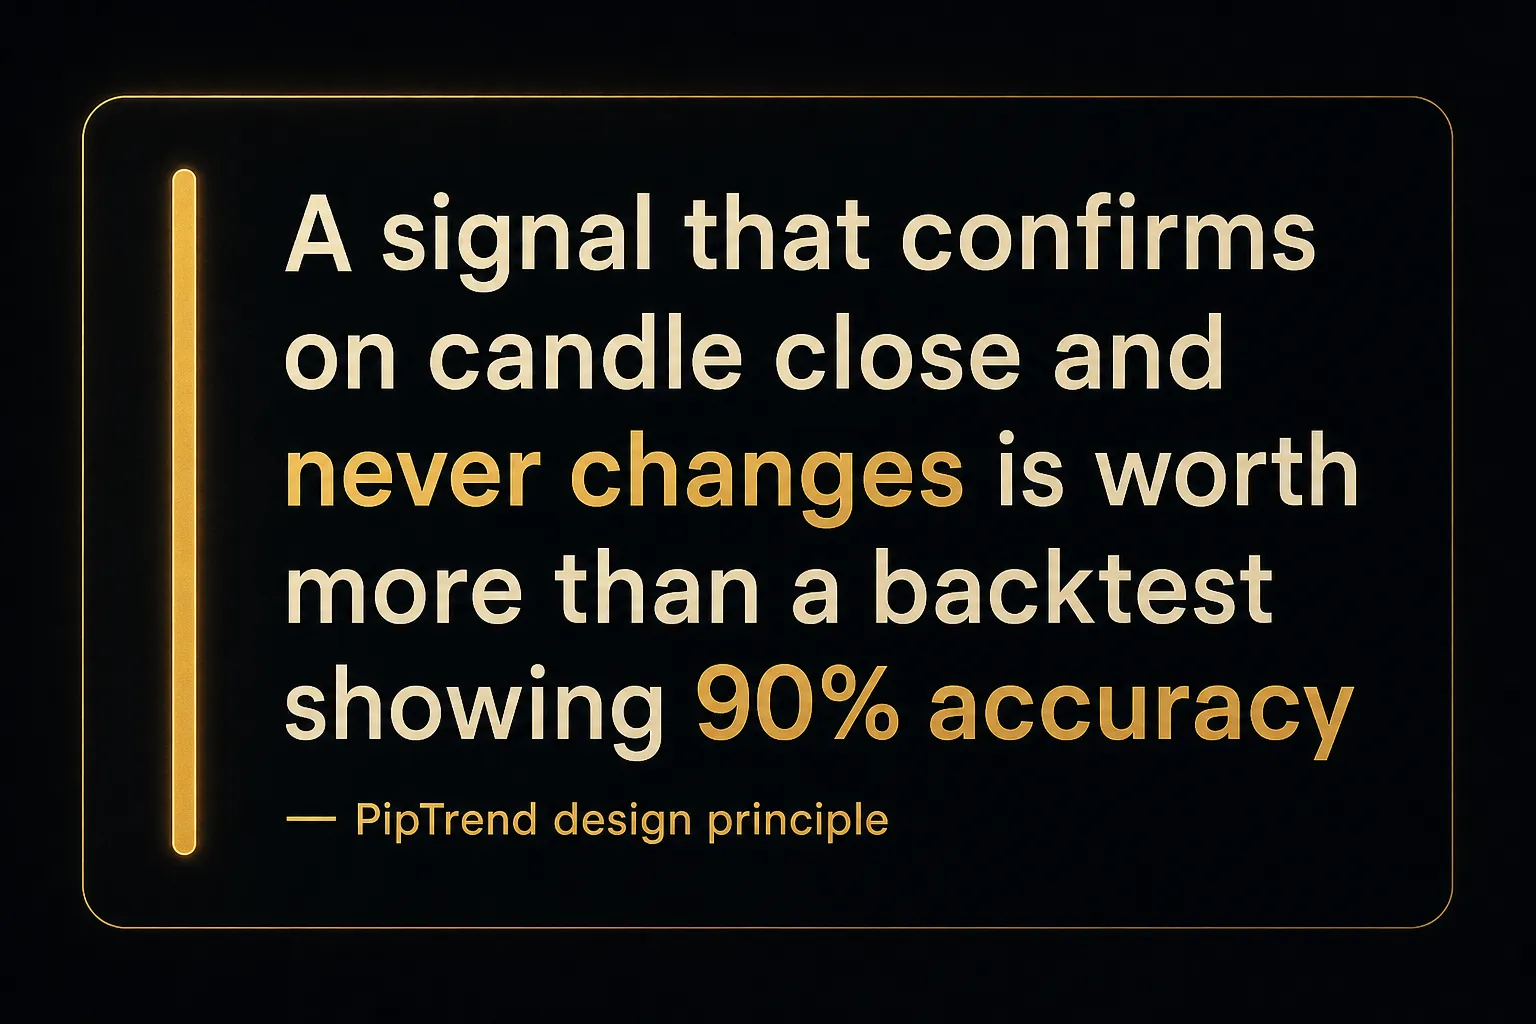
A repainting indicator changes its historical signals after the fact, which makes backtest screenshots look extraordinary and live performance look nothing like them. Ask one question before buying: do signals confirm on candle close and stay fixed?
Non-repainting indicators that confirm on close will feel slower.
That’s the point.
A signal that can’t change is a signal you can actually build rules around.
Signal lag matters too, but less than most people think. A slightly late entry at a good level beats a perfectly timed entry at a bad one.
Compare Total Cost, Trial Periods, and Refund Policies
Indicator pricing is rarely the full cost.
Work out what you’re actually spending.
First, TradingView plan requirements.
The free tier allows only two indicators per chart. Most paid suites push you to Essential or Plus, adding $15 to $30/month to your real bill.
AlgoXpert’s 61-modules-in-one-slot approach is genuinely valuable here for exactly that reason.
Second, billing cycles.
Annual plans routinely cut 30 to 40% off monthly rates. PipTrend drops from $59.99 to $40/month on the yearly plan. Zeiierman goes from around $49 to $37.99.
But annual billing means committing before you know if the tool suits you.
Which makes trial and refund terms the deciding factor.
PipTrend offers a 3-day free trial plus a 30-day money-back guarantee on every plan. LuxAlgo has a free tier and a 30-day guarantee. AlgoXpert gives a 7-day free trial.
Market Cipher’s $600 to $1,500 upfront pricing offers no comparable low-risk entry, which is a real consideration at that price.
Finally, build your decision framework before you shop.
Signal for direction, level for entry, table for exit.
That’s PipTrend’s structure, and it’s a useful model whether you end up buying a full system, a small stack, or nothing at all.
If a tool you’re considering doesn’t answer one of those three questions better than what you already have, don’t buy it.
FAQ
What is the most reliable indicator for stock trading?
No single indicator is universally most reliable, and any vendor claiming otherwise is selling you something. Reliability depends entirely on market condition, timeframe and how the signal is confirmed.
Moving averages are highly reliable in trending markets and nearly useless in ranges. The relative strength index is reliable at extremes in ranging conditions and dangerously misleading in strong trends, where it stays overbought for weeks.
What actually improves reliability is confirmation across multiple timeframes rather than an isolated signal on one chart. A buy signal on the 15-minute means something very different when the Daily and Weekly agree versus when they don’t.
What are the top 5 technical indicators for stock trading?
The five categories every stock trader should understand are: moving averages for trend, RSI and MACD for momentum, Bollinger Bands and ATR for volatility, volume profile and on-balance volume for participation, and VWAP plus support and resistance for entry location.
Learn one from each category rather than five from one.
Five momentum oscillators tell you the same story in five fonts.
Which indicator is best for beginners in stock trading?
Start with free built-in tools: a 50-period and 200-period moving average, plus the relative strength index. Both are free with any TradingView account and both teach concepts you’ll use for the rest of your trading life.
Spend three to six months reading charts with just those two before paying for anything. Once you understand trend structure, support and resistance, and why a signal in a range behaves differently than a signal in a trend, a structured paid system becomes genuinely useful.
Before that, it’s just a more expensive way to be confused.
What is the best indicator for identifying buy and sell signals?
The best approach pairs a directional signal with a marked entry level, rather than relying on the signal alone. This is the core weakness of standalone signal indicators: an arrow tells you the market is bullish, but not where to enter, so traders buy at the top of a candle and get stopped out on a normal pullback.
PipTrend is built explicitly around this separation. The color-coded candles establish direction, then the entry comes from a marked level like VWAP, a session high, a supply and demand zone or a fair value gap.
Same signal, dramatically better entry price and tighter risk.
Can you use multiple indicators together for stock trading?
Yes, but only across different categories. Combining a trend indicator, a momentum oscillator and an entry-location tool gives you three independent inputs that genuinely confirm each other.
Combining two momentum oscillators does not.
RSI and Stochastic measure similar conditions, so agreement between them isn’t confirmation, it’s duplication.
Three well-chosen tools beat eight overlapping ones every time.
A practical rule: if you can’t state in one sentence what a given indicator adds that the others don’t, remove it from the chart.
Are paid trading indicators better than free indicators?
Not automatically.
A free 200-period exponential moving average will outperform a poorly designed $100/month signal generator in almost any market.
Paid tools earn their price through four specific things: entry-location precision, multi-timeframe confirmation logic, transparent live results (verified statements, not backtests), and defined risk management workflows. Free indicators typically deliver none of these.
The honest test is whether a paid system saves you time and removes decisions. If it just adds more lines to a chart you’re already struggling to read, you’ve bought clutter at $50/month.
Look for a free trial and a money-back guarantee before paying. PipTrend’s 3-day trial and 30-day guarantee, LuxAlgo’s free tier and AlgoXpert’s 7-day trial all let you test on live charts first.
Use them.
Risk Disclaimer: Trading involves risk. Past performance doesn't guarantee future results. Only trade with money you can afford to lose. PipTrend is a tool to assist your trading decisions, not financial advice.