What Is cTrader and How Do You Use It?
On this page
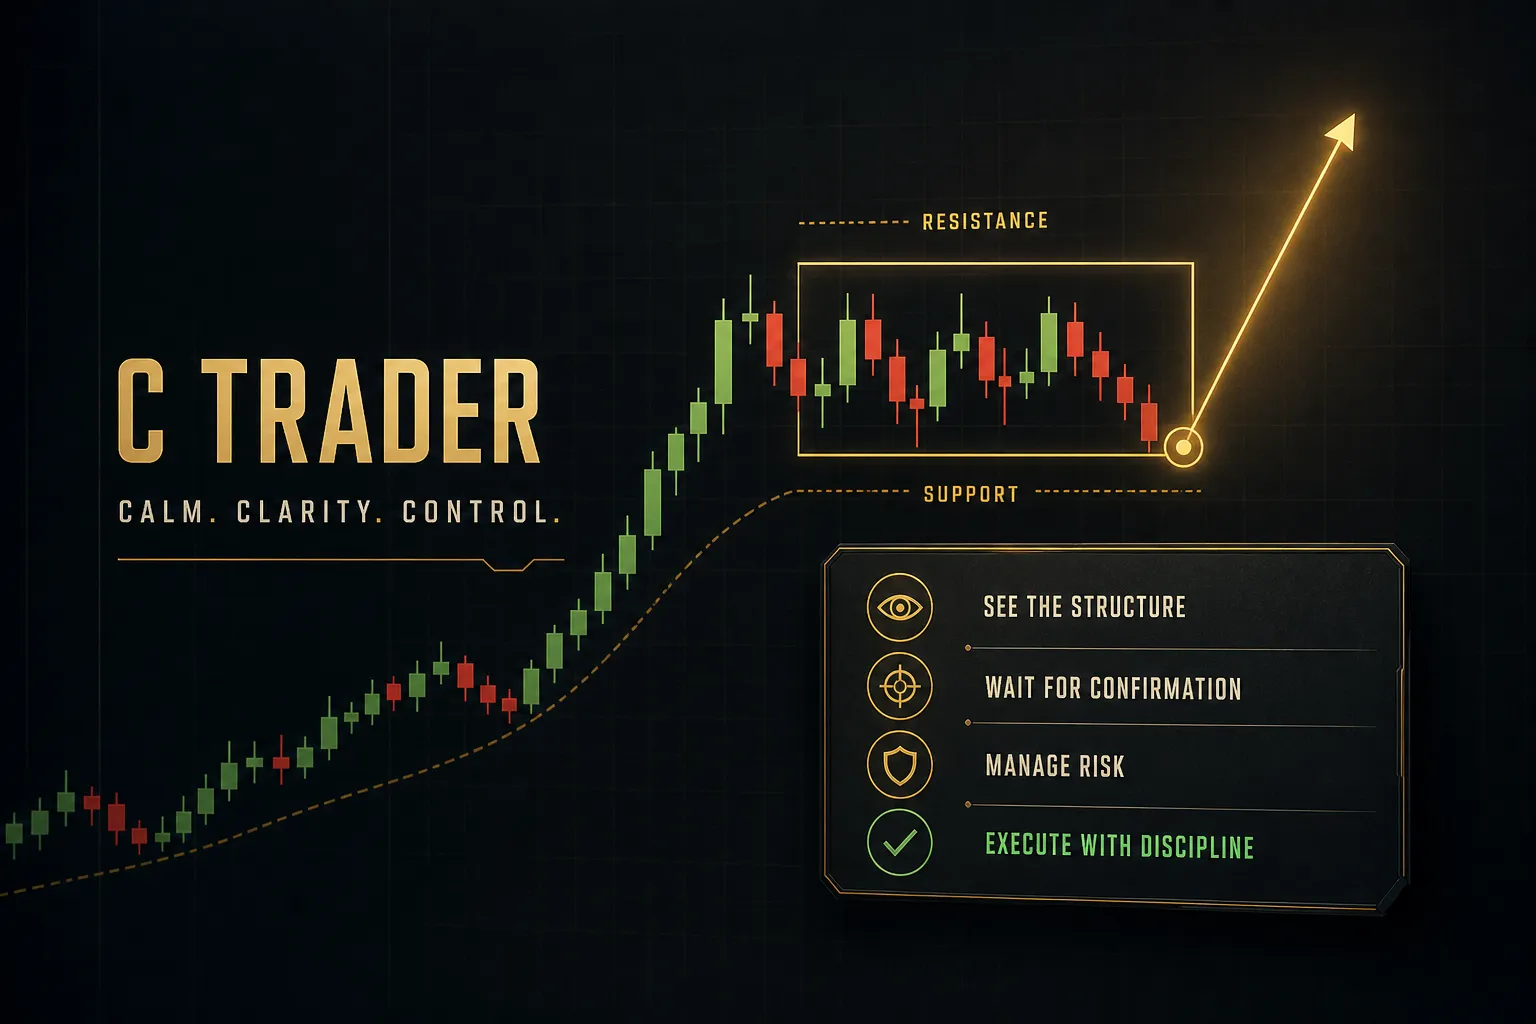
Most traders discover cTrader the same way: their broker offers it as an alternative to MetaTrader, and they wonder whether switching is worth the learning curve.
Fair question.
This guide covers the whole thing. Setup, charting, order execution, position sizing, automation, and copy trading, in the order you’ll actually need them.
What Is cTrader, Really?
cTrader is a multi-asset trading platform built by Spotware, a Cyprus-based fintech firm, and licensed to forex and CFD brokers around the world. It handles chart-based technical analysis, order placement, position management, and algorithmic trading in a single interface.
Here is the part that confuses new users.
cTrader is not a broker.
It’s a terminal, the software layer between you and whichever broker holds your money.
That distinction matters more than it sounds.
Your spreads, commissions, available symbols, leverage caps, and execution speed are all determined by the broker, not by Spotware. Two traders using identical cTrader Windows installations can get very different fills because they’re connected to different servers.
Choosing cTrader is a platform decision. Choosing your broker is a money decision. The second one carries far more weight.
What cTrader does well is transparency.
It shows Level II depth of market pricing by default, timestamps every fill, and reports slippage on execution. It was built for ECN-style pricing from the start, which is why brokers with raw spread accounts tend to favour it.
Over the next sections we’ll walk the full path: getting an account connected, building readable candlestick charts, adding and configuring technical indicators, turning a signal into a risk-defined trade, and then extending into cBots and cTrader Copy.
One expectation to set before any of that.
No platform, indicator, or automated tool guarantees a profitable trade.
cTrader is an execution and analysis instrument. It can make your process faster, cleaner, and more repeatable.
It cannot make your edge appear out of nothing, and any source suggesting otherwise is selling something.
Getting Started With cTrader
The single most common beginner mistake is downloading the wrong version. If you plan to run custom indicators or automated strategies, the browser version will not do it, and you’ll spend an afternoon wondering why the Algo tab is missing.
Web, Desktop, Mac, and Mobile
All four versions share the same account, the same open positions, and the same server connection. What differs is capability.
| Feature | cTrader Web | cTrader Windows | cTrader Mac | cTrader Mobile |
|---|---|---|---|---|
| Built-in technical indicators | Yes (70+) | Yes (70+) | Yes (70+) | Yes (60+) |
| Custom indicators (C#) | No | Yes | Yes | No |
| cBots and cTrader Algo | No | Yes | Yes | No |
| Backtesting and strategy optimisation | No | Yes | Yes | No |
| Full order management (market, pending, OCO) | Yes | Yes | Yes | Yes |
| Depth of Market / Level II | Yes | Yes | Yes | Limited |
| Multiple workspaces and chart templates | Partial | Yes | Yes | No |
| Install required | No | Yes | Yes | Yes (app store) |
The rule of thumb: Web and Mobile are for monitoring and manual execution. Windows and Mac are for building, testing, and automating.
How to Download and Log In
Setup takes about ten minutes if you already have broker credentials.
- Pick a cTrader-supporting broker. Check the platform page on their site and confirm which asset classes are available on cTrader specifically, since some brokers restrict certain symbols to MetaTrader only.
- Request demo or live credentials. Demo accounts are usually instant. Live accounts need identity verification, which typically takes one to three business days.
- Download the correct build. Get cTrader Windows or cTrader Mac from your broker’s download link, or open cTrader Web in a browser if you only need charts and manual orders.
- Create or sign in with your cTrader ID. This is your single Spotware-level login that can hold multiple broker accounts at once, which is genuinely useful if you trade with two firms.
- Link the trading account. Select your broker’s server from the list, enter the account credentials, and confirm the balance appears in the top bar.
- Set up your panels. Pin Market Watch for your symbol list, Trade Watch for open positions and history, and the Active Symbol Panel for quick one-click order entry.
Do You Need a Broker?
Yes.
Always.
cTrader has no standalone trading account of its own, and every single login is tied to a specific broker’s server.
Your cTrader ID can exist without a funded account, but it gives you nothing to trade with.
Think of it as a passport that still needs a visa.
This is also why most early problems are broker problems in disguise.
Missing symbols? Your account type doesn’t include that instrument set.
Volume that looks 100x wrong? Some brokers quote in units rather than lots, so 100,000 units equals 1.00 standard lot.
Rejected orders usually mean insufficient margin level, a stop-loss placed inside the broker’s minimum distance, or trading outside session hours. Disconnected charts almost always trace to server-side maintenance or a local firewall blocking the connection.
Start on demo.
Spend a week confirming that symbols, volumes, and order types behave the way you expect before real money touches the platform.
Mastering Charts and Indicators
cTrader ships with more than 70 built-in technical indicators.
Most traders should use three or four.
That gap explains a lot of blown accounts.
Built-In vs Custom Indicators
Built-in indicators run on every cTrader app, including Web and Mobile. They cover the four standard families: trend indicators like moving averages and Ichimoku, momentum indicators like RSI and MACD, volatility indicators like Bollinger Bands and ATR, and volume indicators like OBV and Volume Profile.
Custom indicators are written in C# and only run on cTrader Windows or cTrader Mac. They’re compiled through cTrader Algo, which means they execute as real code rather than as chart drawings.
The advantage is precision.
A custom indicator can reference multiple timeframes, apply proprietary filters, and output structured signals. The tradeoff is that it needs a desktop machine running for anything that alerts in real time.
Adding and Configuring Indicators
The workflow is identical across every version, with a few extra options on Desktop.
- Open the Indicators menu. Click the “f(x)” icon on the chart toolbar, then browse by category or type the indicator name into the search field.
- Choose overlay or separate panel. Trend indicators belong on price (overlay), while momentum and volume indicators belong in their own panel below so they don’t compress your candlestick charts.
- Set the parameters. Adjust period, source (close, open, high/low median), and calculation method. A 14-period RSI on H1 behaves nothing like a 14-period RSI on M5, so match the period to your holding time.
- Style it for readability. Assign distinct colours and line weights. If you can’t tell two indicators apart at a glance, you’ll misread them under pressure.
- Test on historical data before trusting it. Scroll back 200 candles and check whether the signals actually preceded moves, or whether the indicator repainted after the fact.
- Cut anything redundant. Stochastic plus RSI plus CCI is one signal wearing three costumes. Delete two.
That last point deserves expanding.
Indicator overload is a confirmation bias machine.
Add enough tools and at least one will always agree with the trade you already want to take.
Lagging indicators (moving averages, MACD) confirm what price has already done. Leading indicators (oscillators, some volume tools) attempt to anticipate, and they generate more false signals as a direct consequence.
Neither type is better.
They answer different questions.
Watch for repainting, too.
Some third-party custom indicators recalculate historical signals as new data arrives, which makes backtests look brilliant and live trading look nothing like them.
Saving Templates and Workspaces
Once a setup works, lock it in.
Right-click any chart, select Save Template, and give it a name that describes the method rather than the instrument, something like “H1 trend pullback” instead of “EURUSD chart”.
Templates carry your indicator set, parameters, colours, and timeframe. Apply one to a new symbol in two clicks and your analysis stays consistent across instruments.
Workspaces go a level higher.
Each workspace holds a full layout of multiple charts, so you might run one for multi-timeframe analysis on a single pair and another for scanning eight majors at once. cTrader Windows and Mac support unlimited workspaces, and switching between them takes a single tab click.
From Signal to Trade
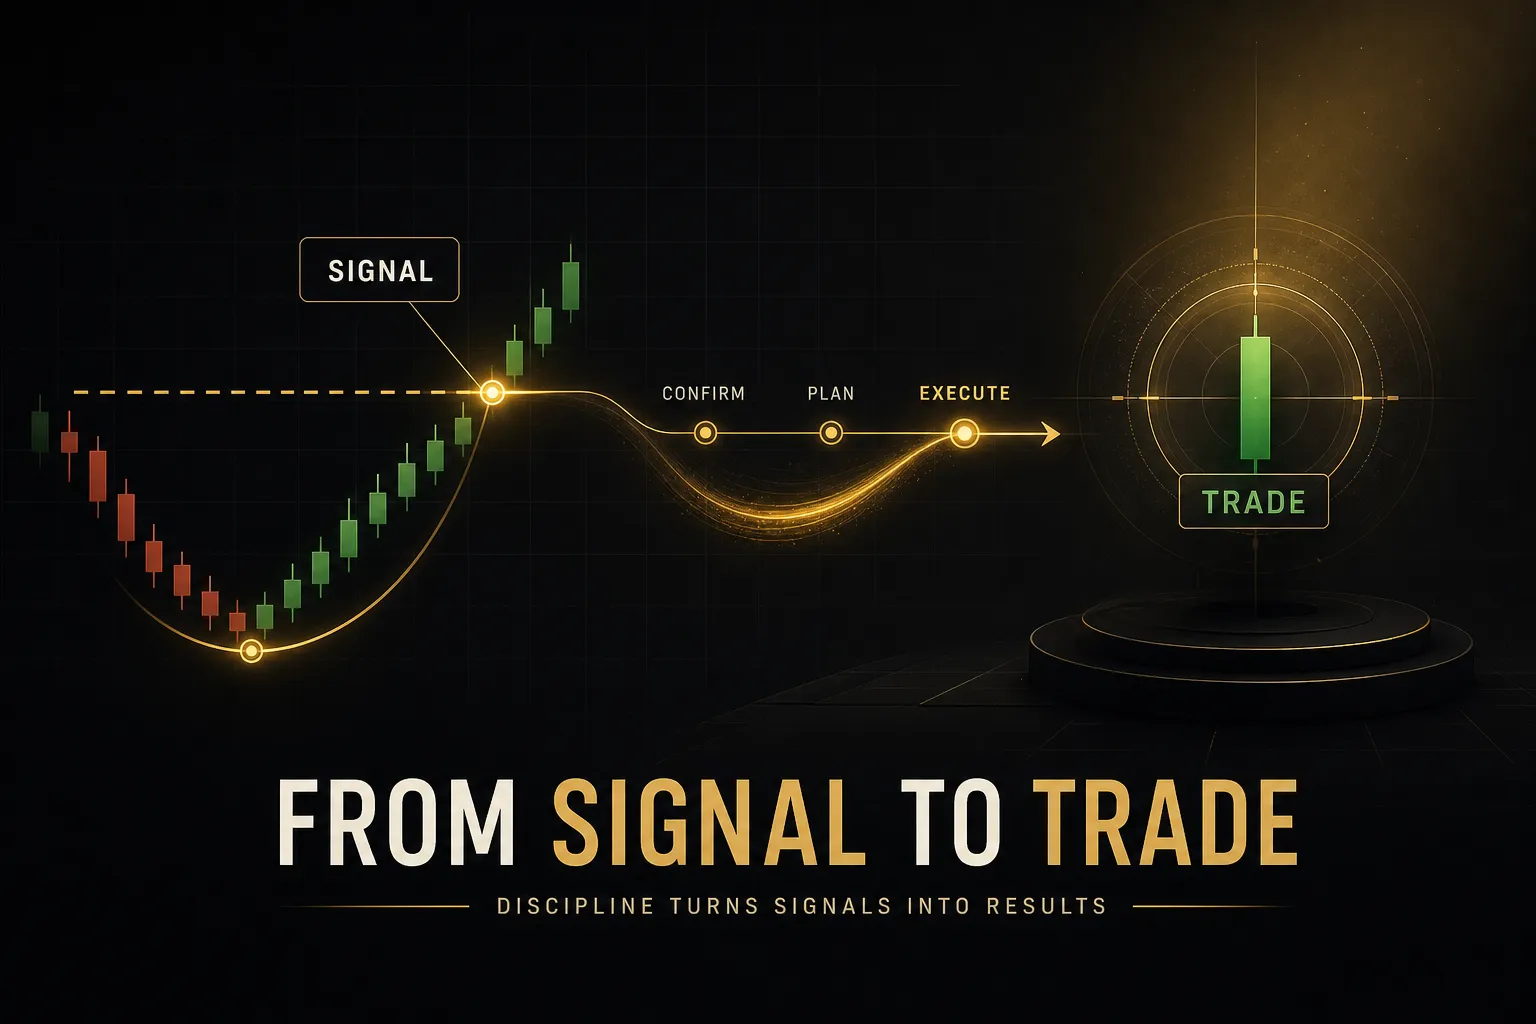
An indicator turning green is not a trade.
It’s a suggestion.
The gap between those two things is where most retail accounts quietly die.
Why Signals Aren’t Strategies
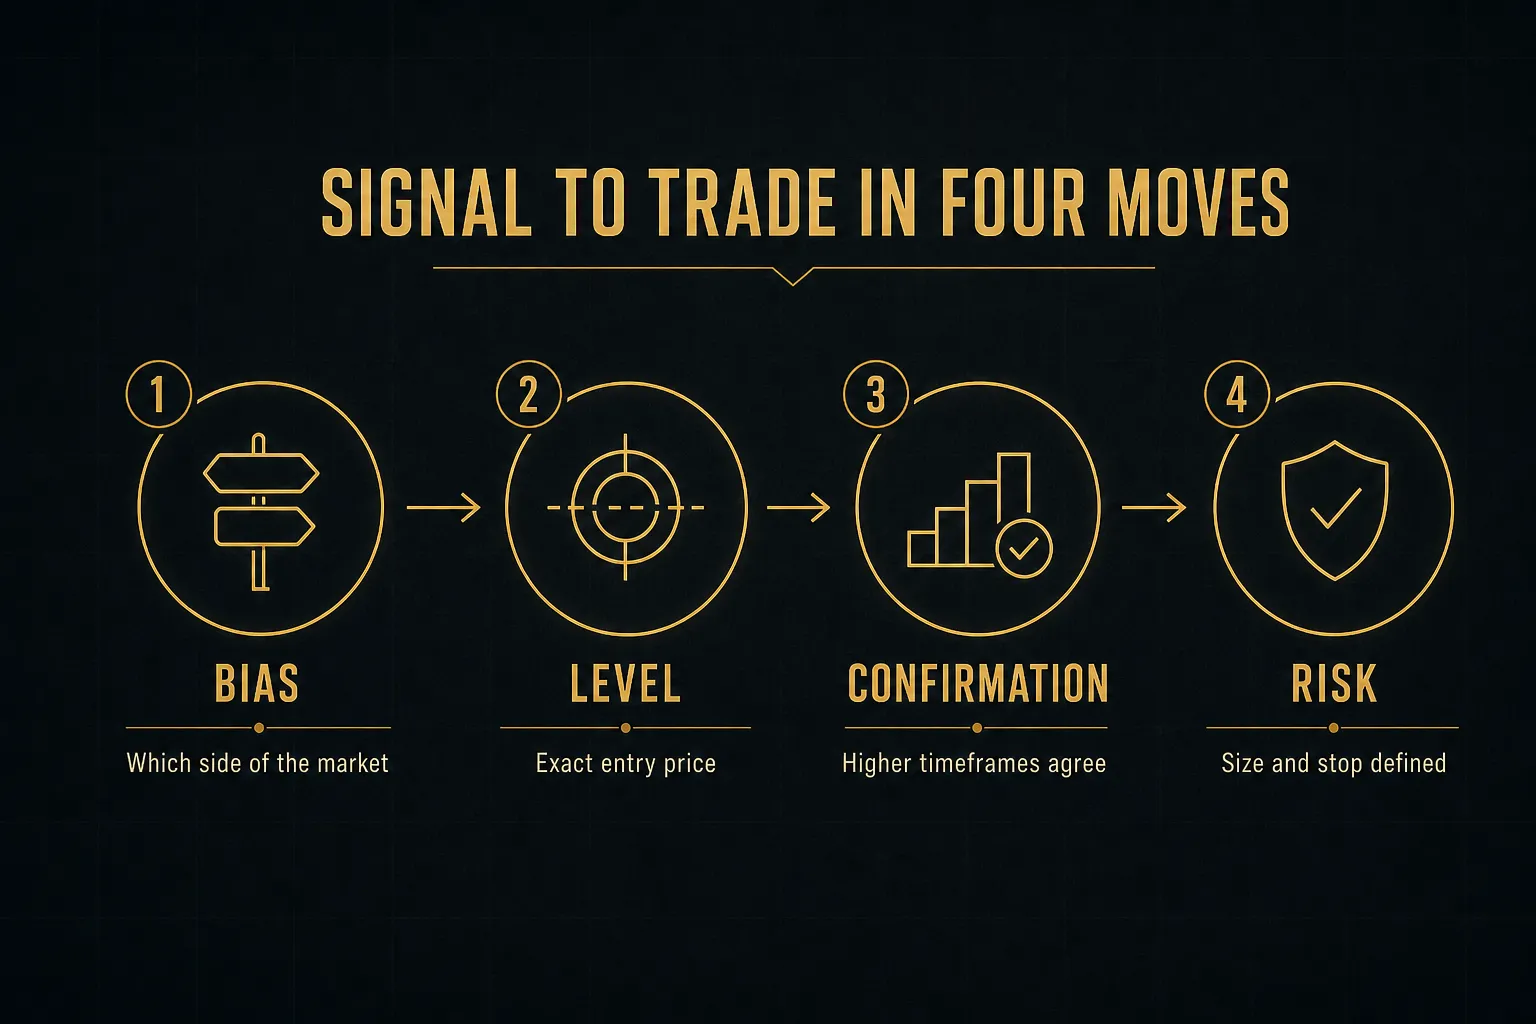
A complete trade needs three components: directional bias, a specific price level, and a defined risk plan. A signal only supplies the first one.
Consider a practical workflow.
A directional tool, say a colour-coded trend indicator like PipTrend that paints candles by trend state, tells you which side of the market to be on.
That’s bias.
Nothing more.
Then you need a precision entry level.
VWAP, a session high, a supply or demand zone, a prior swing point, something with an actual price attached. Bias says “long”, the level says “long at 1.0842, not wherever price happens to be right now”.
Finally, multi-timeframe confirmation decides whether you hold or exit.
If H4 and D1 agree with your M15 signal, position management gets easier. If they conflict, you’re fighting the larger flow and should size down or stand aside.
Setting Stops and Targets
cTrader supports market orders for immediate execution and pending orders (limit, stop, and stop-limit) for entry at a chosen price. Both accept a stop-loss and take-profit attached at the moment of placement.
Use them.
This is the single most important habit on the platform.
Stops and targets placed in the order ticket sit on the broker’s server, which means they execute even if your laptop dies, your internet drops, or cTrader crashes. Locally running tools, some third-party trailing scripts and alert-based exits included, stop protecting the position the second the connection breaks.
In the cTrader order window you can set stop-loss and take-profit in pips, price, or account currency. Pips is fine for consistency; price is better when you’re anchoring to a structural level like a swing low.
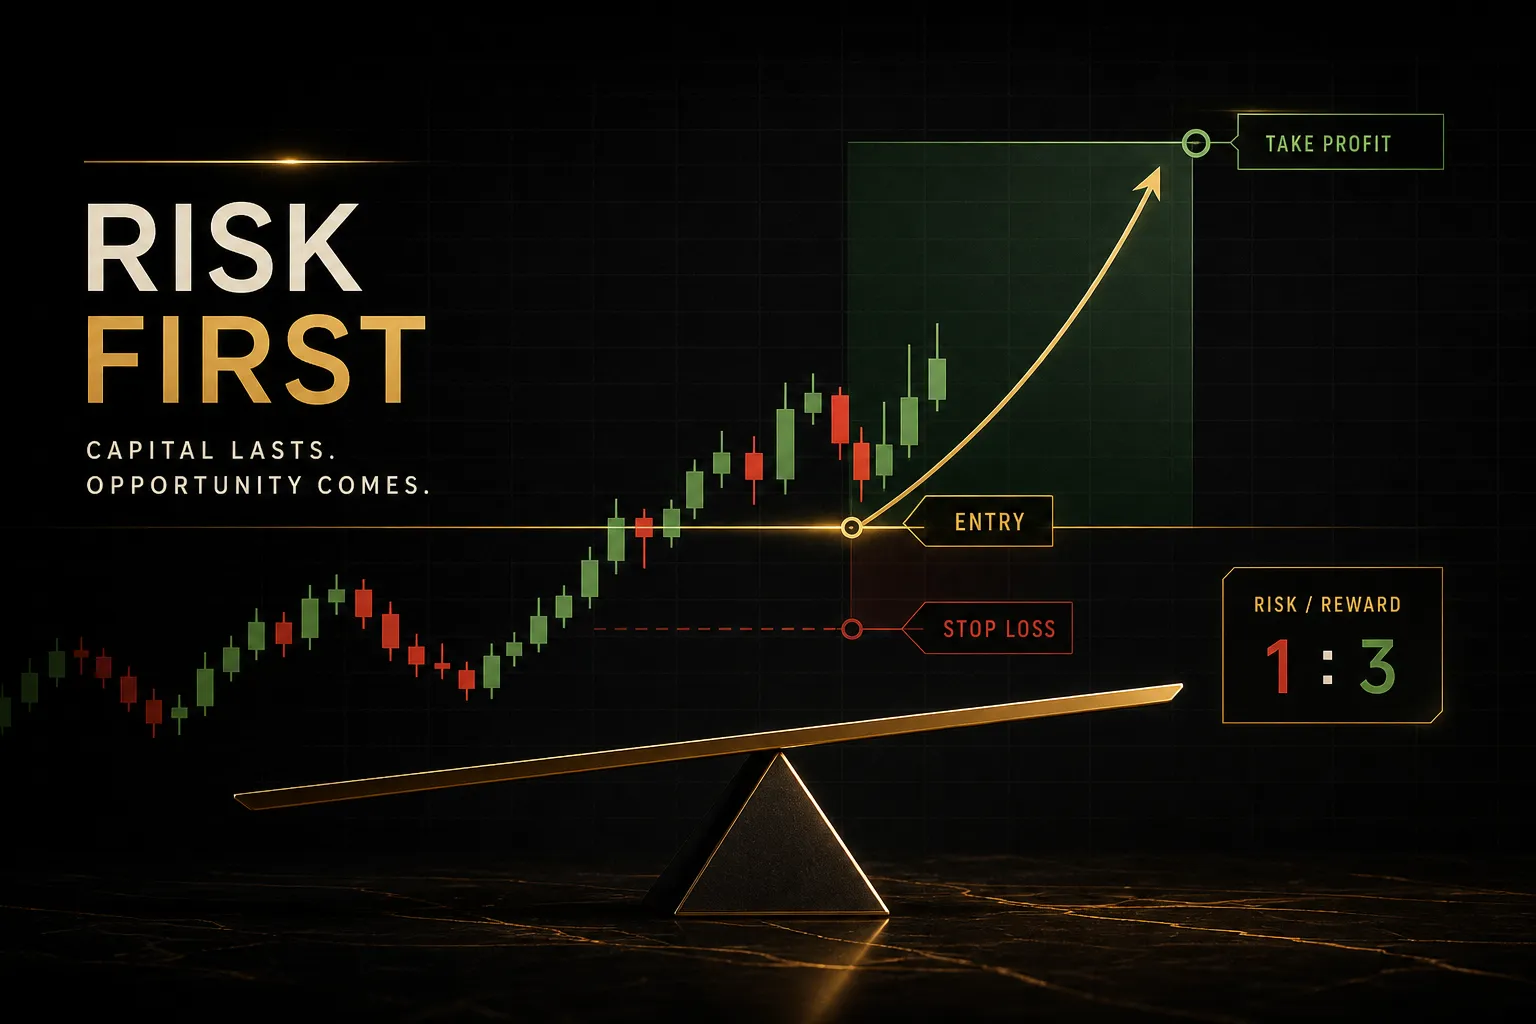
Set your risk-reward ratio before entry, not during.
A 1:2 minimum is a common baseline, meaning a 20-pip stop pairs with a 40-pip target. At 1:2, a 40% win rate still produces positive expectancy over a large sample.
Position Sizing and Risk
Position sizing is arithmetic, not intuition.
The formula that governs it:
Lot size = (Account equity × risk %) ÷ (stop-loss in pips × pip value per lot)
Run it with real numbers.
A $10,000 account risking 1% allows $100 of loss. With a 25-pip stop on EUR/USD, where one standard lot moves roughly $10 per pip, the math gives $100 ÷ (25 × $10) = 0.40 lots.
Four variables can quietly wreck that calculation.
- Spread widens your effective entry, so a 25-pip stop on a 2-pip spread is really a 27-pip risk. Include it.
- Slippage during news events can push fills well past your intended level. cTrader reports actual slippage per execution, so review it in Trade Watch history.
- Leverage determines margin required, not risk. Higher leverage frees up margin; it does not change how much you lose per pip.
- Margin level should stay comfortably above your broker’s stop-out threshold, often 50%. Sizing by risk percentage usually keeps you there automatically.
Log every trade.
A simple trade journal recording entry logic, size, stop distance, result, and screenshot lets you calculate real expectancy and read your equity curve honestly. Without that record, you’re guessing about your own performance.
Automation, cBots, and Copy Trading
Four different tools live inside cTrader, and traders conflate them constantly. Getting the distinction right saves both money and confusion.
Indicators, cBots, and Copy Trading
- Manual indicators analyse and display. They calculate values from price data and draw them on the chart, then stop. An indicator cannot open, modify, or close a position, no matter how sophisticated its logic.
- cBots execute. Written in C# through cTrader Algo, a cBot can place market orders and pending orders, attach stop-loss and take-profit, trail stops, scale in, and close positions according to coded rules. Full C# trading automation, running unattended on cTrader Windows or Mac.
- Plugins extend the platform itself. They add panels, custom order tickets, risk calculators, or session tools to the interface rather than trading on your behalf.
- cTrader Copy mirrors another account. You allocate capital to a strategy provider, and their live positions replicate proportionally into yours, with fees typically taken as a performance share or a volume-based commission.
One more piece worth knowing: cTrader Cloud allows cBots to run on remote infrastructure rather than your own machine, which removes the need to leave a desktop powered on overnight.
Availability varies by broker.
Native Python trading automation is not part of the framework, though traders do bridge Python models to cTrader through its Open API.
Backtesting Reality Check
cTrader Algo includes a backtester and a strategy optimisation engine, and both are genuinely capable. They are also very easy to fool yourself with.
Backtest results depend entirely on the assumptions you feed in.
- Spread modelling. Testing on a fixed 0.5-pip spread when your live account averages 1.4 pips will inflate results dramatically on any high-frequency strategy.
- Commission. Raw-spread accounts charge per lot per side. Omit it and a scalping bot that made $3,000 in testing may lose money live.
- Slippage. The backtester assumes clean fills unless configured otherwise. Real markets during NFP or a central bank release do not cooperate.
- Historical tick quality. Tick data from the broker beats generated M1 data, but even tick data misses genuine liquidity gaps and requotes.
- Overfitting. The optimiser will happily find the exact parameter combination that maximised past profit. That combination is usually curve-fitted noise, not an edge.
- Sample size. Thirty trades tell you almost nothing. Aim for several hundred across multiple market regimes, including at least one trending and one ranging period.
And a point that gets missed: manual indicators are not backtested or optimised the same way at all.
When someone shows you an indicator’s “results”, they’re usually showing a hand-picked chart, not a systematic test with realistic costs.
Evaluating Copy Trading Signals
Copy trading looks like a shortcut.
Sometimes it is.
More often the numbers on the leaderboard hide the risk that produced them.
Before allocating a single dollar, check the following.
- Maximum drawdown, not just return. A provider up 180% with a 62% drawdown took extreme risk. Ask whether you could sit through that decline without withdrawing at the bottom.
- Track record length. Six months in a single trending market proves nothing. Twenty-four months across varied conditions starts to mean something.
- Leverage and exposure. Check average position size relative to equity and whether the provider holds correlated positions, five long EUR pairs is one trade, not five.
- Open-position synchronisation. Understand what happens when you join mid-trade. Some setups copy existing positions at current prices, giving you a worse entry than the provider’s.
- Fee structure. Performance fees, management fees, and volume commissions all compound. A 25% performance fee on a gross 20% return leaves you 15% before spread costs.
- Equity curve shape. Steady progression suggests process. A single vertical spike suggests one lucky oversized trade.
Automation and copying remove decision fatigue.
They do not remove market risk, and they never guarantee returns.
cTrader FAQs
Is cTrader better than MetaTrader?
cTrader is generally better for transparency, charting, and modern interface design, while MetaTrader has a far larger third-party ecosystem. cTrader offers Level II depth of market, detailed slippage reporting, and unlimited chart tabs. MT4 and MT5 have vastly more available indicators and expert advisors.
Choose based on whether you need ecosystem breadth or execution clarity.
Is cTrader free to use?
Yes, cTrader is free for traders.
Spotware licenses the platform to brokers, who absorb the cost. Your actual trading costs come from spreads, commissions, overnight financing, and any copy trading fees, all set by your broker. Downloading cTrader Windows, cTrader Mac, or using cTrader Web costs nothing.
Can I use cTrader on my phone?
Yes, cTrader Mobile is available for both iOS and Android with full order management. You get market orders, pending orders, stop-loss and take-profit editing, position closing, and around 60 built-in technical indicators.
What you don’t get is custom indicators, cBots, or backtesting, which require the desktop versions.
How do I add custom indicators to cTrader?
Custom indicators install through cTrader Algo on Windows or Mac only.
Download the .algo file, then either double-click it to install automatically or place it in the cAlgo Indicators folder inside your Documents directory. Restart the platform, open the Indicators menu, and the custom indicator appears alongside the built-in ones ready to configure.
What is the difference between cTrader and cTrader Algo?
cTrader is the trading terminal for charts and manual execution; cTrader Algo is the integrated development environment for building automation.
Algo is where you write C# code for custom indicators and cBots, compile it, run backtests, and use the strategy optimisation engine. It ships inside the desktop platform as a dedicated tab.
Is cTrader safe and regulated?
cTrader is software, so regulation depends entirely on the broker offering it. Spotware is not a financial firm and holds no client funds. Verify your broker’s licence with the relevant authority, FCA, ASIC, CySEC, or equivalent, and confirm client fund segregation.
The platform name tells you nothing about your money’s safety.
How do I use cTrader for forex trading?
Connect a broker account via your cTrader ID, add currency pairs to Market Watch, open a candlestick chart, then place orders through the Active Symbol Panel or a chart right-click. Attach a server-side stop-loss and take-profit to every entry, size positions by a fixed risk percentage, and track results in Trade Watch history.
Can I automate trades with cTrader?
Yes, through cBots written in C# inside cTrader Algo.
A cBot can open, modify, and close positions automatically based on coded conditions, and it runs on cTrader Windows or Mac. Some brokers also support cTrader Cloud, which hosts your cBot remotely so it keeps running when your computer is off.
How do I backtest a cBot in cTrader?
Open the cBot in cTrader Algo, select the Backtesting tab, then set your symbol, timeframe, date range, starting capital, and data quality. Choose tick data from the broker for accuracy, add realistic commission and spread, and run it.
Review the equity curve, maximum drawdown, and total trade count before trusting any result.
Does cTrader work with TradingView indicators?
No, Pine Script indicators from TradingView cannot run natively in cTrader.
cTrader uses its own cAlgo framework built on C#, which is a completely different language and API. A Pine Script indicator has to be rewritten in C# to work, though the underlying logic usually translates without much difficulty.
Your Next Step With cTrader
Pick your path based on how you actually trade, not on which version has the most features.
Beginners: start on cTrader Web or cTrader Mobile with a demo account. No installation, no C# to learn, and everything you need to practise reading price action and placing risk-defined orders.
Algorithmic traders: you need cTrader Windows or cTrader Mac. cBots, custom indicators, backtesting, and strategy optimisation live exclusively on desktop, and cTrader Cloud is worth asking your broker about if you want unattended execution.
Hands-off traders: read the cTrader Copy terms before funding anything. Drawdown history, fee structure, and open-position synchronisation matter more than the headline return percentage on any leaderboard.
One action for tonight.
Open a demo account, add a single confirmed indicator setup (one trend tool, one confirmation tool, nothing more), save it as a chart template, then place one trade with a server-side stop-loss and a 1:2 risk-reward ratio.
Then write it in a trade journal.
Entry reason, size, stop distance, outcome.
Do that twenty times and you’ll know more about your own process than any course could teach you.
Last thing, and it’s the part people skip.
No signal, cBot, or copied strategy removes your responsibility to verify that your broker is properly regulated and to control your own exposure.
The platform executes.
The risk stays yours.
Risk Disclaimer: Trading involves risk. Past performance doesn't guarantee future results. Only trade with money you can afford to lose. PipTrend is a tool to assist your trading decisions, not financial advice.