
2025 is shaping up to be a year of wild market swings, making every trading edge count more than ever. One timeless tool—often misunderstood but incredibly powerful—is the candle pattern chart.
Candlestick patterns reveal the heartbeat of the market in a single glance. They’re essential for technical analysis, helping traders spot shifts in momentum and market sentiment before the crowd catches on.
In this guide, you’ll learn how to read the anatomy of candlesticks, master single, double, and triple patterns, and apply expert analysis strategies. We’ll highlight common mistakes to avoid and reveal advanced trends for 2025.
Ready to master candle pattern charts and trade with confidence? Read on for actionable insights and expert tips.
Understanding the Anatomy of a Candlestick Chart
Mastering a candle pattern chart begins with understanding the anatomy of each candlestick. Each bar on a chart tells a story—one that reveals not just price movement, but the psychology of buyers and sellers. If you want to interpret trends, reversals, and momentum shifts, a strong grasp of candlestick anatomy is essential.
What Makes Up a Candlestick?
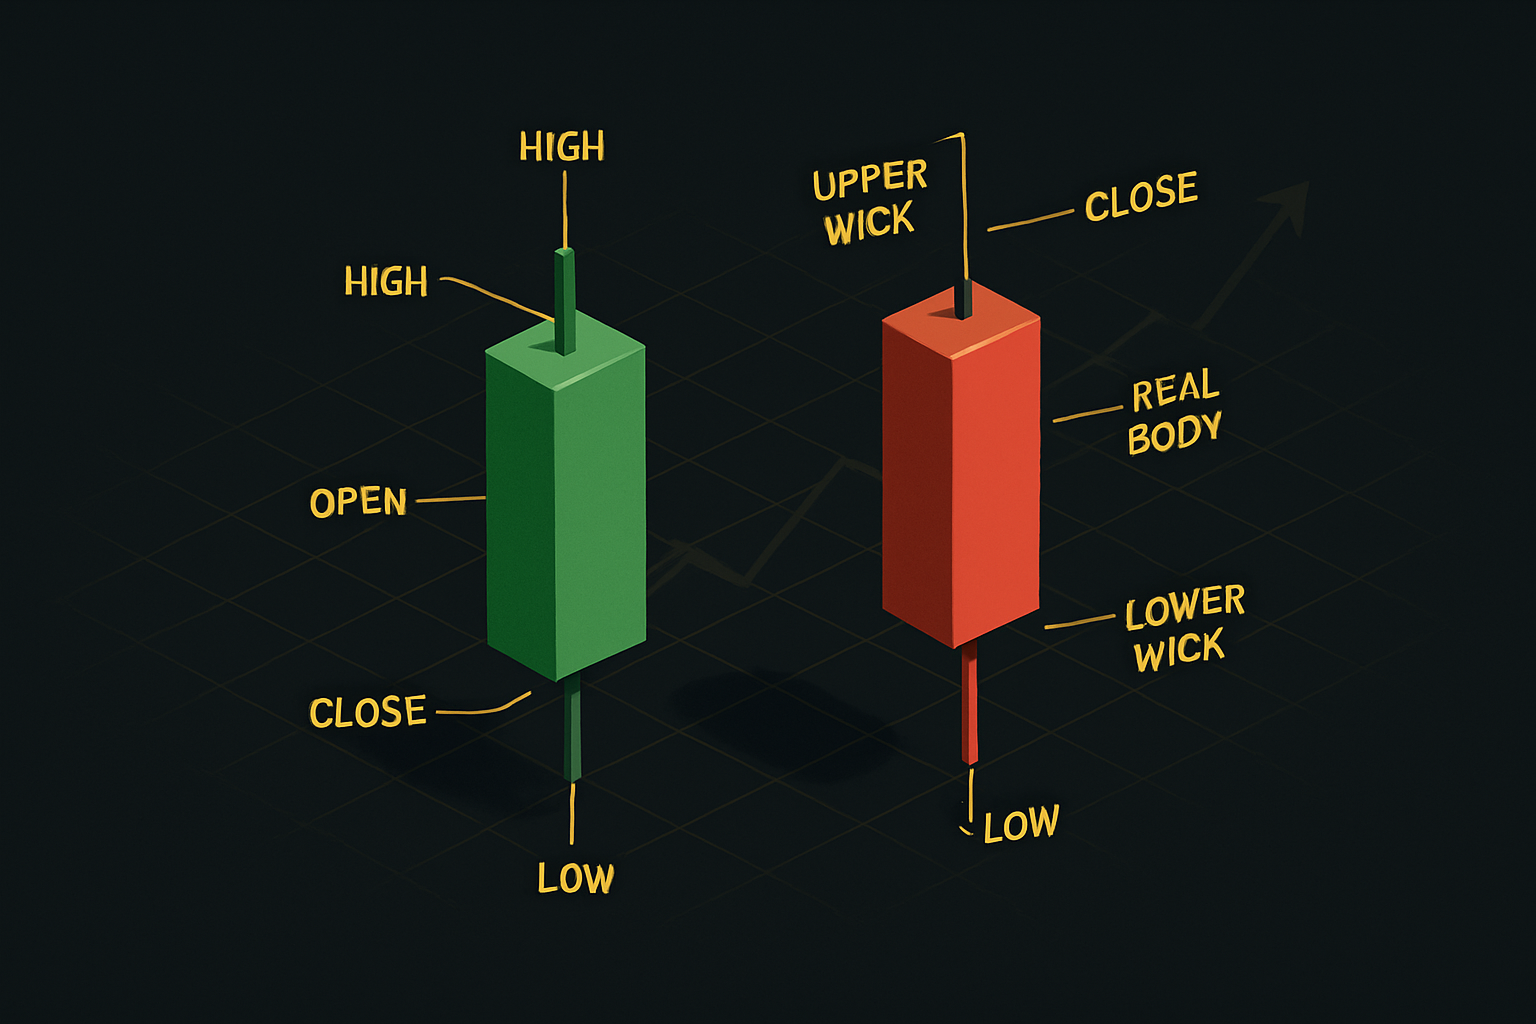
At its core, a candlestick visualizes four critical price points for a given time period:
- Open: Where the price starts
- High: The highest price reached
- Low: The lowest price touched
- Close: Where the price ends
The "real body"—the thick part of the candlestick—shows the range between open and close. If the close is higher than the open, the body is typically green or white, signaling bullish momentum. If the close is lower, it’s red or black, marking bearish sentiment.
Above and below the real body are the "wicks" or "shadows." The upper wick marks how far buyers pushed the price upward, while the lower wick shows how low sellers drove it. Wick length can signal market rejection (long wicks) or acceptance (short wicks).
For a closer look at how these components form powerful reversal signals, check out this Hammer Candlestick Pattern Guide, which breaks down one of the most recognizable single-bar formations.
Bullish vs. Bearish: Color and Meaning
Colors matter in a candle pattern chart. A bullish candle (green or white) means buyers won the battle—closing price is above the opening. A bearish candle (red or black) means sellers dominated.
But it’s not just about color. The shape of the real body and the length of the wicks add nuance. A long bullish real body with little to no wick shows strong buying pressure. In contrast, a candle with a small body and long wicks (like a doji or spinning top) points to indecision.
A quick comparison:
| Candle Type | Color | Sentiment | Typical Signal |
|---|---|---|---|
| Bullish | Green/White | Buyers in control | Potential uptrend, reversal |
| Bearish | Red/Black | Sellers in control | Downtrend, possible reversal |
Understanding these differences helps you spot subtle shifts in market psychology on a candle pattern chart.
The Importance of Context in a Candle Pattern Chart
No candlestick exists in isolation. Its true meaning comes from its placement within the broader trend. A bullish candle after a long downtrend might signal a reversal, while the same candle during an uptrend could simply confirm existing momentum.
Many beginners make the mistake of reading each candlestick as a standalone signal. Here are some common misconceptions:
- Believing every long wick signals a reversal
- Ignoring the trend direction when analyzing patterns
- Assuming color alone tells the whole story
Always consider the surrounding candles and the prevailing trend. Context transforms basic candle shapes into powerful tools for reading a candle pattern chart. By layering this understanding, you’re better equipped to navigate market volatility and spot actionable trade opportunities.
Double and Triple Candlestick Patterns: Spotting Market Turning Points
Spotting market reversals or continuations is a core skill in trading—and mastering double and triple candlestick patterns is a game-changer when reading any candle pattern chart. These multi-bar formations often signal pivotal turning points, giving traders a crucial edge in fast-moving 2025 markets.
Double and triple candlestick patterns are combinations of two or three individual candles that, when appearing together, reveal shifts in market sentiment. Unlike single bars, these patterns provide richer context and greater confidence, especially when the broader trend is unclear. Understanding their structure and psychology is essential for every trader aiming to interpret the candle pattern chart with precision.
Double Candlestick Patterns: Key Signals
Double candlestick patterns are the backbone of the candle pattern chart for identifying rapid shifts in momentum. Here are some of the most important:
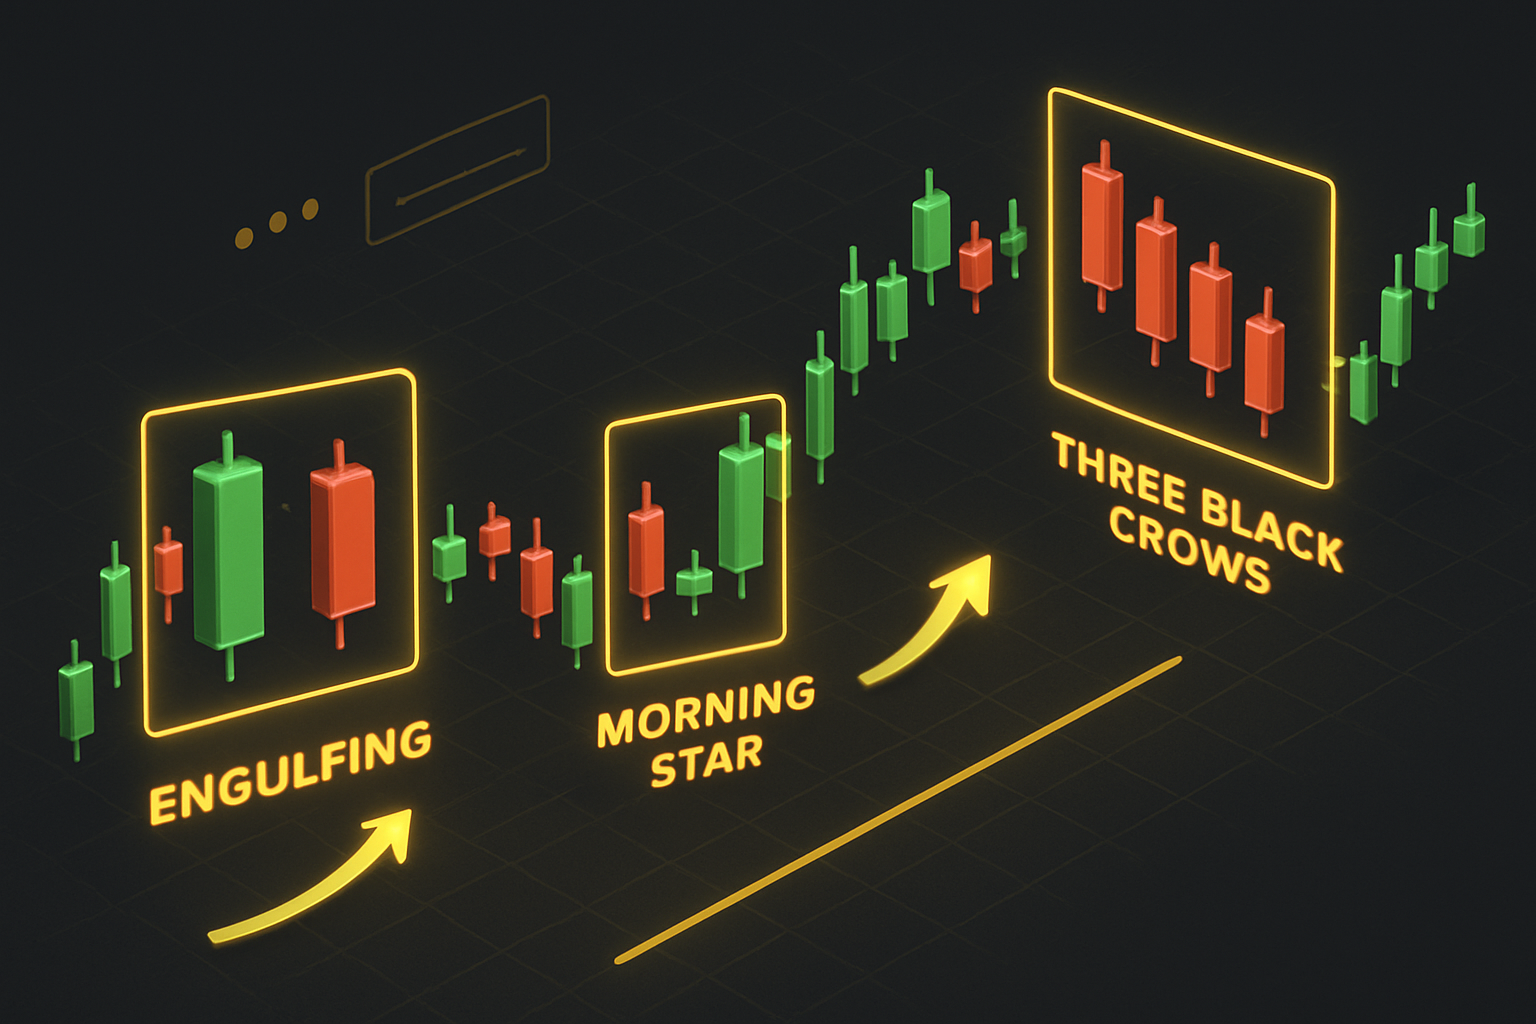
- Engulfing Pattern (Bullish/Bearish): The second candle completely engulfs the body of the first, signaling a strong reversal. A bullish engulfing after a downtrend can mark the start of an uptrend, while a bearish engulfing after a rally often warns of a pullback.
- Harami (Bullish/Bearish): A small candle contained within the prior candle’s body. This pattern suggests indecision and potential reversal, but confirmation is key.
- Tweezer Tops and Bottoms: Two candles with matching highs or lows, often seen at major support or resistance. They hint at exhausted trends and possible reversals.
- Piercing Line & Dark Cloud Cover: These patterns show a battle between buyers and sellers at the end of a trend. The piercing line is bullish, while dark cloud cover is bearish.
When analyzing a candle pattern chart, always look for these double patterns at key levels—they’re most powerful when they confirm existing support or resistance.
Triple Candlestick Patterns: Stronger Reversal Clues
Triple candlestick patterns offer even more insight on the candle pattern chart, as they require three consecutive candles to form a reliable signal. The most impactful include:
- Morning Star: A bullish reversal pattern featuring a long bearish candle, a small-bodied candle (the “star”), and then a strong bullish candle. This trio suggests the bears are losing steam and bulls are taking over, especially near support.
- Evening Star: The bearish counterpart, signaling a top or reversal after an uptrend.
- Three White Soldiers: Three consecutive long bullish candles, each opening within the previous body and closing higher. This pattern is a clear sign of persistent buying power.
- Three Black Crows: Three long bearish candles, indicating sustained selling pressure and often marking the start of a downtrend.
Let’s summarize the key differences:
| Pattern Type | Number of Candles | Common Examples | Typical Signal |
|---|---|---|---|
| Double | 2 | Engulfing, Harami, Tweezer Tops/Bottoms, Piercing Line, Dark Cloud Cover | Reversal/Continuation |
| Triple | 3 | Morning Star, Evening Star, Three White Soldiers, Three Black Crows | Strong Reversal |
Pattern Formation and Confirmation
For any candle pattern chart, context is everything. Double and triple candlestick patterns are most reliable when they appear after prolonged trends or at major support/resistance zones. Volume spikes and confirmation from other indicators—like moving averages or RSI—further boost their reliability.
Example: After a steep downtrend, a bullish engulfing pattern on the candle pattern chart, confirmed by rising volume, can provide a high-probability buy signal. Likewise, a Morning Star at a well-tested support level, especially when paired with bullish momentum, is a classic setup for trend reversal.
Bearish patterns deserve special attention. For more on these, see Bearish Candle Patterns Explained, which covers their formation and how to spot them on your candle pattern chart.
Avoiding Common Misreads
Even experienced traders can misinterpret double and triple patterns on a candle pattern chart. Here are some pitfalls to watch for:
- Mistaking a Harami for a reversal before confirmation.
- Ignoring the broader trend—patterns in choppy or sideways markets are less reliable.
- Overlooking volume: weak volume can make even textbook patterns fail.
- Failing to wait for the pattern to fully form before entering a trade.
Always remember, no pattern is foolproof. Use each candle pattern chart as a guide, but combine it with other analysis for best results.
How to Use Candle Pattern Charts for Real-Time Trading Decisions
Mastering the candle pattern chart is a game-changer for active traders in 2025. Let’s break down how you can leverage these charts for smarter, real-time trading decisions—step by step.

Getting Started with Candle Pattern Chart Integration
The first step is understanding how to incorporate a candle pattern chart into your daily trading workflow. Begin by selecting a reliable charting platform that offers clear candlestick visuals and the ability to annotate or highlight patterns.
Familiarize yourself with the basic elements—real body, wicks, and color coding—so you can quickly identify bullish and bearish signals. Make it a habit to review each session’s chart, noting emerging patterns and their position within the broader price trend.
A candle pattern chart isn’t just about spotting shapes; it’s about translating those shapes into actionable signals. Consistency and repetition help you spot subtle shifts in market sentiment.
Analyzing Patterns in Market Contexts
Not all patterns are created equal. The context in which a candle pattern chart signal appears matters as much as the pattern itself. Ask yourself: Is the market trending, ranging, or breaking out?
- Trending markets: Look for reversal patterns at the end of strong moves.
- Ranging markets: Focus on signals near established support and resistance.
- Breakouts: Confirm with volume and continuation patterns.
By understanding the environment, you avoid reacting to “false friends”—patterns that look significant but lack supporting context. Always combine your analysis with broader market cues.
Timeframe Selection and Confirmation Tools
Choosing the right timeframe is essential when working with a candle pattern chart. Daily charts provide solid signals, but intraday and weekly charts can reveal different perspectives or confirm trends.
Layer your analysis: If you spot a Bullish Engulfing pattern on the 1-hour chart, check if the daily candle pattern chart supports the move. Use confirmation indicators like moving averages, RSI, or MACD to add confidence to your trade ideas.
The goal is to stack probabilities in your favor, not rely on a single candle for decision-making.
Building a Pattern Checklist and Risk Management
A structured approach is vital. Create a repeatable checklist to validate signals from your candle pattern chart before taking action. Here’s a simple example:
| Step | Checklist Item | Complete? |
|---|---|---|
| Context | Pattern aligns with trend/structure | ☐ |
| Confirmation | Supported by RSI/MACD/volume | ☐ |
| Entry/Exit | Defined stop-loss and target | ☐ |
| Risk | Position size calculated | ☐ |
Risk management is just as important as pattern recognition. Set stops just below/above the pattern’s low/high, and define profit targets before entering the trade. This discipline protects you from emotional decisions.
For more detailed strategies, explore Trading Chart Pattern Strategies to see how experts integrate these methods into their trading plans.
Case Study: Real-Time Trade Example
Imagine you spot a Bullish Engulfing on your candle pattern chart after a prolonged downtrend. RSI shows a bullish divergence, and price sits at a major support level.
You:
- Check the pattern against your checklist
- Confirm with volume and RSI
- Set a stop just below the engulfing candle
- Define your target at the next resistance
This methodical approach, using a candle pattern chart alongside technical confirmation, increases your odds of a successful trade. According to ChartSchool’s historical data, trades with multi-factor confirmation have notably higher success rates than those based on patterns alone.
Incorporate this process into your daily routine, and your candle pattern chart will become a powerful ally for real-time trading decisions.
Advanced Candle Pattern Strategies and Expert Tips for 2025
Mastering the candle pattern chart is more than just memorizing shapes—it's about evolving with the market. As 2025 ushers in rapid algorithmic trading and global volatility, traders must adapt old wisdom and embrace new tools. Let’s break down the advanced strategies and expert insights that will keep you ahead.

Adapting Classic Patterns for Algorithmic and High-Frequency Trading
Traditional candlestick wisdom faces new challenges in the high-speed world of 2025. Algorithms now scan every candle pattern chart in milliseconds, seeking micro-opportunities. Classic patterns like Engulfing or Doji still work—but their effectiveness depends on speed and context.
If you’re building or using trading bots, program them to recognize not only the shape but also the market environment. For example, a Harami in a low-liquidity window could trigger false trades. Research like Stock Price Prediction Using Candlestick Patterns and Sparrow Search Algorithm shows that combining traditional patterns with AI-based algorithms can enhance prediction accuracy, especially when backtested on recent data.
Emerging Patterns and Hybrid Formations Seen in 2025 Markets
Markets evolve, and so do patterns. In 2025, hybrid formations—combinations of classic patterns with volume or volatility filters—have become more common on the candle pattern chart. For instance, a Three Line Strike with a significant volume spike might indicate a stronger reversal than the pattern alone.
Traders now watch for new setups blending wicks, bodies, and time-based triggers. Documenting these emerging hybrids in your trading journal helps spot recurring themes that algorithms might miss. Staying agile means updating your candle pattern chart cheat sheet as new setups appear.
Multi-Timeframe Pattern Stacking: Aligning Daily, 4H, and 1H Charts
Pattern stacking is a powerful strategy. By confirming a signal across multiple timeframes, you boost your trade's probability. Imagine spotting a Bullish Engulfing on the daily candle pattern chart, a Hammer on the 4H, and RSI divergence on the 1H—this alignment often precedes strong moves.
Here’s a quick checklist:
- Identify primary trend (daily chart)
- Spot supporting pattern (4H or 1H)
- Confirm with secondary indicator (RSI, MACD)
- Set entry/exit based on confluence
Stacking patterns this way helps filter out noise and reduces false entries.
Using Candle Pattern Charts Across Crypto, Forex, Stocks, and Indices
Not all markets speak the same candlestick language. Crypto markets, for example, often display more volatility and shorter-lived patterns than forex or traditional stocks. On your candle pattern chart, a Marubozu in forex might signal a decisive trend, while in crypto, it could simply be a blip in a choppy session.
Indices tend to respect support/resistance levels, making double and triple patterns more reliable. Always tailor your pattern recognition to the asset class. Segment your cheat sheet by market for quick reference.
| Asset Class | Pattern Duration | Reliability | Common Pitfall |
|---|---|---|---|
| Crypto | Short | Moderate | Overreacting to wicks |
| Forex | Moderate | High | Ignoring news events |
| Stocks | Moderate-Long | High | Low liquidity traps |
| Indices | Long | High | Premature entries |
Integrating Volume Profile and Liquidity Zones for Higher-Probability Setups
Volume is the heartbeat of any candle pattern chart. Pairing patterns with volume profile and liquidity zones gives an edge. For example, a Three White Soldiers pattern breaking through a high-volume node suggests institutional buying—not just retail excitement.
Identify liquidity zones using heatmaps or order book data. When a pattern forms at these levels, your confidence should rise. Combine this with confirmation from moving averages or momentum indicators for robust entries.
The Importance of Journaling and Backtesting Pattern Trades
Every advanced trader keeps a log. By journaling each candle pattern chart setup—entry, exit, result, and context—you’ll quickly learn what works. Backtesting patterns using historical charts or platforms with replay features uncovers hidden strengths and weaknesses.
For even faster reference, use downloadable cheat sheets like those from Chart Guys. Annotate them with your own results and market observations. This habit transforms knowledge into edge.
Data-Driven Success: How Effective Are Pattern-Based Trades?
The big question: do candle pattern chart strategies actually work in 2025? Data says yes—if you use them with discipline. According to 40 Years of Candlestick Pattern Success Rates, certain patterns like Bullish Engulfing and Morning Star have consistently outperformed random chance, especially when paired with volume confirmation and context analysis.
But remember: no pattern is foolproof. Use statistics as a guide, not a guarantee. Update your strategy as new performance data emerges.
Advanced Confirmation: Order Flow and Market Depth
Smart traders blend classic candle pattern chart analysis with modern order flow and market depth tools. Watching real-time order books, you can see if large buyers or sellers are reinforcing a pattern’s signal.
For example, if a Bearish Engulfing forms at resistance and sell orders flood the book, the odds of a reversal skyrocket. Use these advanced confirmations sparingly, focusing on high-probability setups. This holistic approach turns patterns into powerful decision tools.
Building Your Personalized Candle Pattern Chart Guide
Creating your own candle pattern chart guide is a game changer for traders aiming to master the markets in 2025. A personalized reference not only sharpens recognition skills but also gives you an edge in adapting to new trends and asset classes.
Step 1: Build Your Candle Pattern Chart Cheat Sheet
Start by assembling a cheat sheet inspired by trusted resources like Chart Guys. This cheat sheet should visually break down key candlestick patterns—single, double, and triple formations—so you can reference them instantly during live trading.
- List major reversal, continuation, and neutral patterns.
- Include a sample diagram for each, showing real body, wicks, and color coding.
- Note the ideal market context for each pattern (e.g., downtrend, consolidation).
A well-organized candle pattern chart cheat sheet acts as your visual compass. Keep it digital for easy updates or print it as a poster for quick desk reference.
| Pattern Type | Example Patterns | Typical Context | Visual Cue |
|---|---|---|---|
| Reversal | Hammer, Engulfing, Morning Star | Trend exhaustion | Long wick, strong body |
| Continuation | Marubozu, Three White Soldiers | Ongoing trend | Full body, no wick |
| Neutral | Doji, Spinning Top | Indecision zones | Small body, equal wicks |
Step 2: Organize Patterns by Market Context and Asset Class
To maximize the value of your candle pattern chart, segment patterns by how and where they appear. Patterns often behave differently in stocks, crypto, and forex due to unique volatility and liquidity.
- Create sections for each asset class—stocks, crypto, forex.
- Group patterns by function: reversal, continuation, or neutral.
- Use colored tabs or digital filters to quickly switch between sections.
For example, a bullish engulfing might signal a stronger reversal in forex than in a thinly traded stock. Document these nuances in your guide for fast, context-aware decisions.
Step 3: Visual Learning—Color Coding, Annotation, and Journaling
A great candle pattern chart guide doesn’t just list patterns—it makes them memorable. Use color coding: green for bullish, red for bearish, yellow for neutral. Annotate your cheat sheet with notes on reliability, typical volume spikes, or common traps.
- Highlight high-probability setups with stars or icons.
- Add quick tips beside each pattern, such as “confirm with RSI” or “avoid in choppy markets.”
- Maintain a pattern journal: after each trade, snap a screenshot, jot down your reasoning, and track the outcome.
This visual, hands-on approach cements pattern recognition far more effectively than rote memorization.
Step 4: Leverage Interactive Tools and Pattern Filters
Modern trading platforms offer tools to help you study and apply your candle pattern chart efficiently. Use interactive filters to search for specific setups, or try software that overlays pattern names directly onto your charts.
- Combine your manual guide with platform scanners for real-time insights.
- Update your chart as you discover new hybrid or AI-identified patterns.
- Backtest your favorite patterns using historical data to validate their effectiveness.
Step 5: Track, Review, and Continuously Improve
Your candle pattern chart guide should evolve as you do. Regularly review your trades—what worked, what didn’t, and why. Adapt your guide to reflect new discoveries, emerging market trends, or shifts in pattern reliability.
For deeper study, explore advanced research like Enhancing Market Trend Prediction Using Convolutional Neural Networks on Japanese Candlestick Patterns, which highlights how AI and deep learning are shaping the future of candle pattern analysis.
Resources for Ongoing Mastery
- Top books: “Japanese Candlestick Charting Techniques” by Steve Nison.
- Online communities: Chart Guys, TradingView, Reddit’s r/technicalanalysis.
- Courses: ChartSchool, Udemy’s candlestick pattern modules.
- Stay updated by revisiting your candle pattern chart guide as new strategies and tech emerge in 2025.
With a dynamic, personalized candle pattern chart guide, you’ll transform raw market data into actionable insights and set yourself up for consistent trading success.
Now that you’ve got a solid handle on candle pattern charts and the expert tips for 2025, it’s time to put your knowledge into action. Trading in today’s markets doesn’t have to be overwhelming—especially when you combine your understanding of candlestick patterns with the clarity and confidence that AI-powered tools provide. If you’re ready to simplify your trading routine and spot high-probability setups across forex, crypto, stocks, and indices, why not take the next step? See Your Trading Improve With PipTrend and discover how smarter signals and instant alerts can help you trade with more confidence every day.