Forex Trading for Beginners: A Risk-First Roadmap
On this page
Why Most Beginner Guides Get This Wrong
Most forex guides for beginners follow the same tired script: a glossary of terms, a candlestick pattern chart, and then a pitch for a strategy that supposedly prints money.
You finish reading and still have no idea how to size a single trade.
This guide does the opposite.
Every concept here connects to a decision you’ll actually make: reading a quote, calculating how many units to buy, and deciding where the stop-loss order goes before you click.
Let’s address the elephant first.
Forex trading is not passive income.
It’s a skill with genuine financial risk, and regulatory disclosures from major brokers consistently show that 70-80% of retail trading accounts lose money. That number has stayed remarkably stable for over a decade.
That doesn’t mean it’s rigged.
It means most people arrive with a strategy and no risk framework, which is like buying a race car before learning to brake.
The traders who survive their first year aren’t the ones with the best entries. They’re the ones whose worst month was survivable.
So the order here is deliberate.
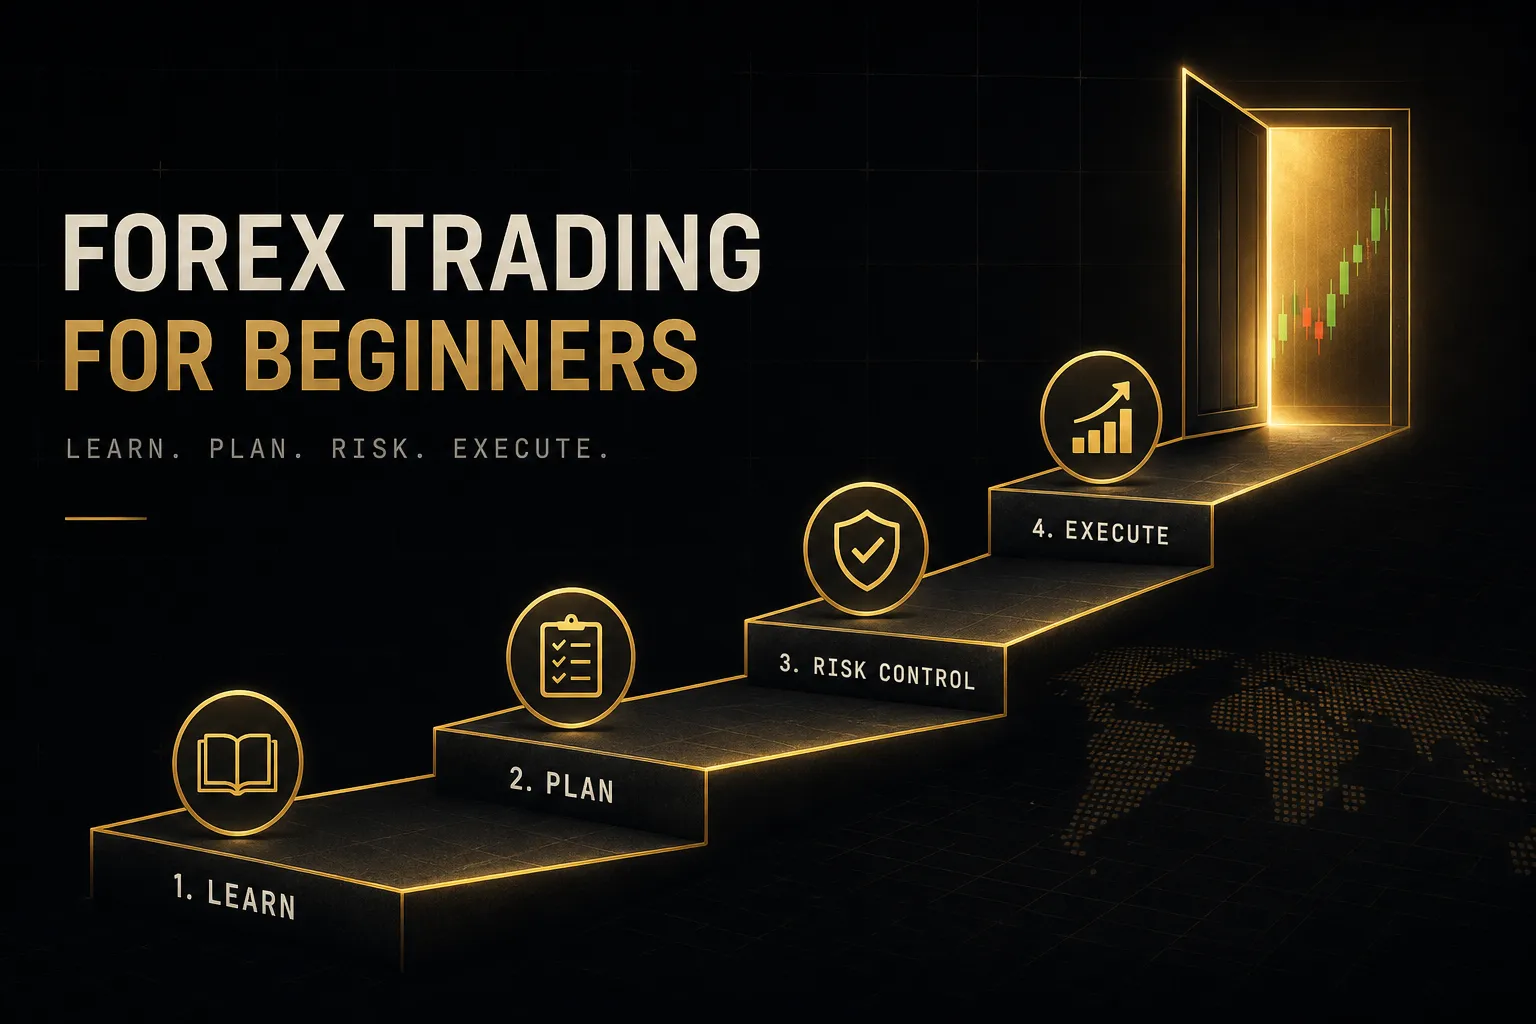
First, how the foreign exchange market actually functions and who you’re trading against. Second, the arithmetic that turns a price quote into a position size and a maximum dollar loss. Third, how to set up safely: capital, demo trading, and broker verification.
Then we cover building an approach that fits a beginner’s schedule and attention span.
And finally, the mistakes and scam patterns that separate people from their deposits before they ever learn anything.
No promises about returns.
Just the mechanics, the math, and the guardrails.
How Forex Trading Actually Works
There is no New York Stock Exchange for currencies.
When you buy EUR/USD through a retail broker, you are not sending an order to a central exchange where thousands of participants meet.
The foreign exchange market is decentralized and over-the-counter (OTC), a network of banks, institutions, brokers, and traders transacting bilaterally. Roughly $7.5 trillion changes hands daily according to Bank for International Settlements survey data, but almost none of it passes through a single venue.
For retail traders, this matters in a specific way.
Your broker is often the counterparty to your trade, either taking the other side directly (a dealing-desk or market-maker model) or passing your order to liquidity providers (an STP or ECN model).
Different models create different incentives, which is why broker selection isn’t a footnote.
What Makes Currency Prices Move
Currencies are always quoted in pairs, because buying one means selling another.
In EUR/USD at 1.0850, the euro is the base currency and the US dollar is the quote currency.
That number means one euro costs 1.0850 dollars.
Buy at 1.0850 and sell at 1.0900, and you captured 50 points of movement. Buy at 1.0850 and the price drops to 1.0800, and you lost 50 points.
Simple direction, unforgiving arithmetic.
What pushes those numbers around?
Central-bank interest rates dominate.
When the Federal Reserve raises rates and the European Central Bank holds, capital tends to flow toward dollar-denominated assets, strengthening USD against EUR.
Beyond rates, price responds to inflation prints, employment data, GDP releases, trade balances, and political risk.
Currency strength is always relative, never absolute.
A “strong dollar” only means strong against something.
Pips, Lots, Spreads, and Leverage
Four terms carry most of the weight in forex.
Get these wrong and everything downstream breaks.
A pip is the standard unit of price movement, the fourth decimal place for most pairs.
EUR/USD moving from 1.0850 to 1.0851 is one pip. For JPY pairs, it’s the second decimal: USD/JPY from 151.20 to 151.21.
Many brokers also quote a fifth decimal called a pipette, which is one tenth of a pip.
A lot is trade size.
A standard lot is 100,000 units of the base currency, a mini lot is 10,000, and a micro lot is 1,000. On EUR/USD, one pip is worth roughly $10 on a standard lot, $1 on a mini lot, and $0.10 on a micro lot.
The spread is the gap between the bid price (what you can sell at) and the ask price (what you can buy at).
If EUR/USD shows 1.08500 bid and 1.08512 ask, the spread is 1.2 pips.
That’s your entry cost, paid instantly.
Some brokers charge a tighter spread plus a separate commission instead.
Leverage lets you control a position larger than your deposit.
At a 30:1 leverage ratio, $1,000 of margin controls $30,000 of currency. The margin requirement is the collateral your broker locks up to hold that position.
Leverage is neutral in itself.
It amplifies whatever your position does, in both directions, and that asymmetry is where beginners get hurt.
The Math From Quote to Position Size
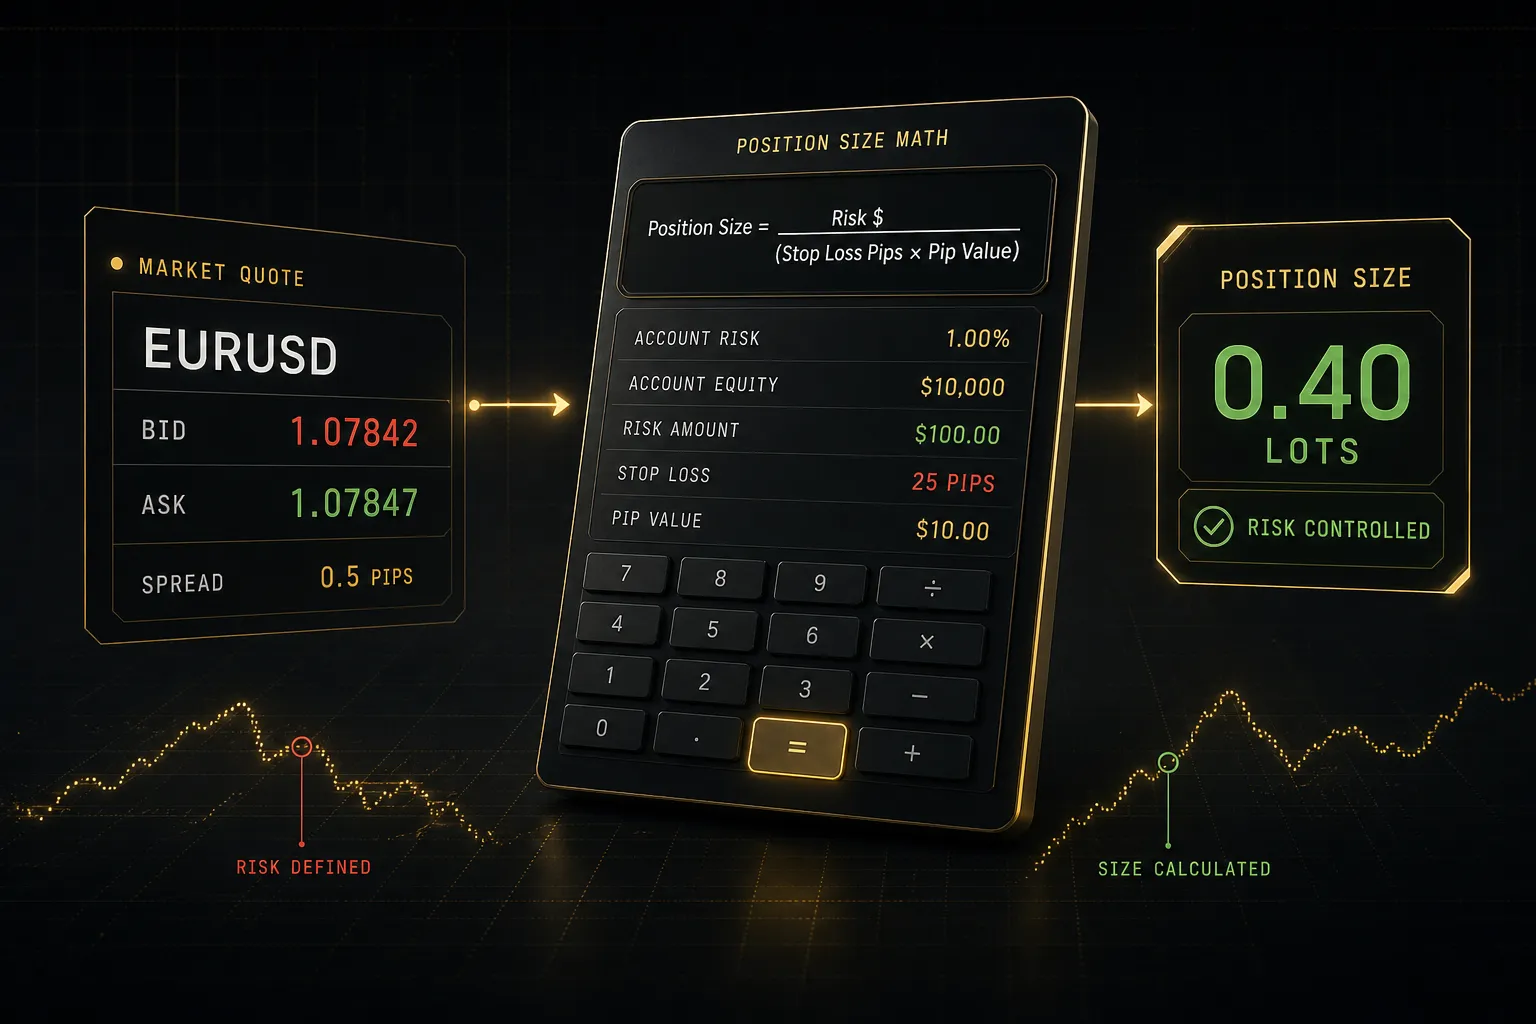
Here’s the single most valuable skill in this entire article: converting a chart idea into a specific number of lots with a known maximum loss.
Most losing traders skip this step entirely and pick a lot size that “feels right.”
A Worked Trade Example
Assume a $5,000 account.
You decide to risk 1% per trade, which is $50. You want to buy EUR/USD at 1.0850 with a stop-loss order at 1.0820, giving a stop distance of 30 pips.
The position sizing formula is straightforward:
Position size = risk amount ÷ (stop distance in pips × pip value per lot)
Using mini lots, where one pip is worth $1: $50 ÷ (30 × $1) = 1.67 mini lots.
Round down to 1.6 mini lots, or 16,000 units.
Your pip value is now $1.60, and a 30-pip loss costs $48.
Now add costs.
With a 1.2-pip spread, you pay about $1.92 on entry. Your realistic worst case is roughly $50, exactly the number you decided on before opening the trade.
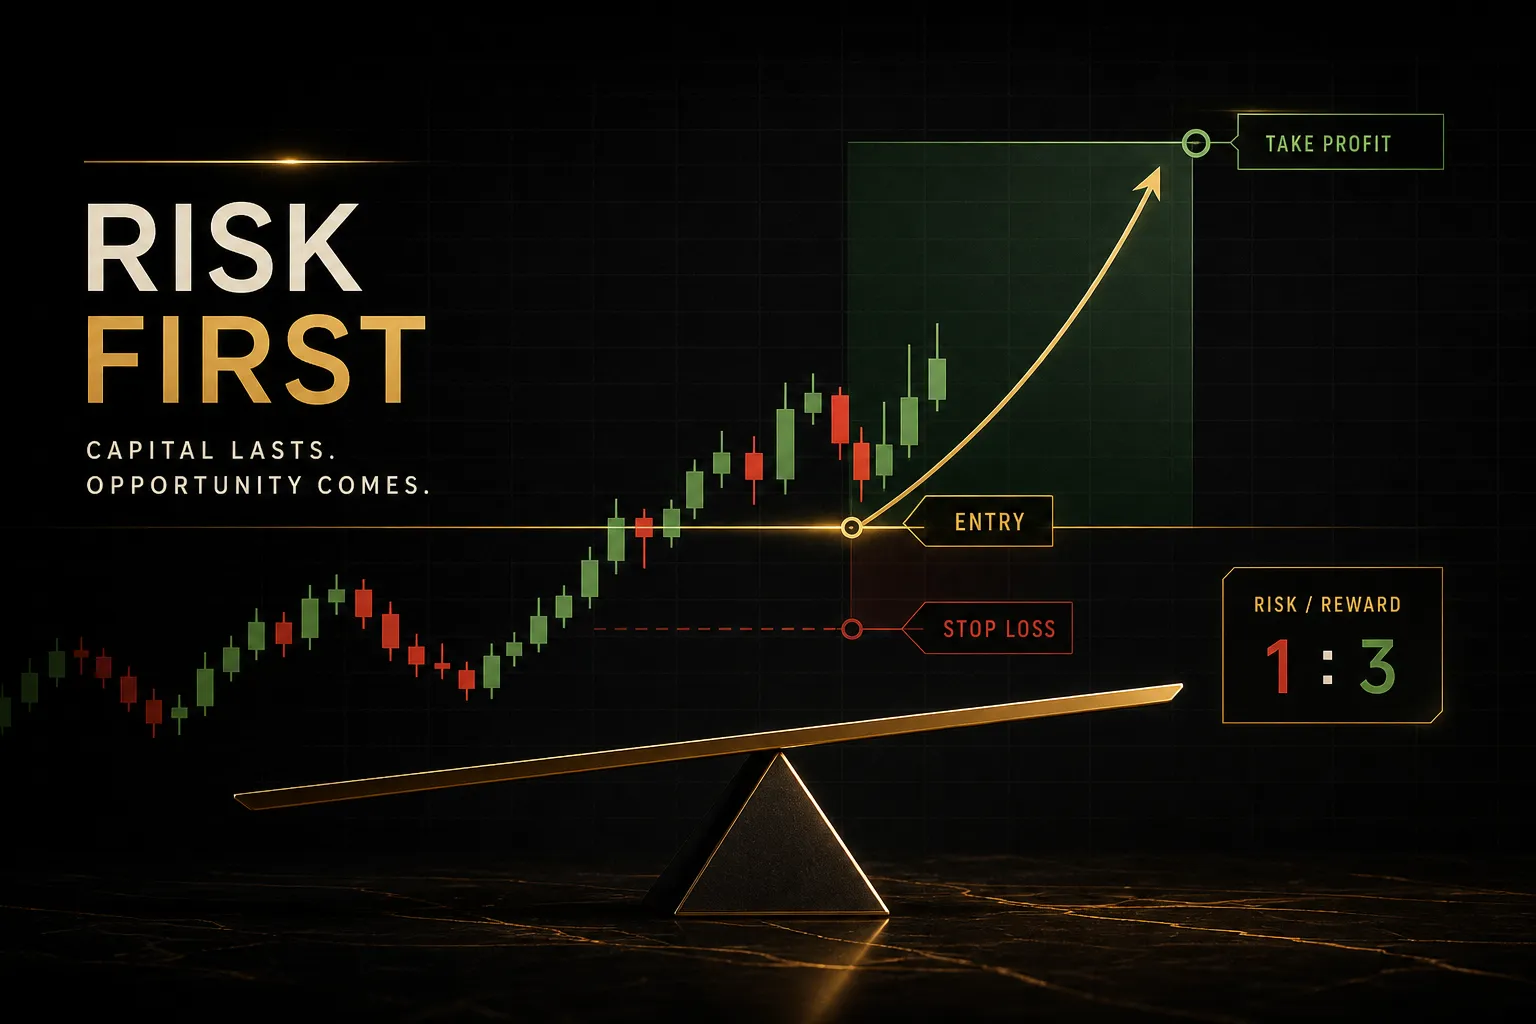
Set a take-profit order at 1.0910, a 60-pip target. That’s a 2:1 risk-reward ratio: risking $48 to make $96.
| Trade Component | Value | How It’s Calculated |
|---|---|---|
| Account balance | $5,000 | Starting capital |
| Risk per trade | $50 (1%) | Balance × 0.01 |
| Entry price | 1.0850 | Ask price at execution |
| Stop-loss price | 1.0820 | Below nearest support level |
| Stop distance | 30 pips | (1.0850 - 1.0820) × 10000 |
| Position size | 1.6 mini lots | $50 ÷ (30 × $1) |
| Pip value | $1.60 | 16000 units × 0.0001 |
| Spread cost | $1.92 | 1.2 pips × $1.60 |
| Max dollar loss | ~$50 | Stop loss + spread |
| Target profit | $96 | 60 pips × $1.60 |
Notice what never entered the calculation: how confident you feel.
Position size comes from the stop distance and the risk budget, not conviction.
Why Leverage Cuts Both Ways
Leverage doesn’t change your risk if your position size is already fixed by the formula above.
It changes your risk when you let available leverage decide your position size.
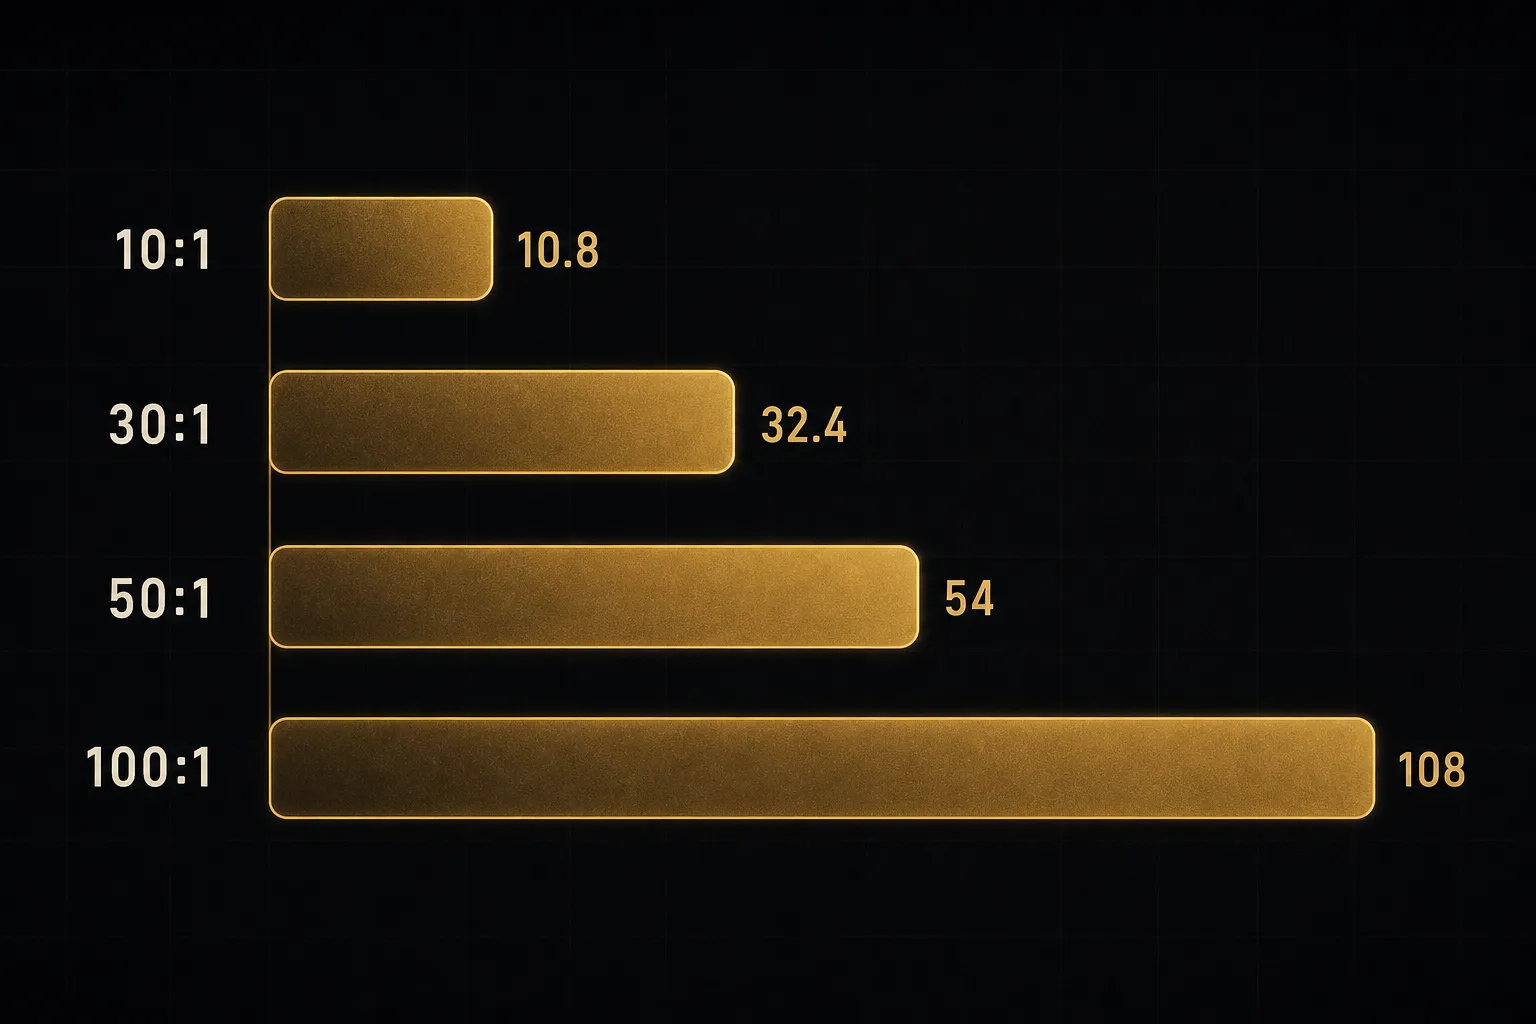
Take the same $5,000 account and a 1% adverse move in EUR/USD, roughly 108 pips. Watch what happens as leverage ratio climbs.
| Leverage Ratio | Position Notional | Pip Value | Loss on 108-Pip Move | % of Account |
|---|---|---|---|---|
| 10:1 | $50,000 | $5.00 | $540 | 10.8% |
| 30:1 | $150,000 | $15.00 | $1,620 | 32.4% |
| 50:1 | $250,000 | $25.00 | $2,700 | 54.0% |
| 100:1 | $500,000 | $50.00 | $5,400 | 108.0% |
At 100:1, a routine 1% currency move wipes the account and triggers a margin call long before that point.
Same market, same move, catastrophically different outcome.
This is why the 1-2% risk-per-trade rule exists.
But treat it as a guideline, not a shield.
The rule shifts with circumstances.
On a $500 account, 1% is $5, which forces impractically small positions or unrealistically tight stops. Volatile pairs like GBP/JPY need wider stops, which means smaller positions for the same dollar risk.
And 1% risk still permits a brutal drawdown.
Ten consecutive losses at 1% costs about 9.6% of the account.
Statistically, a strategy winning 45% of the time will hit a 10-loss streak within a few hundred trades.
Plan for it.
Starting Safely: Capital, Demos, and Brokers
The setup phase is where most of the preventable damage happens.
Wrong capital, wrong broker, or a jump to live trading three weeks too early.
How Much Money You Actually Need
Broker minimum deposits and functional trading capital are two different numbers, and conflating them is the most common beginner error.
- Broker minimums are marketing, not guidance. Many brokers advertise $100 or even $0 minimums. That figure tells you what they’ll accept, not what allows sensible position sizing.
- The honest answer on $100: it is enough to practice risk discipline on a micro account with real emotional stakes. It is not enough to generate meaningful income, and treating it that way forces oversized positions.
- Run the math on $100. A 1% risk is $1. With a 30-pip stop, that permits 0.03 micro lots, which most brokers won’t execute. You’re pushed to either 10x the risk or abandon the stop.
- A practical starting range is $500 to $2,000 for a trader who wants micro lots, real stop distances, and room to absorb a losing streak without the account becoming unworkable.
- Only trade money you can lose entirely without affecting rent, debt payments, or emergency savings. This is not a hedge or a savings vehicle.
Demo to Live: What Actually Changes
Demo trading is essential and also misleading.
It teaches platform mechanics and lets you test a system, but it removes several frictions that define live trading.
- Slippage becomes real. Demo servers usually fill at your requested price. Live orders, especially stops during fast moves, can fill several pips worse. A 30-pip stop can become a 38-pip loss.
- Spreads widen unpredictably. A 1.2-pip EUR/USD spread can jump to 8 or 15 pips seconds around a Non-Farm Payrolls release. Demo feeds often smooth this out.
- Emotional pressure appears from nowhere. Watching $400 of real money swing against you produces decisions no demo account ever prompted: moving stops, doubling down, closing winners early.
- Order fills get imperfect. Requotes, partial fills, and rejected orders during volatility are live-only experiences.
- Readiness checkpoint one: at least 50 to 100 demo trades logged in a trading journal with entry logic, stop placement, and outcome recorded for each.
- Readiness checkpoint two: a written one-page plan you followed on at least 80% of those trades. Following a mediocre plan beats improvising a great one.
- Readiness checkpoint three: position sizing calculated correctly, from the formula, on every single trade without exception.
Vetting a Broker and Spotting Scams
Because forex is OTC, broker quality varies enormously. Verification takes about twenty minutes and prevents the most expensive mistake available to a beginner.
- Confirm regulatory registration directly with the regulator, not the broker’s website. Check the FCA register (UK), NFA BASIC (US), ASIC (Australia), or CySEC (Cyprus) using the license number.
- Review disciplinary history. Regulators publish enforcement actions. A pattern of fines for withdrawal delays or misleading advertising is disqualifying.
- Read the customer agreement for the execution model, conflict-of-interest disclosures, and dispute procedures. Vague documents signal vague protections.
- Verify published costs: typical spread and commission per pair, plus overnight swap rates. If costs aren’t public, assume they’re unfavorable.
- Check the slippage policy and whether it’s symmetric. Some brokers pass on negative slippage but pocket positive slippage.
- Confirm withdrawal rules: processing times, fees, and required documentation. Test with a small withdrawal before scaling deposits.
- Look for negative-balance protection, which prevents you owing money beyond your deposit after a gap event. Mandatory for retail clients in the UK and EU, optional elsewhere.
Now the fraud patterns. These recur with depressing consistency.
- Social-media recruitment featuring rented cars, screenshot profits, and DMs offering “account management.” Legitimate firms don’t cold-message strangers on Instagram.
- Guaranteed returns of any size. “5% per week, no risk” is mathematically impossible and legally prohibited in every regulated jurisdiction.
- Fake account dashboards showing fabricated balances that grow steadily. The number on screen is HTML, not money.
- Withdrawal-fee demands. You request $5,000 and are told to first deposit $800 for “tax clearance” or “liquidity release.” That fee is the actual product.
- Unregistered offshore dealers based in jurisdictions with no meaningful oversight and no recovery mechanism.
- Crypto-only deposits. Irreversible payment rails are chosen deliberately by operations that plan not to pay you back.
- Undisclosed affiliate incentives where an “educator” earns commission on your losses or trading volume without disclosing it.
Building a Beginner’s Trading Approach
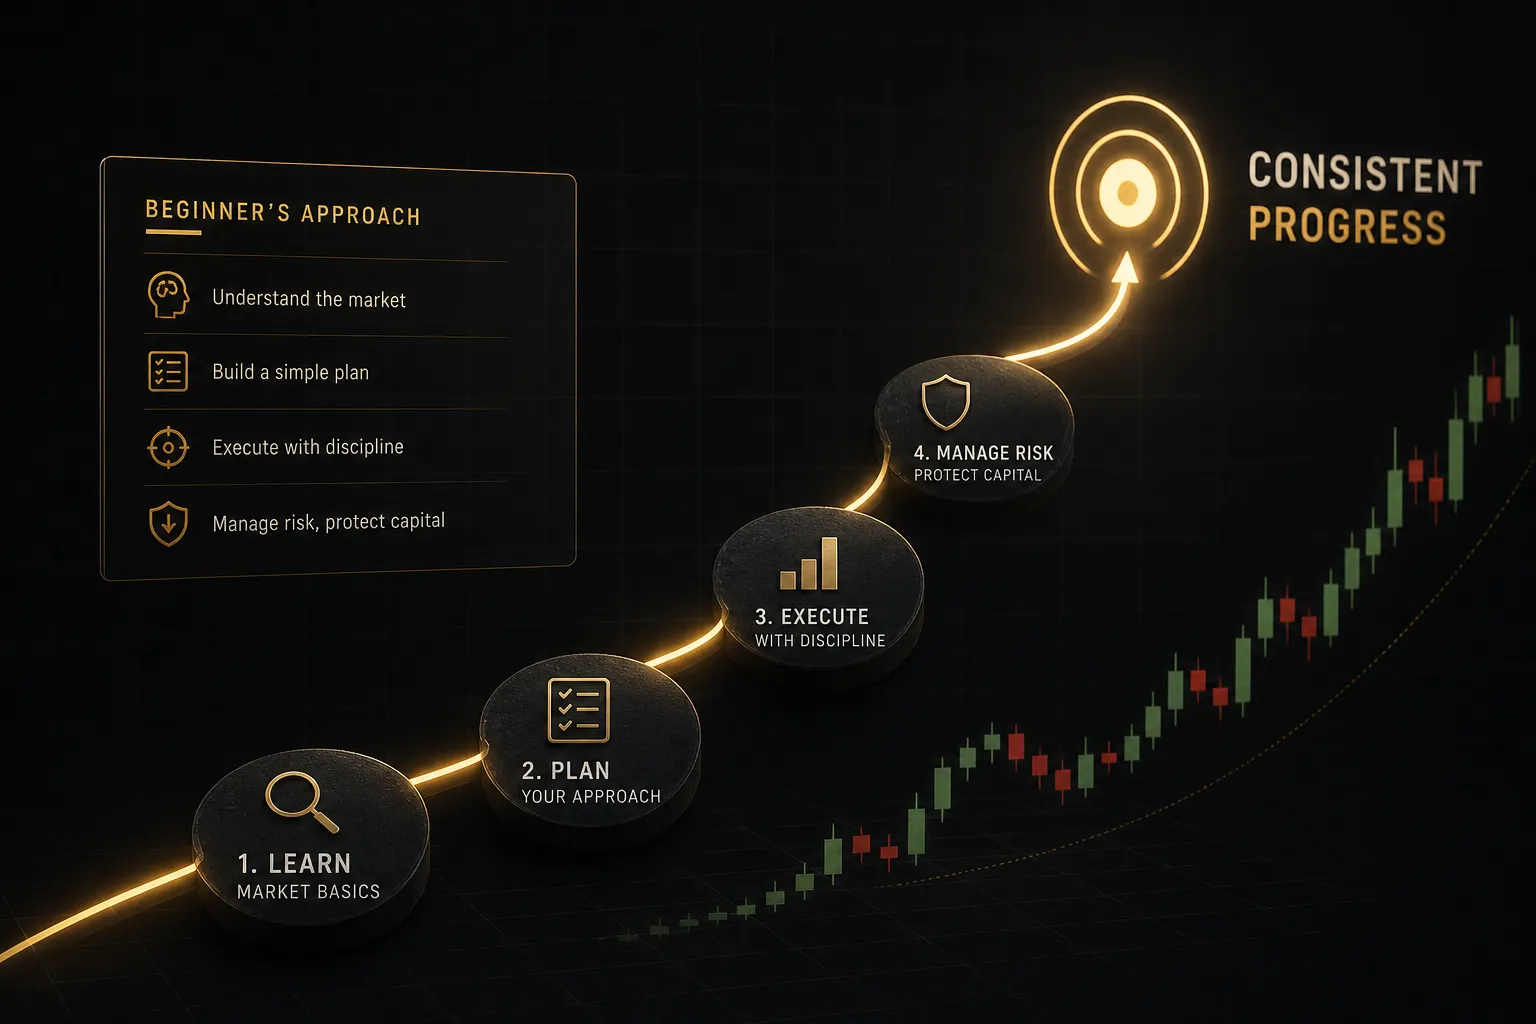
A beginner does not need a sophisticated system.
A beginner needs a repeatable one, applied on timeframes that don’t demand constant attention.
Timeframes and Sessions to Start With
Start on the H1, H4, or Daily charts.
The reason is signal-to-noise: a 5-minute chart generates dozens of setups per day, most of which are random fluctuation dressed up as structure.
Higher timeframes also give you time to think.
A Daily setup can be analyzed over coffee. A 1-minute setup demands a decision in seconds, which is exactly when beginners abandon their rules.
Session choice involves real trade-offs.
The Asian session (Tokyo) is quieter, with tighter ranges and thinner liquidity outside JPY and AUD pairs. The London session carries the highest volume, delivering tight spreads and genuine directional moves.
The London-New York overlap, roughly 8am to noon Eastern, is the busiest window of the day. Best liquidity, strongest trends, and also the sharpest reversals.
There’s a cost dimension too.
Positions held past 5pm New York incur a swap charge or credit, depending on the interest rate differential between the two currencies. Hold a Daily-chart trade for a week and swap can meaningfully change your net result.
Technical and Fundamental Analysis Together
The technical-versus-fundamental debate is a false choice, and treating it as a rivalry costs beginners money.
Chart analysis tells you where price has reacted before. Support and resistance levels, trend analysis, and structure give you entry and exit reference points that are visible and testable.
The economic calendar tells you when that structure is likely to be violated. A clean support level means very little four minutes before a central bank rate decision.
Here’s the practical link to your risk rule.
During major releases, spreads widen dramatically and slippage increases, meaning a stop-loss order placed 30 pips away might execute 45 pips away.
Your carefully calculated $50 risk becomes $75.
A stop-loss order guarantees exit, not exit price. During high-impact news, that distinction can double your intended loss.
The beginner’s rule: check the calendar every morning.
Avoid opening new positions in the 30 minutes surrounding high-impact events on the pairs involved, or reduce size to account for wider execution.
Where Indicators Actually Help
Technical indicators are mathematical transformations of price.
They cannot see the future, and any claim otherwise is a sales pitch.
Their real limitations, stated plainly:
- Lag. Moving averages and MACD are derived from past prices, so they confirm moves rather than predict them.
- Conflicting signals in ranging markets. Trend indicators fire constantly and wrongly when price is chopping sideways.
- Repainting. Some indicators redraw their historical signals as new data arrives, making backtests look flawless and live performance look nothing like it. A non-repainting indicator locks its signal on candle close and never changes it.
- Overfitting. Tuning settings until historical results look perfect usually produces a tool optimized for a past that won’t repeat.
Validate any indicator on closed candles across a meaningful historical sample. Backtesting on TradingView charts across several hundred setups tells you far more than a week of watching it live.
It also helps to separate three things beginners routinely blur together.
A signal is one input.
A trading system is a complete set of rules covering entry, exit, and risk.
Discretionary judgment is what you apply when conditions fall outside your rules.
Tools like PipTrend illustrate this separation cleanly. Direction comes from a color-coded trend signal, entry references marked liquidity levels, VWAP, and supply and demand zones, and exit uses a multi-timeframe confirmation table for signal confirmation across intervals.
Useful structure.
But no indicator places your stop-loss order or decides your position size.
That remains your job, defined in a written plan before the trade exists.
PipTrend also publishes a public results page with verified statements, which is a reasonable standard to hold any educational tool to.
Transparent, checkable performance data beats screenshots every time.
Common Questions About Getting Started
Is forex trading good for beginners?
Forex is accessible to beginners but not forgiving of them. Low minimum deposits, 24-hour access, and free demo accounts make entry easy, while high leverage and OTC execution make mistakes expensive.
It suits people willing to spend months on process before expecting results. It punishes anyone treating it as quick supplementary income.
How do I start forex trading with no experience?
Open a demo account with a regulated broker and trade it for at least three months. Learn the platform, practice the position-sizing formula on every trade, and keep a trading journal recording your reasoning and outcome.
Focus on one or two major currency pairs, such as EUR/USD, on the H4 or Daily timeframe. Add live capital only after you’ve followed a written plan consistently across 50 or more demo trades.
How much money do I need to start forex trading?
You need enough capital that a 1% risk translates into a tradeable position size, which practically means $500 to $2,000 for micro-lot trading. Broker minimums of $100 or less permit account opening, not sensible risk management.
With $100 and a 30-pip stop, a 1% risk is $1, which is below most brokers’ minimum trade size.
That gap forces oversized risk, which is how small accounts disappear.
Can I make $100 a day trading forex?
It is possible but statistically unlikely for beginners, and the framing itself causes damage. A fixed daily target ignores that markets don’t produce equal opportunity each day.
Think in trade expectancy instead: average win multiplied by win rate, minus average loss multiplied by loss rate. A system with positive expectancy still delivers losing weeks and drawdowns of 15% or more, and streaks of eight to ten losses are normal, not evidence of a broken system.
One winning month proves nothing.
It takes several hundred trades before results reflect process rather than luck.
What is the best forex strategy for beginners?
Trend-following on the Daily or H4 chart with a fixed 1% risk and a minimum 2:1 risk-reward ratio is the most reliable starting framework. It requires few decisions, generates few trades, and forces patience.
The specific entry technique matters far less than consistent execution. Any strategy applied with disciplined position sizing outperforms a superior strategy applied erratically.
Is forex trading risky or a scam?
Forex trading is genuinely risky but not inherently a scam. The market is a legitimate decentralized OTC market where global institutions transact billions daily, and regulated brokers operate under real oversight.
The fraud sits around the edges: unregistered offshore dealers, guaranteed-return schemes, fake dashboards, and withdrawal-fee demands. Verify your broker’s license directly with the regulator and treat any promise of guaranteed returns as proof of fraud.
Your Next Move
One recommendation, three parts.
Open a demo account with a regulated broker, write a one-page trading plan, and log every single trade before real money enters the picture.
The plan needs four things: your entry rules stated specifically enough that another person could apply them, your risk per trade as a percentage, your stop-loss logic, and your target logic.
One page.
If it doesn’t fit, it’s too complicated to follow under pressure.
Then build a review habit.
When you examine a trade, sort the outcome into five buckets: strategy quality (was the setup valid?), execution error (did you enter where you planned?), risk error (was position sizing correct?), market conditions (news, session, volatility), and emotional decisions (did you move a stop or chase an entry?).
This matters for wins as much as losses.
A profitable trade taken at triple your normal size isn’t a win.
It’s a risk error that happened to pay.
Here’s the perspective shift worth carrying into 2026: nobody is hiding a perfect strategy from you. Consistency and risk control build a verifiable track record far faster than another month spent searching for the setup that never loses.
Protect the account first.
Everything else becomes possible after that.
Sources
Risk Disclaimer: Trading involves risk. Past performance doesn't guarantee future results. Only trade with money you can afford to lose. PipTrend is a tool to assist your trading decisions, not financial advice.