On this page
Why Traders Use Fibonacci Retracement
Two traders can open the same chart, apply the same tool, and get completely different levels.
The difference is almost never the software. It comes down to which swing they chose and how they anchored it.
Fibonacci retracement is a charting tool that marks likely pullback zones within an existing trend. It takes a completed price move, the impulse move, and divides it into ratios where price often pauses or reverses before the trend resumes.
That’s all it does.
It doesn’t predict where the market is going, and it doesn’t tell you when to buy.
Think of it like a map of rest stops on a highway. The map shows where drivers tend to pull over, but it can’t tell you which stop a particular car will use.
Or whether it stops at all.
That’s why learning how to draw Fibonacci retracement correctly means more than connecting two points. Correct drawing depends on reading market structure: identifying the swing that matters, choosing consistent anchor points, and matching the tool to the timeframe you actually trade.
This guide treats Fibonacci the way professional traders do in 2026. It’s one input among several, alongside price action, prior support and resistance, and confluence from other timeframes.
Used that way, it becomes a genuinely useful filter. Used alone, it’s a set of lines that price touches by coincidence about as often as by design.
What the Ratios Actually Mean
Most traders memorize the numbers without ever calculating one by hand. That’s a mistake, because once you see the math, the tool stops feeling mystical and starts feeling mechanical.
Which it is.
A Quick Calculation Example
Imagine EUR/USD rallies from a swing low of 1.1000 to a swing high of 1.1200.
That’s a 200-pip move.
Every retracement level is simply a percentage of that 200-pip range, subtracted from the high.
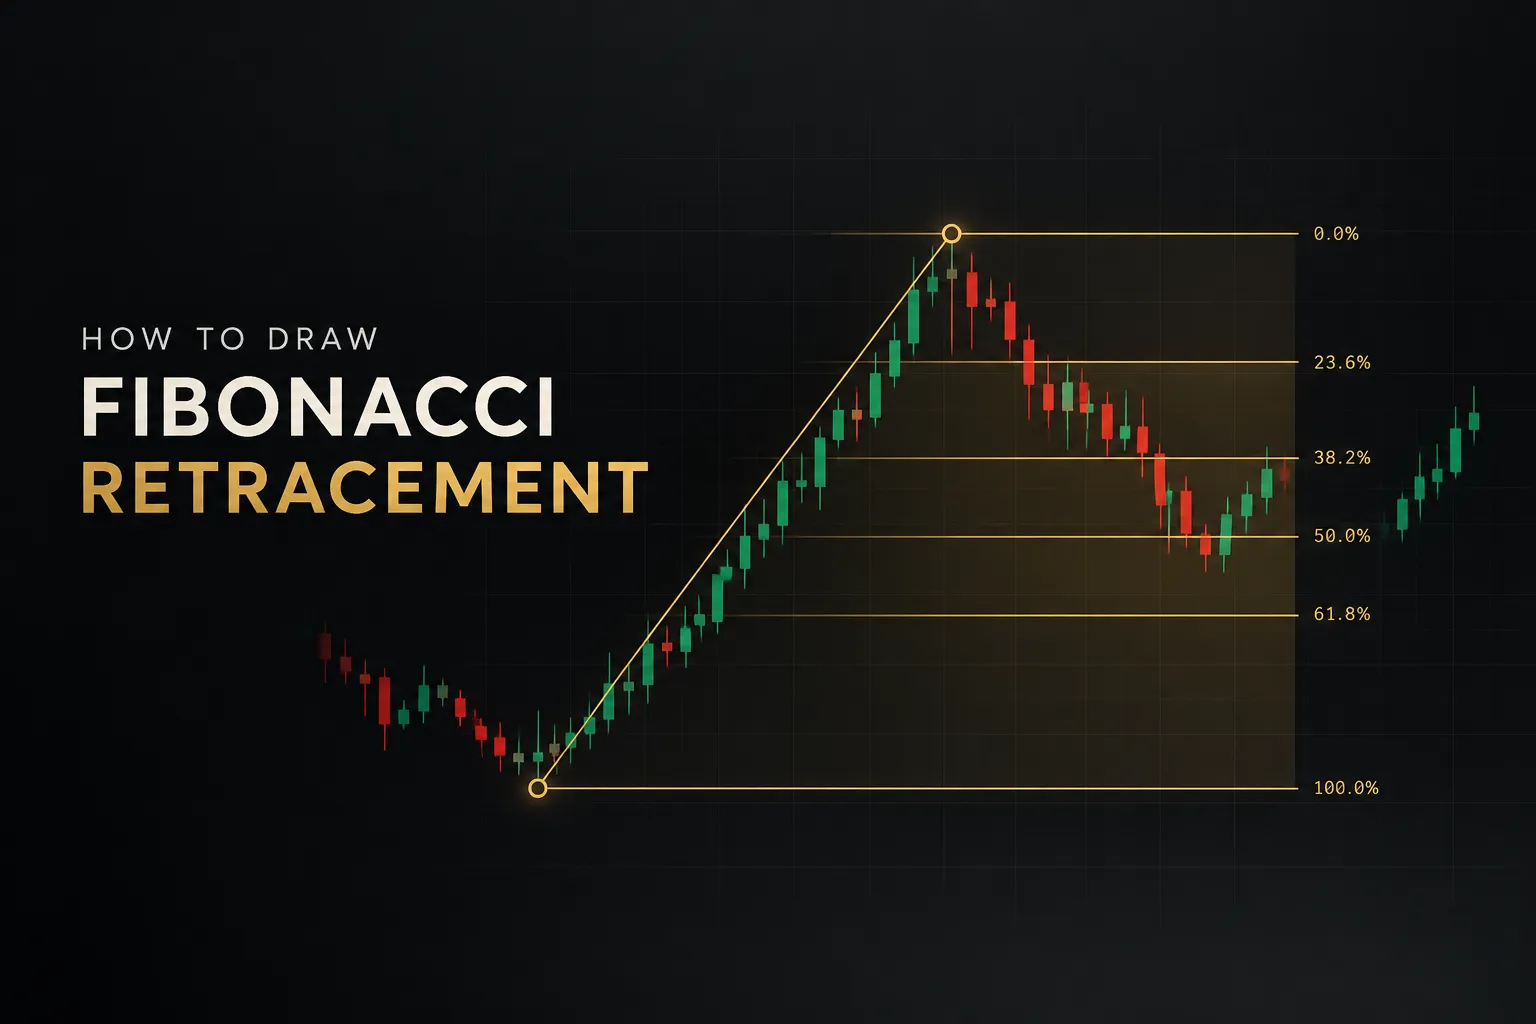
The 38.2% level sits 76.4 pips below the high, at roughly 1.1124. The 50% level lands exactly at 1.1100, the midpoint of the move.
The 61.8% level sits 123.6 pips down, at about 1.1076, and the 78.6% level falls 157.2 pips down, near 1.1043.
So if price pulls back from 1.1200 and stalls around 1.1075, it has retraced roughly 61.8% of the prior rally. Your charting platform does this arithmetic instantly.
But knowing it lets you sanity-check any level that looks wrong.
Where do these specific percentages come from? The Fibonacci sequence (0, 1, 1, 2, 3, 5, 8, 13, 21, 34, 55, 89…) produces consistent ratios once the numbers get large enough.
Divide any number by the next one and you approach 0.618, the inverse of the golden ratio. Divide by the number two places ahead and you get 0.382.
Three places ahead gives 0.236. The 78.6% level is the square root of 0.618.
The 50% level is the odd one out.
It isn’t derived from the Fibonacci sequence at all. Traders include it because halfway retracements are common in practice and because Dow Theory long treated the midpoint of a move as significant, so most platforms show it by default.
Retracement vs Extension Tools
Beginners often grab the wrong tool from the drawing menu, because several Fibonacci tools sit side by side.
The distinction is simple.
Retracement measures how far price pulls back inside a completed move, so its levels fall between 0% and 100%.
Fibonacci extension, projection, and expansion tools measure where price might travel beyond the original move. They produce levels like 127.2%, 161.8%, and 261.8%, and traders typically use them for profit targets rather than entries.
Some platforms require three clicks for an extension (start, end, retracement point) versus two clicks for a retracement.
[COMPARE: Retracement vs Extension | Retracement | Extension | PurposeMix them up and you’ll end up hunting for entries at levels designed for exits.
Not a small error.
Drawing Fibonacci Step by Step
Most bad Fibonacci drawings fail before the first click.
The trader picked a swing that didn’t matter, so every level that followed was built on sand. The process below fixes that by forcing the structural decisions first.
Picking the Right Swing
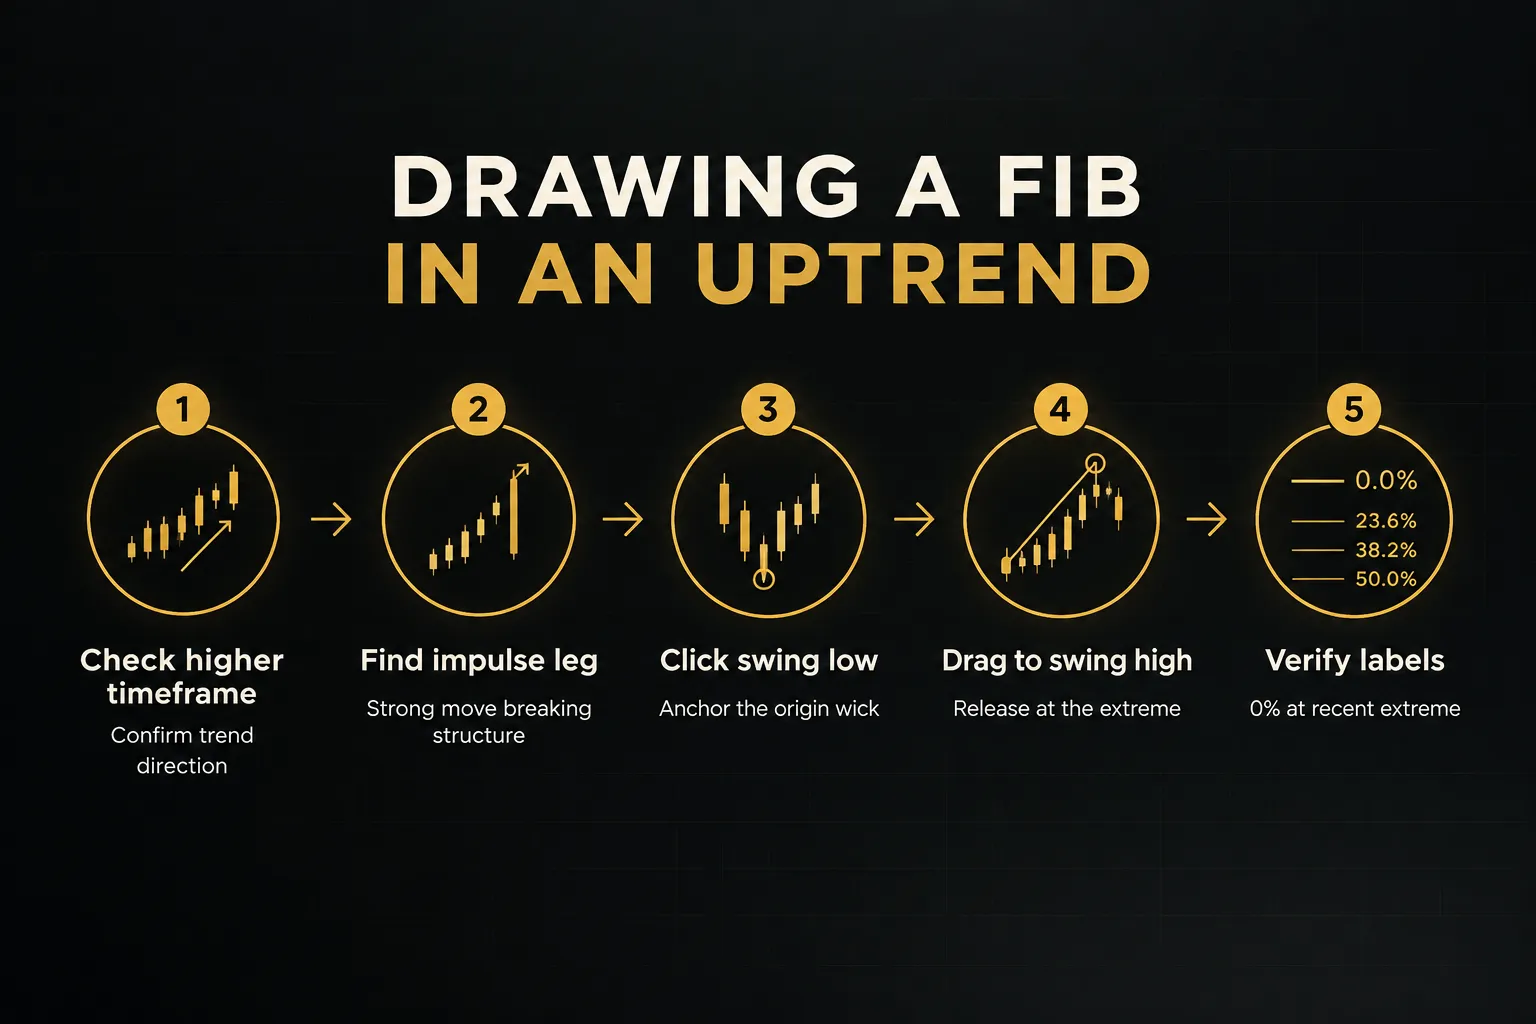
- Start on a higher timeframe. Open the chart one or two timeframes above where you plan to execute (daily if you trade the 4-hour, 4-hour if you trade the 1-hour). This shows you which direction the dominant trend is moving.
- Identify the dominant impulse leg. Look for the most recent strong, directional move that broke a prior high or low. This is the leg you’ll measure, because it represents genuine buying or selling commitment.
- Confirm the swing is complete. The impulse should have a clear endpoint, meaning price has started pulling back from the extreme. If price is still making new highs, there’s nothing to retrace yet.
- Drop to your execution timeframe. Locate the same swing points on your trading chart so your anchors are precise. Higher-timeframe context tells you which swing; the lower timeframe tells you exactly where it started and ended.
Wicks or Bodies?
- Anchor to the extreme wick by default. Wicks represent the actual highest and lowest prices traded, so they capture the true range of the move. This is the most widely used convention and the easiest to repeat.
- Pick one method and never mix them. Anchoring the low to a wick and the high to a candle body shifts every level by an inconsistent amount. On a 200-pip swing, a 15-pip wick can move your 61.8% level by nearly 10 pips.
- Apply the same rule across every chart. Consistency matters more than the choice itself. If you switch methods depending on which version looks better, you’re curve-fitting, not analyzing.
A Fibonacci level is only as reliable as its anchors. Change the anchor rules from trade to trade and you’re no longer testing a strategy. You’re testing your mood.
Uptrend vs Downtrend Anchors
Direction determines click order.
Get this right and the levels appear exactly where you expect them.
- Uptrend: click the swing low first. Select the Fibonacci retracement tool and click the lowest wick where the impulse began. This sets 100% at the start of the move.
- Uptrend: drag to the swing high. Release at the highest wick where the rally ended. The retracement levels now appear below current price, marking potential support zones for a pullback.
- Downtrend: click the swing high first. For a falling market, start at the highest wick where the decline began. This anchors 100% at the top of the move.
- Downtrend: drag to the swing low. Release at the lowest wick where the selloff ended. The levels now sit above price, marking potential resistance zones where a bounce may fail.
- Verify the 0% and 100% labels. In both cases, 0% should sit at the most recent extreme and 100% at the origin of the move. If they’re flipped, redraw before analyzing anything.
Judgment Calls That Trip Traders Up
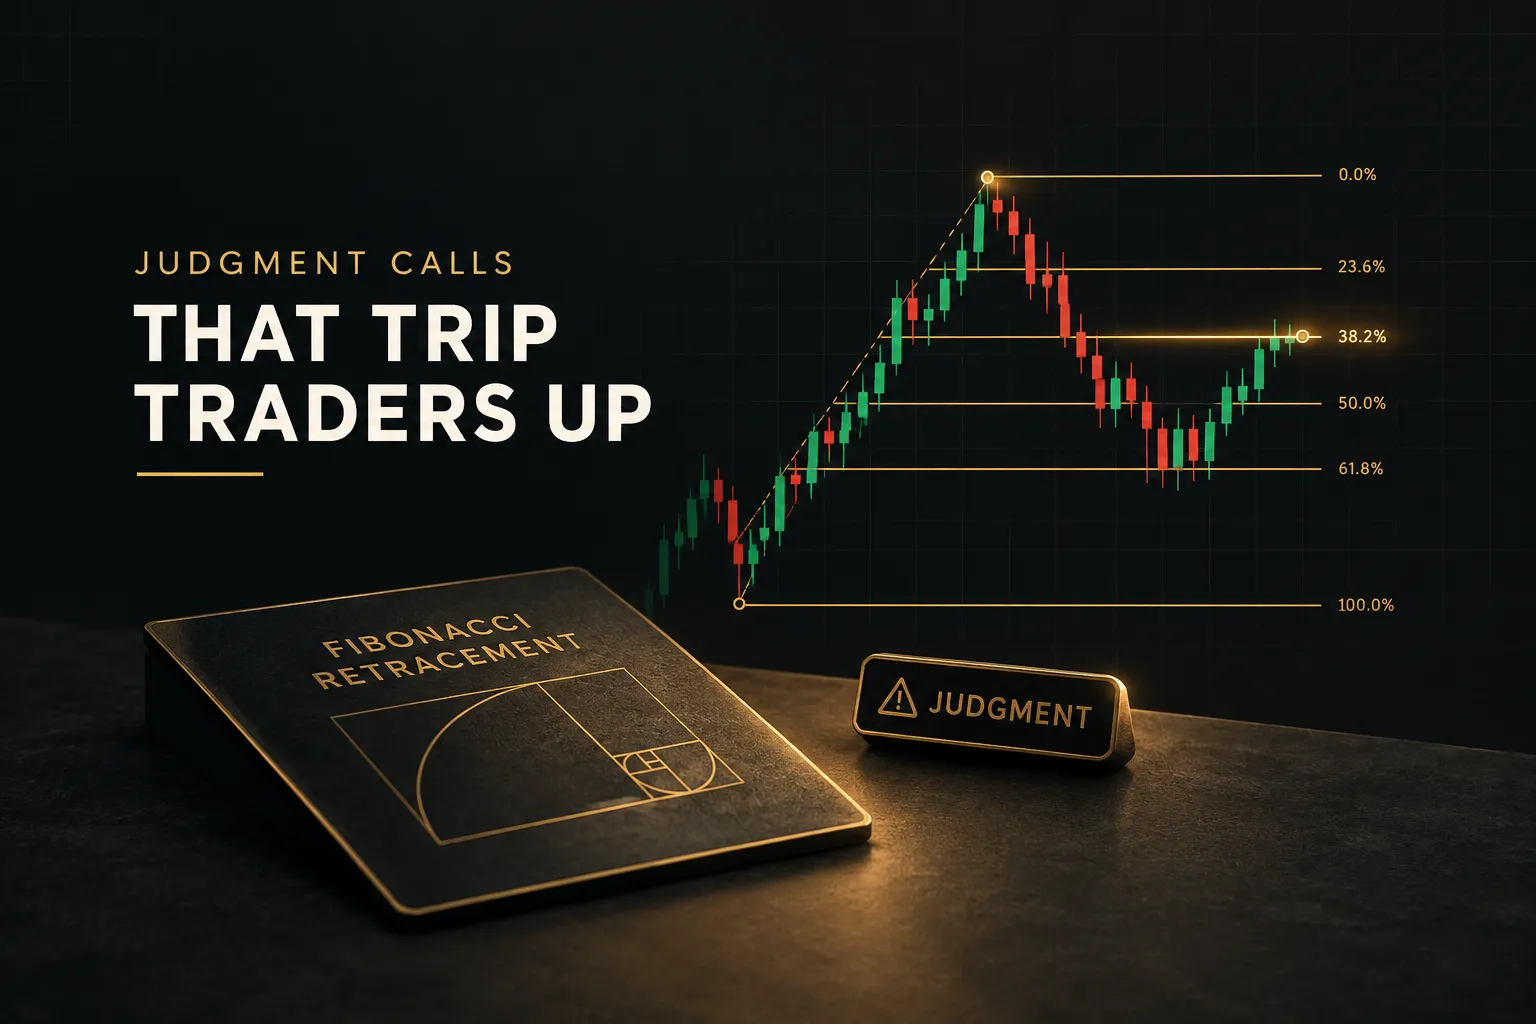
The mechanics take five minutes to learn.
The judgment takes months.
Here’s where even experienced traders get it wrong, and how to make better calls.
Nested Swings and Minor Pivots
Every trend contains smaller trends inside it. A single daily rally might hold four or five distinct 4-hour swings, each with its own highs and lows.
The question is which one deserves your Fibonacci tool.
- Meaningful swings break structure. A swing worth anchoring to has broken a prior high (in an uptrend) or prior low (in a downtrend) and shown a sustained move afterward, usually several candles in one direction rather than a single spike.
- Minor pivots don’t qualify. A small intrabar wiggle that never broke any prior level is noise. Anchoring to it produces levels so tight that price will slice through all of them in one candle.
- Match the swing to your timeframe. If a daily rally runs from 1.0800 to 1.1200, a swing trader holding for days should measure that full leg. A 4-hour trader might instead measure the most recent internal leg, say 1.1050 to 1.1200, while keeping the larger daily levels in view as context.
- Watch where the levels overlap. When a 61.8% level from the 4-hour swing lands near the 38.2% level from the daily swing, that overlap often carries more weight than either level alone. This is multi-timeframe analysis doing its job.
Choppy Ranges and News Spikes
Some market conditions produce swing points that simply aren’t trustworthy. Drawing a retracement on them gives you precise-looking levels with no real meaning behind them.
- Illiquid sessions distort anchors. Thin trading during holiday periods or the gap between the New York close and the Asian open can create highs and lows that few participants actually traded. Those extremes rarely act as reference points later.
- Unconfirmed reversals aren’t swings yet. If price has only pulled back two candles from a high, you can’t know whether that high is final. Wait for a clear reaction, or a break of the minor structure, before treating it as an anchor.
- Single-candle news spikes skew everything. A 60-pip wick on a central bank announcement can stretch your range dramatically. Many traders exclude spike wicks that reverse within the same candle, or anchor to the post-news structure instead.
- Sideways ranges don’t need retracements. Fibonacci measures pullbacks within trends. In a flat, choppy market, horizontal support and resistance usually tells you more than any ratio.
Why Your Fib Looks Backwards
This is the single most common complaint from new traders, and the fix takes about three seconds.
- The cause is reversed anchor order. If you drew high-to-low on an uptrend, the tool assumes a downtrend and places 0% at the old low. Your levels appear above price instead of below it.
- Check where 0% sits. In any correct retracement, 0% marks the most recent extreme (the latest high in an uptrend, the latest low in a downtrend). If 0% sits at the origin of the move, the tool is upside down.
- Redraw rather than reinterpret. Some traders try to read the inverted levels mentally. Don’t. Delete it and redraw in the correct order so your labels match the market.
Treating Levels as Zones, Not Signals
Here’s a counterintuitive truth: price rarely turns exactly at a Fibonacci line. It overshoots by a few pips, undershoots by a few more, or chops around the level for an hour before deciding.
Traders who expect precision get stopped out constantly.
A better approach is to treat each ratio as a zone of potential support and resistance. On a 200-pip swing, that might mean a buffer of 5 to 10 pips around each level, scaled to the instrument’s typical volatility.
The zone tells you where to start paying attention.
It doesn’t tell you to act.
The 61.8% to 78.6% area deserves special mention.
Many traders treat it as the primary entry zone for trend continuation trades, because a pullback this deep offers a favorable risk-to-reward ratio while still keeping the trend structure intact. Shallow 38.2% pullbacks tend to appear in very strong trends; deeper ones in steadier, more balanced markets.
Stop-loss placement follows the same zone logic.
Never park your stop directly on a ratio line, because that’s precisely where price wobbles. Place it beyond the swing extreme (the 100% level) or at least beyond the next structural point, so a normal overshoot doesn’t take you out.
Confluence Before Entry
A Fibonacci level on its own is a suggestion. A Fibonacci level that lines up with three other factors is an argument.
Confluence is what separates the two.
Start with prior support and resistance.
If the 61.8% level sits right where price previously reversed, buyers and sellers already have a reason to care about that price. Then check trend structure: is the higher timeframe still making higher highs and higher lows, or has it started to roll over?
Volatility context matters too.
During high-volatility periods, pullbacks often run deeper than usual, so a 78.6% retracement may be perfectly normal rather than a warning sign. Finally, look for multi-timeframe alignment, where the trend on your execution chart agrees with the one above it.
Tools like PipTrend’s multi-timeframe table and confidence band can help here. Instead of trading a fib zone blindly, you can check whether trend direction agrees across timeframes and whether the confidence band supports a continuation at that price.
If the table shows conflicting signals, that’s a reason to wait, even if price is sitting perfectly on 61.8%.
And always wait for some form of price action confirmation: a rejection wick, an engulfing candle, or a break of minor structure back in the trend’s direction.
The level identifies the area. Price action tells you buyers or sellers actually showed up.

When a Retracement Fails
Every Fibonacci setup needs a clear invalidation point. Without one, a losing trade quietly becomes a “long-term position.”
The rule is straightforward.
A confirmed break and close beyond the 100% level means the original retracement thesis is void. Price has erased the entire impulse move, which signals a possible trend reversal rather than a pullback.
At that point, delete the old drawing and redraw from the new swing structure.
One more technical detail catches traders on volatile assets.
On a logarithmic chart scale, levels are calculated on percentage changes rather than absolute price distances, which shifts their placement noticeably. On a move from $20,000 to $60,000 in Bitcoin, the 61.8% level can differ by thousands of dollars between log and linear scale.
Use log scale for assets that have moved several hundred percent or more, such as crypto and high-growth stocks over long periods. Stick with linear scale for forex pairs and shorter intraday swings, where price changes are small relative to price level.
Whichever you choose… stay consistent.
Fibonacci Retracement FAQ
How do you properly draw Fibonacci retracement?
You draw Fibonacci retracement by selecting a completed impulse move and anchoring the tool from its origin to its extreme.
In an uptrend, click the swing low and drag to the swing high; in a downtrend, click the swing high and drag to the swing low. Use higher-timeframe structure to choose the swing and anchor consistently to wicks.
Do you draw Fibonacci from the swing high or swing low?
It depends on trend direction.
In an uptrend, draw from the swing low to the swing high so levels appear below price as support. In a downtrend, draw from the swing high to the swing low so levels appear above price as resistance.
What are the best Fibonacci levels for trading?
No single Fibonacci level is universally best.
The 61.8% and 50% levels are the most widely watched, and the 61.8% to 78.6% zone is popular for entries, but relevance depends on trend strength, volatility, and confluence. Strong trends often respect shallow 38.2% pullbacks, while calmer markets tend to retrace deeper.
Should Fibonacci retracement be drawn from wick to wick?
Yes, drawing wick to wick is the standard and most consistent method. Wicks represent the true highest and lowest traded prices of the swing.
The critical rule is never mixing wicks and bodies, because that shifts every level unpredictably.
How do you use Fibonacci retracement in an uptrend?
In an uptrend, you use Fibonacci retracement to find potential buying zones during a pullback. Draw from the swing low to the swing high, watch the 38.2% to 78.6% levels for support, and wait for price action confirmation before entering.
Place your stop below the swing low rather than on a ratio line.
Why is my Fibonacci retracement backwards?
Your Fibonacci retracement looks backwards because the anchor order is reversed for the current trend. If you drew high-to-low in an uptrend, the tool treats the move as a downtrend and places levels above price.
Delete it and redraw from low to high, confirming that 0% sits at the most recent extreme.
Make It Part of Your Trading Plan
The traders who get real value from Fibonacci aren’t the ones with the cleverest drawings.
They’re the ones who follow the same process every single time.
Build a short pre-trade checklist and run it before every Fibonacci setup.
Confirm the trend direction on a higher timeframe. Select the correct swing based on market structure, not convenience. Check for confluence with prior levels and multi-timeframe alignment. Define invalidation before entry, usually beyond the 100% level. Size your risk so a stop-out costs a fixed, acceptable percentage of your account.
Then review the trade afterward, win or lose, and note whether your swing selection held up.
Fibonacci retracement works best as a documented, tested component of a trading plan. It works worst as a line drawn because price happened to touch a ratio.
The difference shows up clearly after 50 or 100 logged trades.
Before using the tool live, practice.
Pull up recent charts, find five uptrends and five downtrends, and draw retracements on each. Check where price actually reacted, and how often confluence made the difference.
That practice will teach you more about how to draw Fibonacci retracement than any guide can.
Including this one.
Risk Disclaimer: Trading involves risk. Past performance doesn't guarantee future results. Only trade with money you can afford to lose. PipTrend is a tool to assist your trading decisions, not financial advice.