Best Order Block Indicator on TradingView: A Trader's Guide
On this page
Why Order Block Indicators Aren’t All the Same
Load five order block indicators on the same EURUSD chart and you will probably get five different maps.
Different candles highlighted.
Different zone heights.
Different ideas about which zones are still “live.”
That isn’t a bug.
It is a reflection of what these tools actually do. No TradingView script can see a bank’s order book, so every order block indicator infers institutional footprints from price action and, in some cases, volume data.
The output is a hypothesis about where large orders were filled, not a readout of real resting orders.
So the search for the best order block indicator on TradingView is the wrong starting question.
A better one: which detection logic matches the way you trade, and does it hold up when the chart is moving in real time?
This guide gives you a decision framework instead of a single script name. You will learn how to judge four things:
Detection logic (which candle gets marked and why), repainting behavior (whether zones shift after the fact), zone lifecycle (how mitigation, invalidation, and breaker blocks are handled), and system-building (how the indicator fits into entries, confirmation, and risk).
One expectation to set early.
Even the cleanest Smart Money Concepts tool is only one layer of a trade.
The zone tells you where to pay attention. Your confirmation rules, alerts, and position sizing decide whether you actually make money there.
How Order Block Indicators Actually Define a Zone
Here is something most indicator descriptions skip: there is no official definition of an order block. The term was popularized through ICT trading and the wider Smart Money Concepts community, and every script author translates that loose idea into code differently.
Start with the most common confusion.
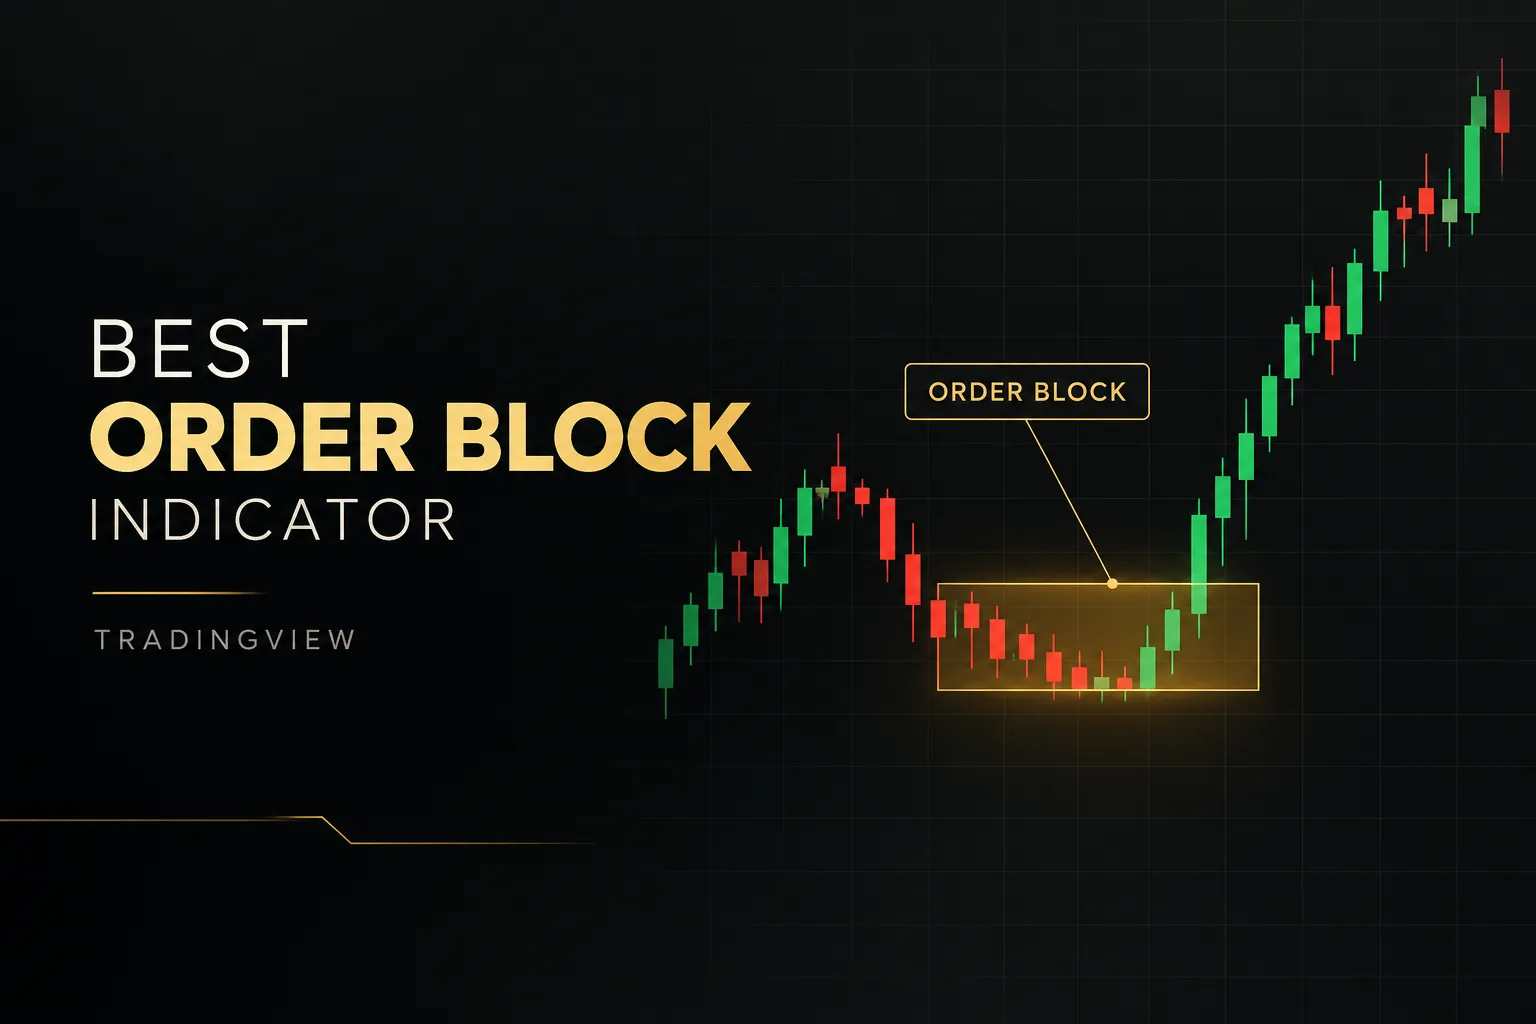
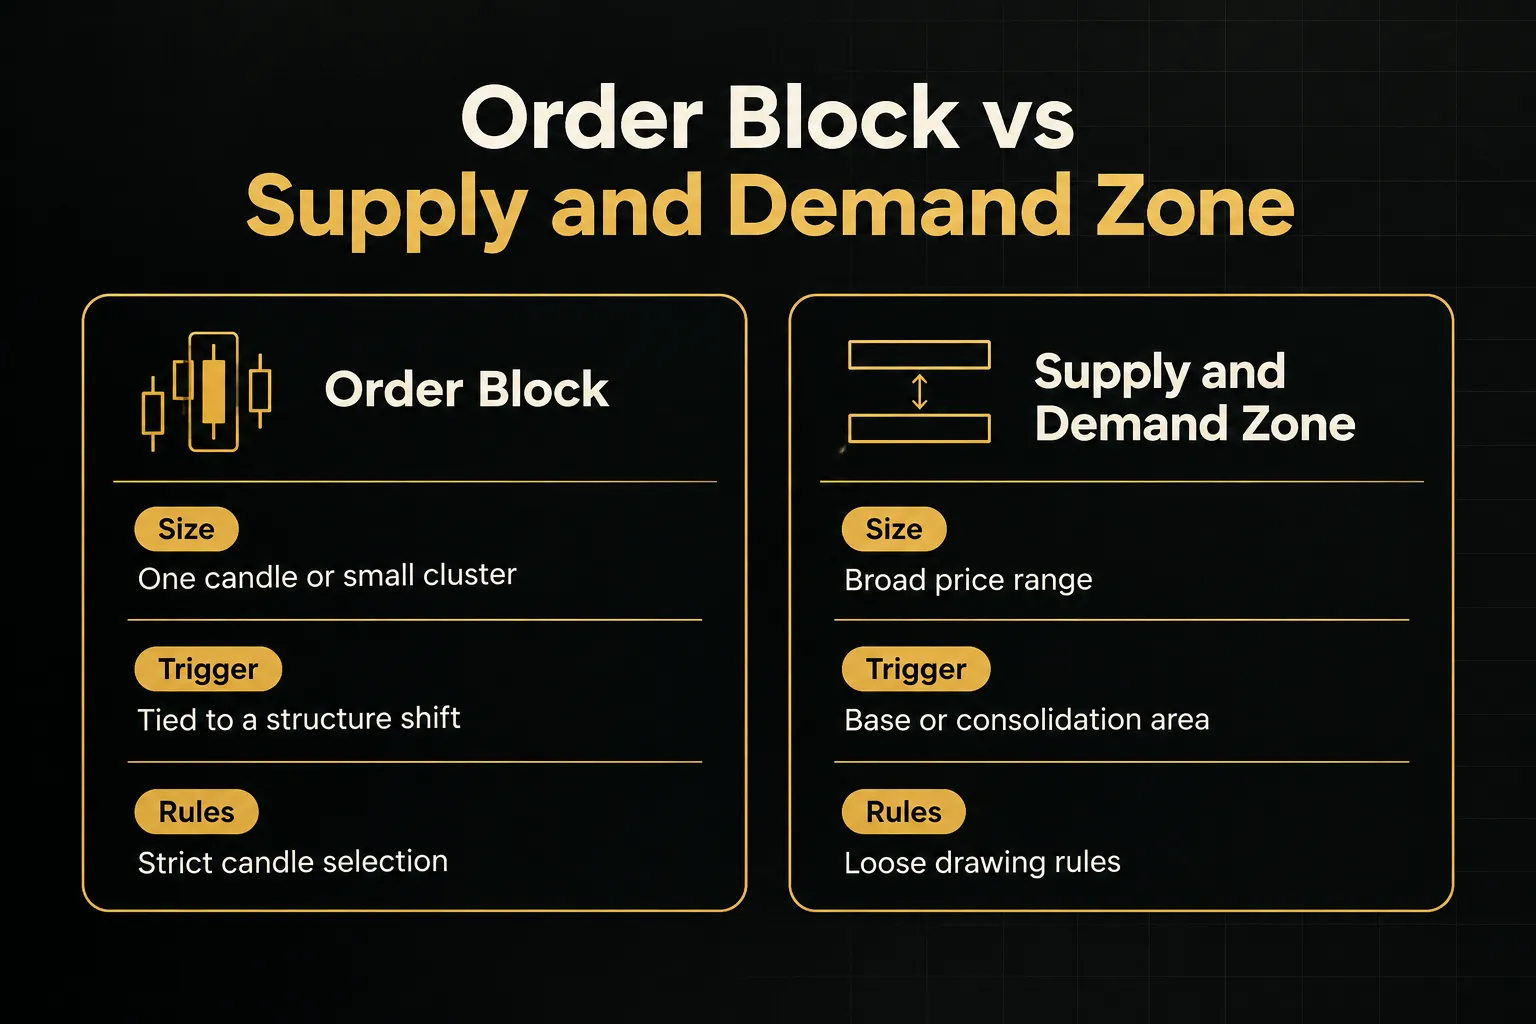
An order block is typically a single candle (or a tight cluster of two or three) tied directly to a structural shift in the market. Supply and demand zones are broader price ranges, often drawn around a base or consolidation, with no strict rule about which candle defines them.
Think of it like zoning in a city.
A supply and demand zone is the whole neighborhood. An order block is a specific address inside it, the exact building where something important happened.
That precision is the appeal.
A tighter zone means a tighter stop and a better risk-to-reward ratio, assuming the zone is drawn on the right candle.
And that assumption is where scripts diverge.
The Last Opposing Candle Model
The classic definition used by most free scripts is simple.
A bullish order block is the last bearish (down-close) candle before a strong impulsive move up. A bearish order block is the last bullish candle before a sharp drop.
The logic: institutions accumulating a large position often push price briefly against their intended direction, filling orders at better prices, before the real move begins. That final opposing candle marks the area where those fills likely happened.
The problem?
“Impulsive move” has to be quantified in code. One script might require the next candle to be 1.5 times the average true range. Another might simply require three consecutive candles in the same direction.
Same chart, different candles marked.
This model also tends to print a lot of zones. Every minor pullback before a push can qualify, which is why last-opposing-candle scripts often look cluttered on lower timeframes.
Structure Break and Volumetric Models
Stricter scripts add a filter: the move away from the candle must produce a break of structure (BOS) or a change of character (CHoCH).
No structural break, no order block.
This cuts the zone count dramatically and links each zone to a meaningful shift in market structure.
The trade-off is timing.
Because the script waits for a swing high or low to be broken, the zone appears only after confirmation, sometimes several candles after the origin candle closed.
Fewer false zones, but later information.
A third family goes further.
Volumetric order blocks weight candles by traded volume, or by footprint-style data such as buy versus sell volume inside the bar, rather than relying on candle shape alone. Some also incorporate a volume profile to find the price level inside the candle where most volume traded, which can narrow the zone further.
Volume-weighted models are appealing because they try to measure participation, not just shape.
But they are only as good as the volume feed underneath them (more on that in the FAQ).
The plain truth: no universally correct order block definition exists.
Comparing two scripts by their chart screenshots tells you almost nothing.
Comparing them by their rule logic tells you exactly what each one is measuring and whether that matches your strategy.
Repainting, Confirmation, and Zone Validity
A beautiful historical chart full of perfectly respected zones is the most persuasive marketing image in trading.
It is also one of the least reliable.
Many of those zones did not exist in that form when the candles were actually printing.
Why Zones Repaint or Disappear
Repainting happens when an indicator’s past output changes after new data arrives. With order block scripts, three technical causes account for most of it.
Unconfirmed candles. Under the Pine Script execution model, a script recalculates on every tick of the live bar.
If a zone is drawn before the bar closes, it can appear, vanish, and reappear several times within one candle as price moves.
Scripts that check barstate.isconfirmed before drawing avoid this.
Pivot confirmation delay. Swing highs and lows need bars on both sides to be confirmed.
A pivot using five bars on the right side cannot exist until five candles after the actual high.
When the script then draws the zone back at the original candle, the history looks instant.
In real time, it was five bars late.
Lookahead bias. Multi-timeframe scripts that request higher-timeframe data incorrectly can pull values from a candle that hadn’t closed yet.
TradingView’s own Pine Script documentation flags this as a common repainting source.
The backtest looks like a crystal ball because, technically, it was one.
This is the core gap between historical calculation and real-time calculation.
On history, each bar is computed once, at its close, with full information. Live, the script works with partial bars and unconfirmed pivots.
A backtest screenshot will almost always look cleaner than live performance.
Checklist for Real-Time Confirmation
You don’t need to read Pine Script to test for this. You need patience and about an hour of screen time.
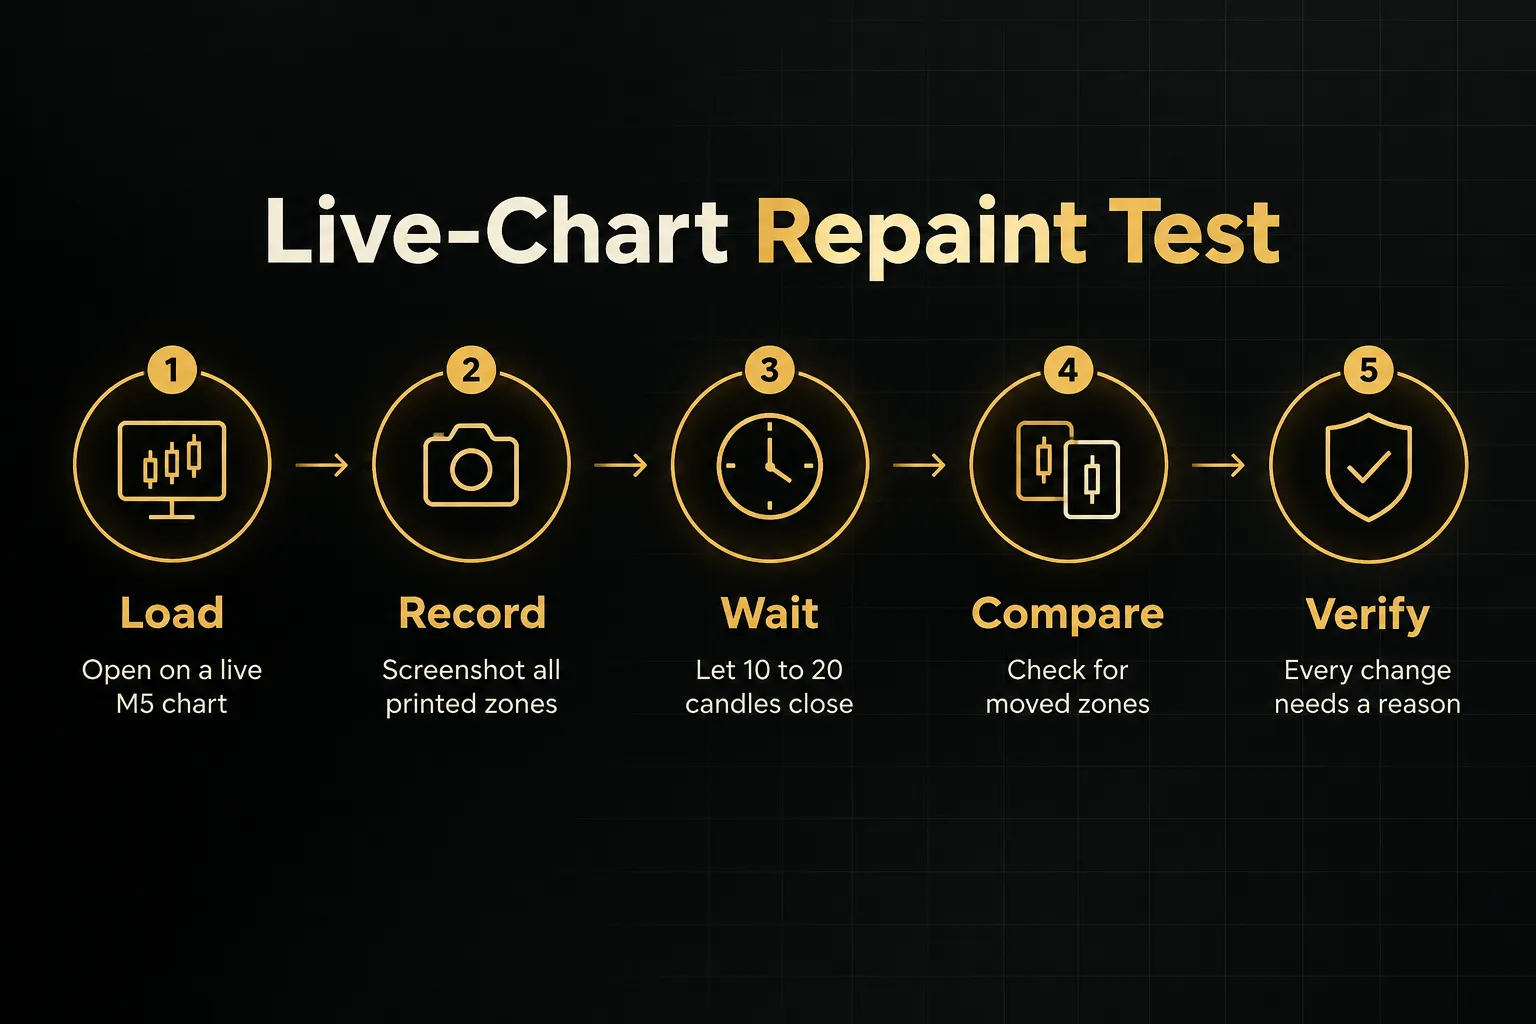
Load the script on a live chart, ideally a lower timeframe like M5 so candles close quickly, and take a screenshot of every zone currently printed.
Then wait through at least 10 to 20 candle closes.
Compare the new chart to your screenshot. Did any zone move, change height, or disappear?
If so, was there a structural reason, such as price closing through it?
Zones that vanish without mitigation, or new zones that appear several bars in the past, are a red flag. A script with true non-repainting confirmation only adds zones on closed candles and only removes them according to stated rules.
Mitigation, Invalidation, and Breaker Blocks
Every zone has a lifecycle.
Knowing which stage it is in matters as much as knowing where it is.
Mitigation occurs when price returns to the zone.
Conventions vary: some scripts count any wick touch, while stricter ones require a candle to close inside or through the zone.
The idea is that the remaining institutional orders at that level have now been filled.
Invalidation means the zone is no longer valid for entries. Usually that is a full candle close beyond the far side of the zone, though some traders also invalidate zones after a fixed time or after a second touch.
A breaker block is a failed zone that flips roles.
When a bullish order block gets decisively broken, it can later act as resistance on a retest, and the reverse is true for bearish zones.
Good scripts track this transition instead of simply deleting the zone.
Finally, check how boundaries are drawn.
Wick-based zones span the full candle range, giving more room for price to react and a wider stop. Body-based zones use only open-to-close, producing tighter entries and smaller stops, but price will slice through them more often.
Neither is wrong.
It just changes your stop-loss math and how precise your entries need to be.
A Rubric for Comparing TradingView Scripts
Searching the TradingView public library for “order block” returns hundreds of results.
Download counts and boosts tell you what is popular, not what is reliable.
A consistent scoring rubric fixes that.
Score each candidate from 0 to 2 on the six criteria below.
A script needs at least 9 out of 12 to earn a spot in your backtesting queue.
Screenshot this table and run every new script through it.
| Criterion | What to Check | Score 2 (Strong) | Score 0 (Weak) |
|---|---|---|---|
| Detection transparency | Open-source code or written rule documentation | Rules for candle selection and impulse threshold clearly stated | Closed source with no explanation of logic |
| Confirmation timing | Whether zones print before or after a break of structure | Timing documented and zones only drawn on closed bars | Zones appear mid-candle or shift on history |
| Alert customization | Available alert conditions in TradingView | Separate alerts for zone entry, confirmation close, and invalidation | No alerts, or one alert firing on every touch |
| Multi-timeframe support | Can plot higher-timeframe zones on a lower chart | HTF zones calculated without lookahead | No HTF option, or HTF zones that repaint |
| Visual clutter | Zone count and display controls | Limit on zones shown, adjustable colors, labels optional | Dozens of overlapping boxes with no filter |
| Zone lifecycle handling | What happens after mitigation | Mitigated zones auto-remove or convert to breaker blocks | Old zones stay forever with no status change |
Some problems should disqualify a script outright, regardless of score. Watch for these red flags: no open-source code or documented rules, no evidence anyone has verified behavior on a live chart, zones that redraw without explanation, and alerts that fire on every single touch of every zone.
That last one sounds minor.
It isn’t.
An alert stream you learn to ignore is worse than no alerts at all.
Building a Complete Order Block Trading System
Ask ten profitable SMC traders what their edge is, and almost none will name an indicator.
They will describe a process.
The indicator only draws the map; the system decides when to walk into the zone.
Setting Bias With Higher Timeframes
Order blocks are not equal across timeframes.
A zone on the Daily or H4 chart represents far more traded volume and far more significance than one on the M1.
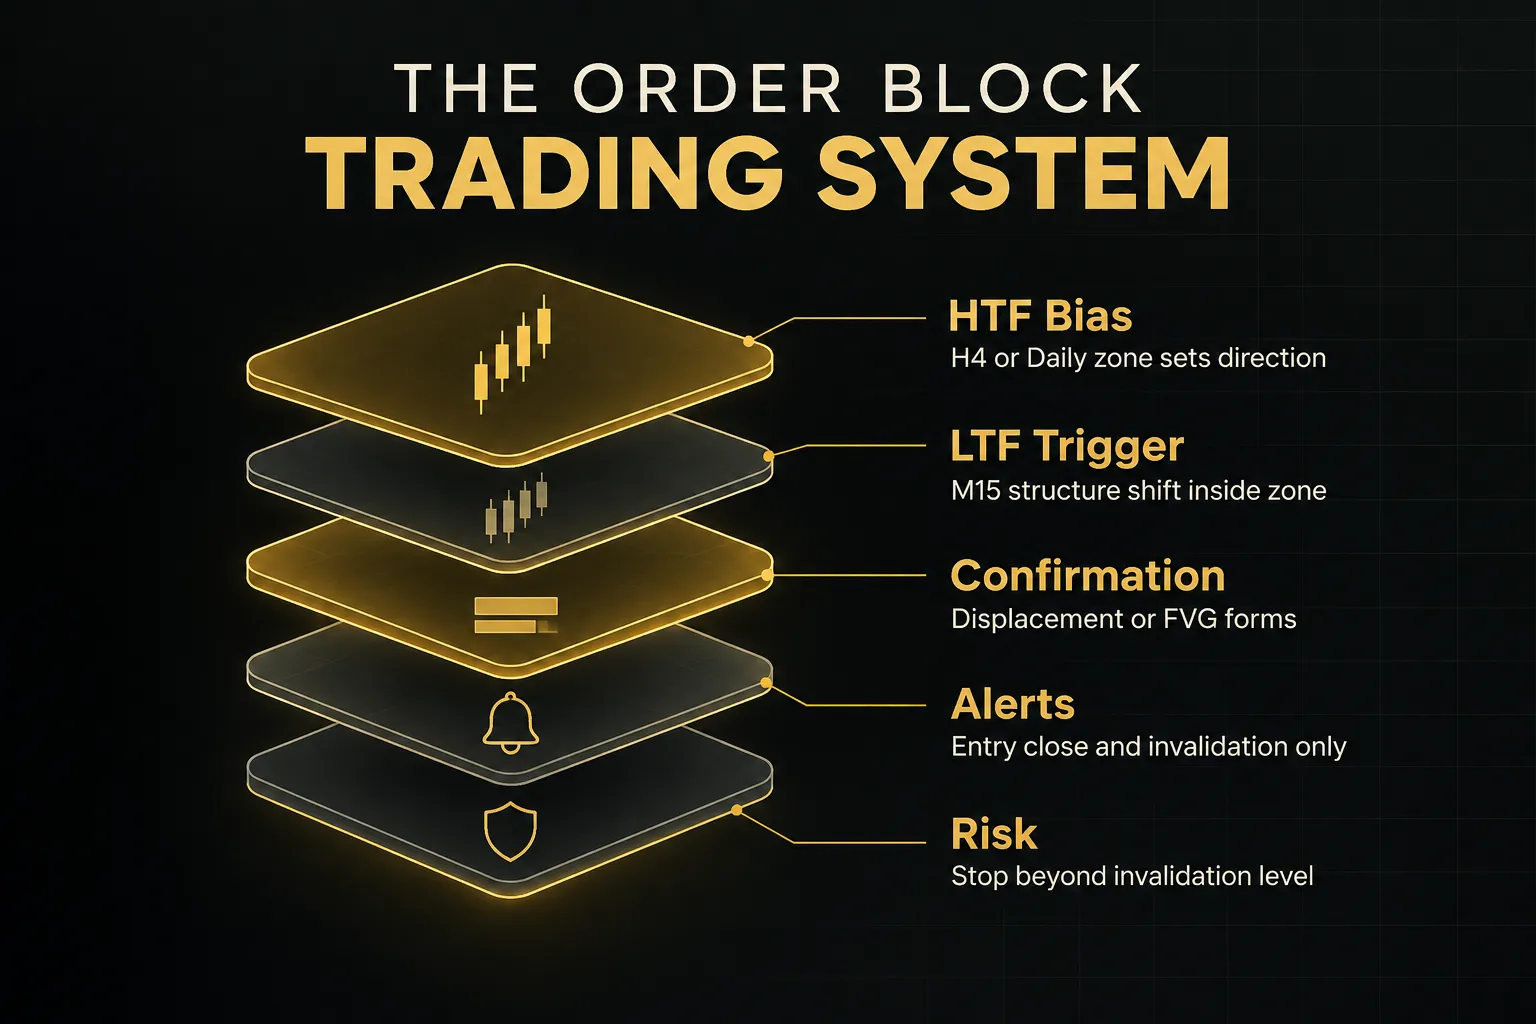
That is why multi-timeframe analysis splits the job in two: the higher timeframe sets directional bias, and the lower timeframe handles entry timing.
Here is a practical example.
On the H4 chart of GBPUSD, price breaks a swing high, confirming a bullish market structure shift, and leaves a bullish order block below.
That is your bias: you are only looking for longs.
When price pulls back into that H4 zone, you drop to the M15.
Now you wait for the lower timeframe to show its own bullish shift inside the higher-timeframe zone.
The H4 tells you where. The M15 tells you when.
This also solves the stop-loss problem.
An H4 order block might be 60 pips tall.
An M15 entry inside it might need a stop of only 15 to 20 pips, which transforms the achievable risk-to-reward ratio on the same idea.
Confirmation Signals and Smarter Alerts
Price touching a zone is not a signal.
It is an invitation to watch.
Before entering, wait for at least one of these confirmations on your entry timeframe:
Rejection wicks show price probing into the zone and getting pushed back out before the close.
A displacement candle, a large-bodied candle moving away from the zone with conviction, signals that fresh orders have stepped in.
A bullish or bearish engulfing pattern at the zone shows a clear shift in control within one or two bars.
Stronger still is a lower-timeframe market structure shift, where price breaks the most recent minor swing in your bias direction.
And if that move leaves a fair value gap behind it (a three-candle imbalance where the wicks of candles one and three don’t overlap), you often have a refined entry point on the retrace into the gap.
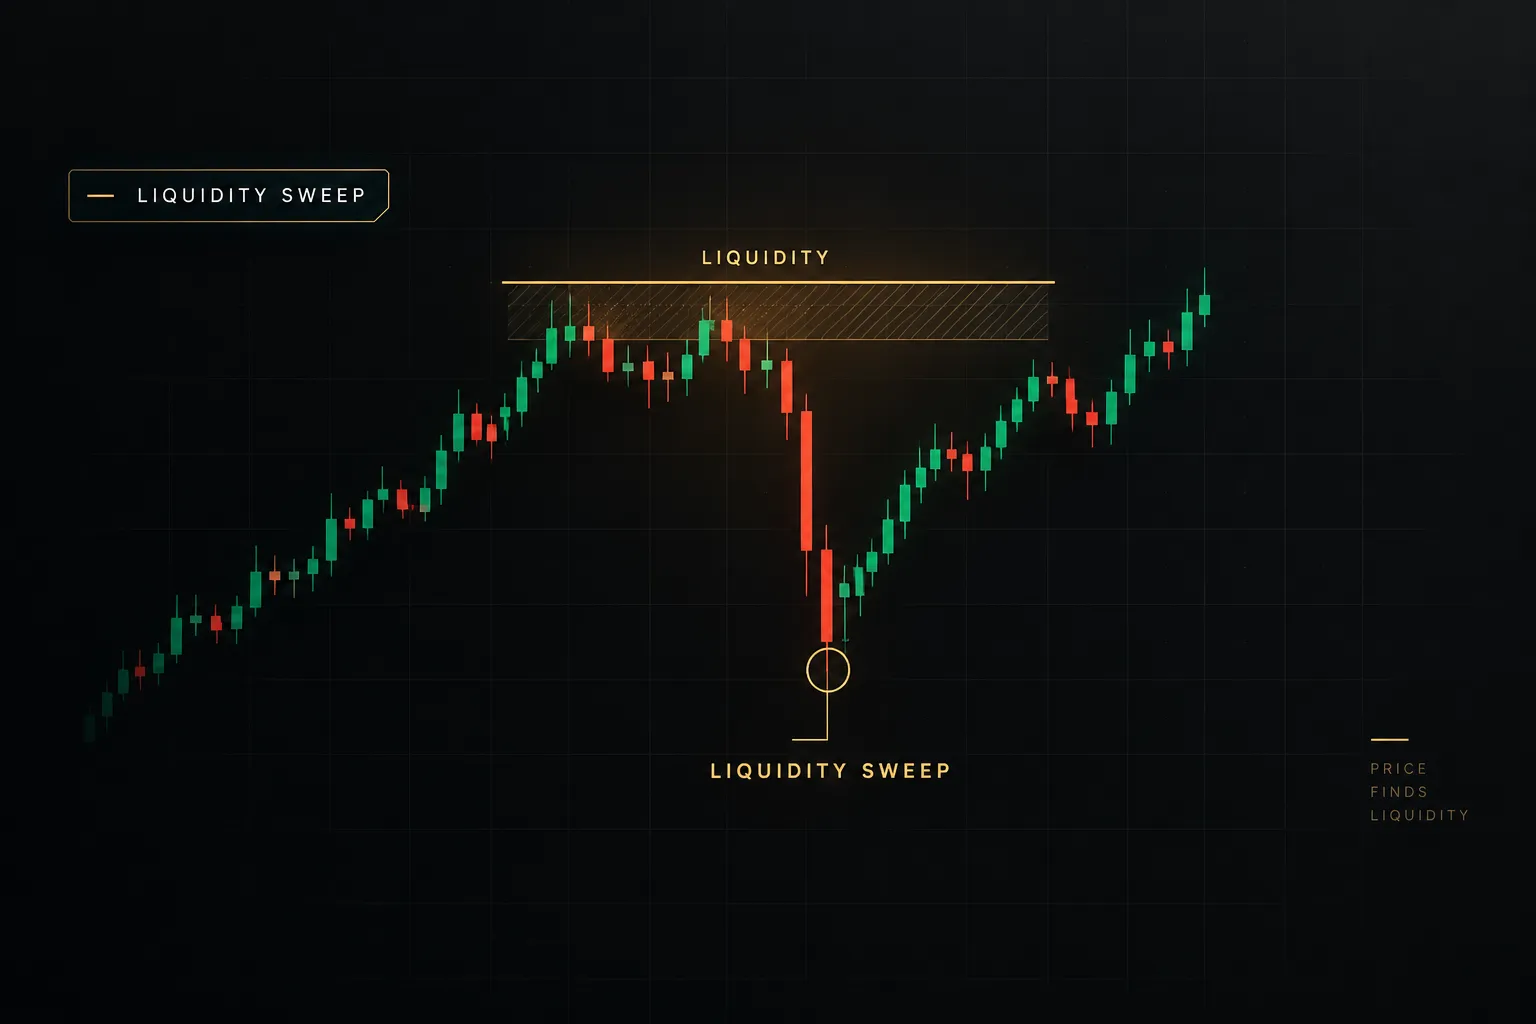
Many traders also look for a liquidity sweep just before the reaction, where price briefly takes out a nearby high or low to trigger stops before reversing.
Checking all of this across several charts gets tedious fast.
A multi-timeframe confirmation table helps.
The 12-timeframe BUY/SELL/NEUTRAL dashboard inside the PipTrend indicator suite, for example, shows trend alignment across timeframes in one panel, so you can confirm that your H4 bias and M15 trigger actually agree before committing, instead of flipping between a dozen charts and eyeballing it.
Then fix your alerts.
TradingView alerts are powerful, but default “price crossing” alerts on every zone create noise.
Configure alerts for three events only: price entering a higher-timeframe zone, a confirmation candle closing on your entry timeframe, and a zone being invalidated.
Set them to trigger “once per bar close” rather than on every tick, which also sidesteps intrabar repainting.
Risk Management and a Repeatable Backtest
Your stop belongs where the trade idea is proven wrong.
For order block trades, that is just beyond the zone’s invalidation level (beyond the wick for wick-based zones, plus a small buffer for spread).
Position sizing then follows from that distance: if you risk 1% of a $10,000 account ($100) with a 20-pip stop, your size is whatever makes 20 pips equal $100.
Win rate alone means little.
What matters is trade expectancy: (win rate × average win) minus (loss rate × average loss).
A strategy winning 40% of trades at an average 2.5R has positive expectancy of 0.4R per trade.
One winning 65% at 0.4R reward per 1R risk loses money over time.
Add a hard maximum daily risk cap, such as 2% or three consecutive losses, after which you stop trading for the day. It protects you from the revenge-trading spiral that turns a bad session into a bad month.
Before any of this goes live, run a repeatable backtesting protocol. Record these components for every test:
Asset and timeframe pair (for example, XAUUSD on H4 bias and M15 entry). Session, since London, New York, and Asia behave very differently. Sample size, at minimum 30 trades, ideally 100. Spread and slippage assumptions, written down in advance. The exact confirmation rule used. And the risk-reward outcome of each trade, logged in R multiples.
Just as valuable: knowing when to sit out.
Skip the order block setup entirely when high-impact news like NFP or a central bank decision is scheduled within the window.
Skip it when structure is ranging and choppy, with no clean swings.
Skip it when displacement away from the zone was weak, when the zone has already been mitigated multiple times, or when your higher-timeframe bias conflicts with the trade direction.
The best trade in those conditions is… no trade.
Common Questions About Order Block Indicators
Which is the best free order block indicator for TradingView?
The best free order block indicator on TradingView is an open-source script whose detection rules you can read and verify on a live chart.
Popular free options include community Smart Money Concepts scripts, such as LuxAlgo’s open-source order block and SMC tools, which publish their logic.
Run any candidate through the six-point rubric above and the live repaint test before trusting it.
What is the most accurate order block indicator?
No order block indicator is objectively the most accurate, because there is no universal definition of an order block to measure against.
Accuracy really means two things: the script draws zones only on confirmed candles without repainting, and its zones produce positive expectancy within your confirmation rules.
Marketing claims of “90% accuracy” are almost always based on repainted historical charts.
How do you use an order block indicator in TradingView?
Use an order block indicator as a zone-of-interest map, not a signal generator.
Add it to a higher-timeframe chart to set bias, mark zones in your trade direction, then drop to a lower timeframe and wait for a confirmation such as a market structure shift or displacement candle.
Set TradingView alerts for zone entry and invalidation so you aren’t watching charts all day.
What is the difference between order blocks and fair value gaps?
An order block is a candle or small cluster where institutional orders are believed to have been filled, while a fair value gap is a price imbalance left by a fast move.
A fair value gap forms across three candles when the first and third wicks don’t overlap.
They often appear together: a strong displacement out of an order block frequently leaves an FVG, and the pairing is considered a higher-quality setup.
Do order block indicators work in forex and crypto?
Order block indicators work in forex and crypto, but data quality varies by market and affects some models more than others.
Price-based models behave similarly everywhere.
Volumetric models are weaker in spot forex and CFDs, where TradingView shows broker-specific tick volume, and in crypto, where volume differs by exchange.
Futures, with centralized exchange volume, give volume-based detection its most reliable data.
How do you know if an order block has been mitigated?
An order block is mitigated when price returns to the zone, and stricter definitions require a candle to close inside or through it.
Check your indicator’s documentation, since some scripts count a single wick touch.
If price closes fully beyond the far edge, treat the zone as invalidated and watch for it to act as a breaker block on the retest.
Pick a Tool, Then Build the Process
The decision rule is simple.
If a script hides its detection rules or redraws zones without explanation, discard it.
If it documents its logic and holds steady through the live-chart test, it qualifies for testing.
Nothing more.
Then prove it.
Run your chosen indicator on a demo account or with small live positions for at least 20 to 30 trades before increasing size, using the backtesting protocol above: same asset, same session, same confirmation rule, every outcome logged in R.
Keep perspective as you go into 2026 and beyond.
An order block marks a zone of interest, not an automatic entry.
Your edge comes from everything layered around it: the confirmation you demand, the alerts that cut noise, and the risk rules that keep you in the game long enough for expectancy to work.
Risk Disclaimer: Trading involves risk. Past performance doesn't guarantee future results. Only trade with money you can afford to lose. PipTrend is a tool to assist your trading decisions, not financial advice.