On this page
Why Every Sweep Isn’t a Reversal
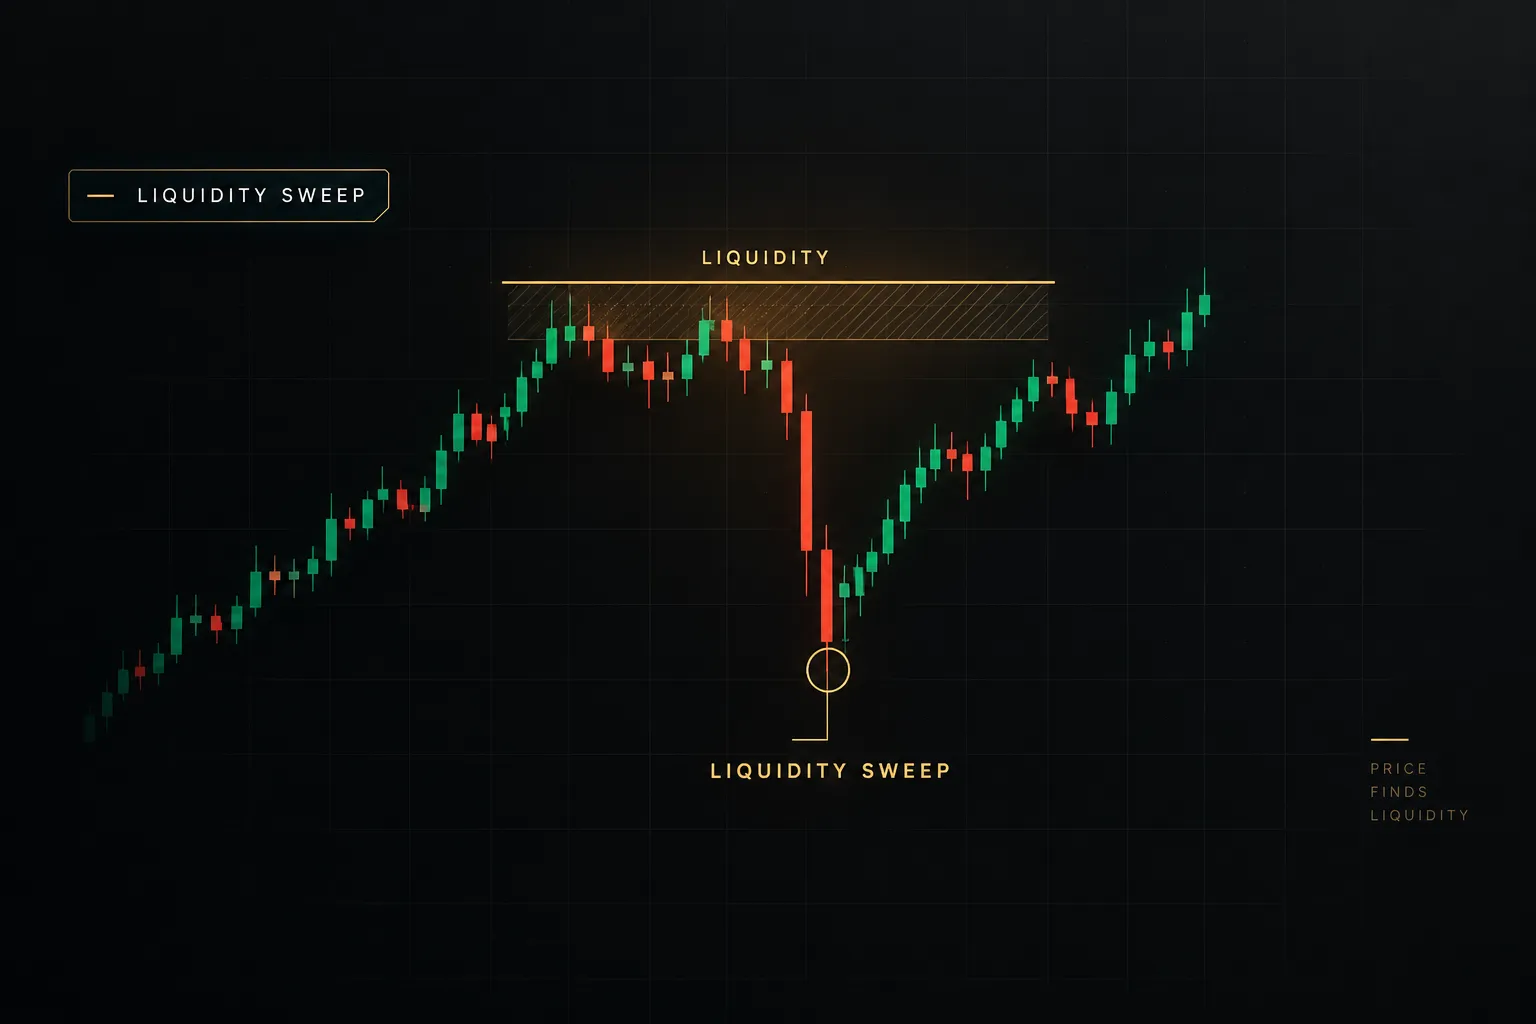
Picture the London session high on EUR/USD. Price spikes four pips above it, prints a long upper wick, and closes back inside the range.
Half the time, that candle marks the top of the day. The other half, price pauses for twenty minutes and then rips another forty pips higher.
Both outcomes are common.
And that is the problem with how liquidity sweep trading is usually taught.
The core misconception goes like this: every wick beyond a high or low is an institutional stop hunt, and every stop hunt must reverse. It sounds logical. Big players need liquidity, stops sit above highs, so price grabs the stops and turns.
But the chart doesn’t read the script.
Sometimes the “sweep” is simply the first leg of a real breakout.
A liquidity sweep is a probability tool, not a certainty. Treat it as a hypothesis that needs confirmation, and it becomes useful. Treat it as a signal on its own, and it becomes expensive.
This guide builds a framework you can actually test. First, the mechanics of how stops and resting orders behave.
Then objective identification criteria, confirmation and risk rules, and the market-specific nuance that separates forex from futures and crypto. Throughout, you’ll see continuation cases next to reversal cases, because learning only from the winners is how traders build false confidence.
The Mechanics Behind Liquidity Sweeps
Markets don’t move because of patterns.
They move because orders get filled.
Understanding market liquidity at the order level strips away most of the mystique around sweeps and replaces it with something far more useful: cause and effect you can observe.
Buy-Side and Sell-Side Liquidity
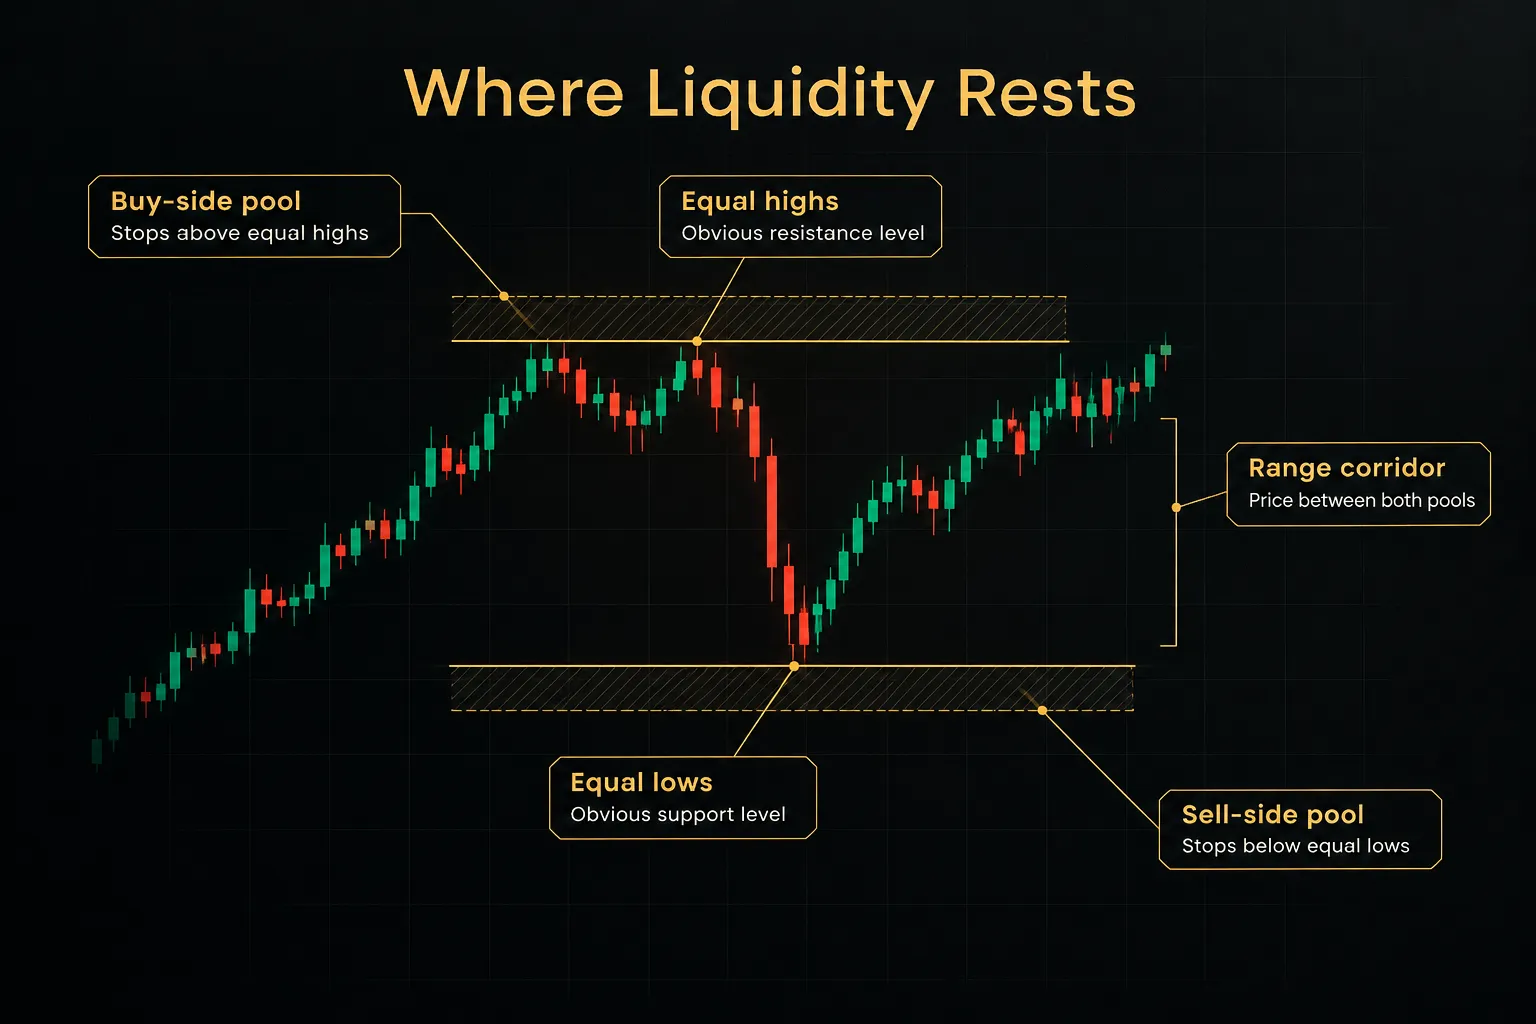
Buy-side liquidity is the pool of resting buy orders sitting above swing highs and swing lows, specifically above the highs. It includes buy-stops from short sellers protecting their positions and buy-stop entries from breakout traders.
When price trades through that level, those orders become buying pressure.
Sell-side liquidity is the mirror image.
It sits below swing lows and contains sell-stops from long traders plus sell-stop entries from breakdown traders. Levels with equal highs and equal lows tend to attract the densest clusters, because they look like obvious “support” or “resistance” to many participants at once.
Imagine a 15-minute chart with three touches at 1.0850 over two sessions and two lows at 1.0805. The zone just above 1.0850 is labeled buy-side liquidity.
The zone just below 1.0805 is labeled sell-side liquidity. Price sitting between them is, in effect, in a corridor with orders stacked at both exits.
How Stop Orders Trigger Cascades
A stop order is dormant until price touches its trigger. Then it converts into a market order and executes at the best available price.
That single fact explains most sweep behavior.
When dozens of stop-loss orders sit within a few ticks of each other, the first trigger pushes price slightly further, which triggers the next batch, which pushes price further still. The result is a burst of speed through the level.
Because market orders consume whatever liquidity is resting in the book, stop order slippage widens as the cascade runs, and fills land worse than the trigger price.
Here’s what the market microstructure doesn’t prove: deliberate intent.
A large participant may be filling a position against that burst of stop liquidity. Or the move may simply be a cluster of stops tripping in thin conditions.
The chart shows the same shape either way.
So separate what you can observe from what you can’t. Observable: how far price penetrated the level, where the candle closed, whether volume and volatility spiked, and how quickly price returned. Unverifiable: who was on the other side and why.
Build rules on the first list only.
Sweep vs Stop Hunt vs Liquidity Grab
Traders use these terms interchangeably, which creates confusion when comparing setups.
Precise language forces precise rules.
Here is one differentiating trait for each:
Liquidity sweep: price trades beyond a known level, triggers resting orders, and closes back inside the prior range. The close is what defines it.
Stop hunt: the same price action, but the term implies deliberate intent to trigger retail stops. It describes motive, which you can’t verify.
Liquidity grab: a very fast, shallow poke beyond a level, often a single candle wick, with an immediate snap back. Think of it as a short-duration sweep.
Liquidity run: price takes out a level and keeps going toward the next pool. The orders fuel continuation, not reversal.
Breakout retest: price breaks a level, closes beyond it, then returns to test it from the other side. Acceptance, not rejection.
Rejection wick: a long wick at any price, with no requirement that a meaningful level was breached. It’s a candle feature, not a liquidity event.
Spotting a Sweep on the Chart
Ask ten traders to mark sweeps on the same chart and you’ll get ten different answers.
That’s the guesswork this section removes.
If you can’t define a setup in numbers, you can’t backtest it, and if you can’t backtest it, you’re trading a feeling.
Objective Criteria for a Valid Sweep
Start with four measurable criteria. The thresholds below are reasonable starting points; your job is to test and refine them for your market and timeframe.
Minimum penetration. Price must trade beyond the prior level by a defined amount, such as 0.1 to 0.25 of the current 14-period ATR. Anything smaller is often noise or spread variance, not a genuine trigger of resting orders.
Speed of reclaim. Price should return inside the level within one to three candles on your execution timeframe. The longer price lingers outside, the more likely the market is accepting those prices.
Close location. The sweep candle should close in the opposite third of its range. For a buy-side sweep, that means a close in the lower third, showing sellers absorbed the stop-driven buying.
Displacement on the return. The move back should be forceful: a candle body at least 1.5 times the average of the prior 10 bodies. Weak drifts back inside the range rarely hold.
Reversal Signs vs Continuation Signs
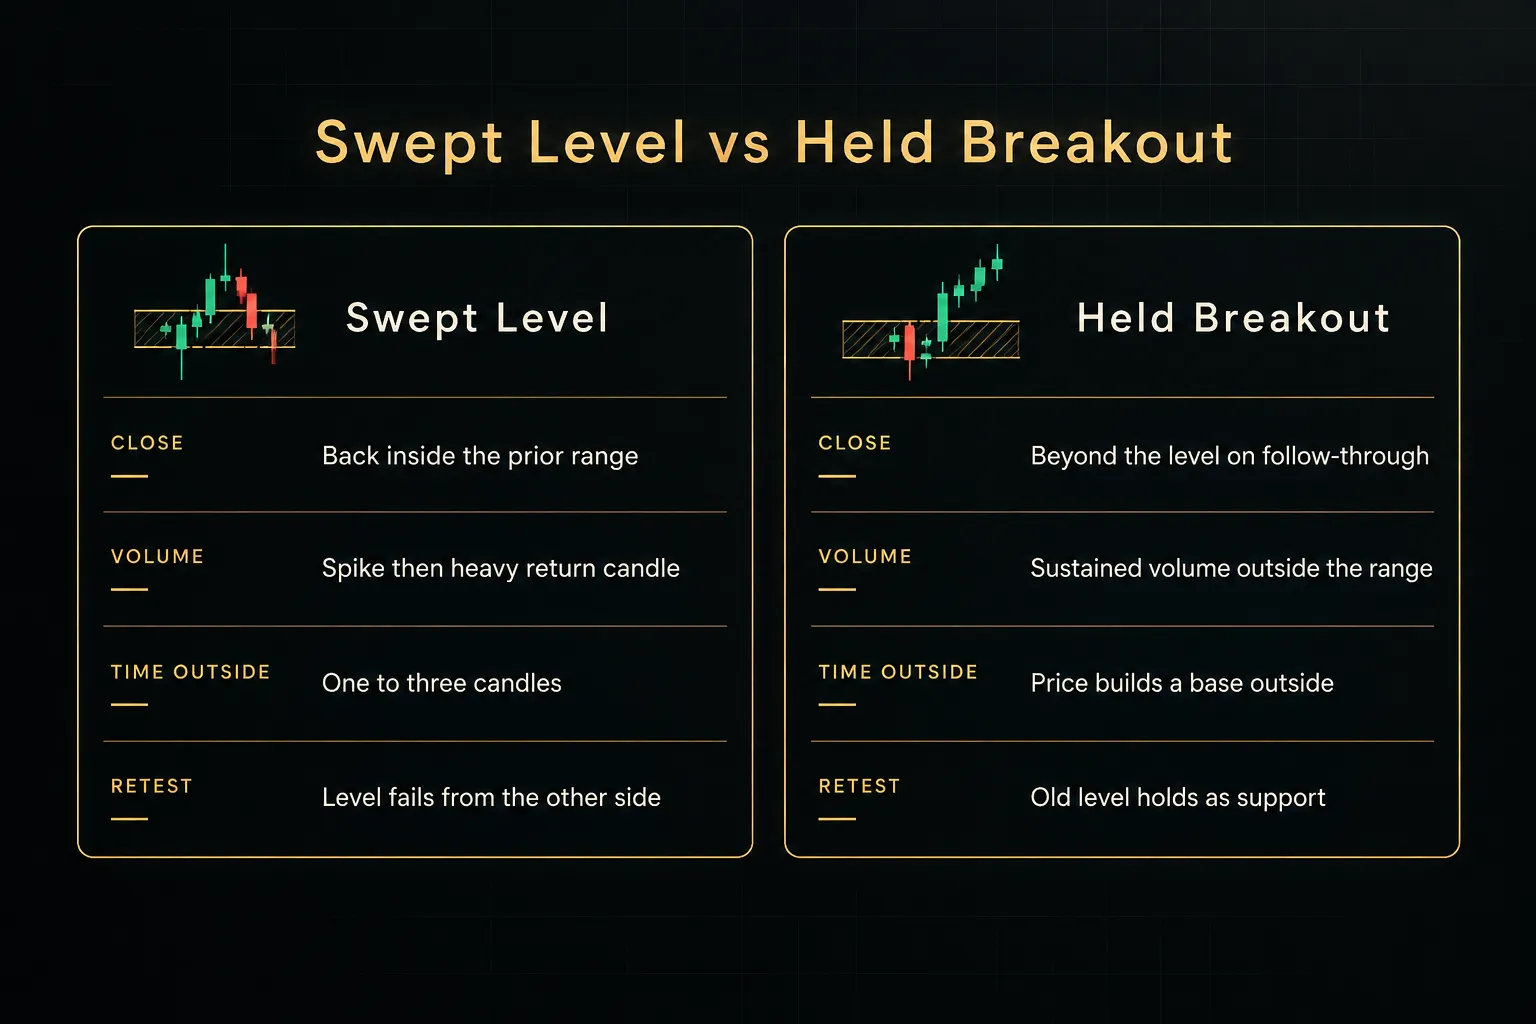
A false breakout and a held breakout look identical for the first few minutes. The difference shows up in what price does next.
Rejection means price visited the new level and refused to stay. Acceptance means price found enough two-way business out there to build a base.
Volume confirmation helps separate them.
A sweep that reverses typically shows a volume spike on the penetration followed by strong volume on the return candle. A held breakout shows sustained volume above the level, with subsequent candles closing beyond it and pullbacks holding the old level as support or resistance.
Now the uncomfortable examples.
In choppy, range-bound sessions, price may sweep the high, reverse, sweep the low, reverse again, and never produce a clean follow-through.
Every individual sweep looked valid.
Every trade lost.
The fix isn’t better sweep detection; it’s recognizing a low-conviction environment and standing aside.
Then there are news-driven spikes.
A CPI release or central bank decision can blow through both sides of a range in seconds. The wick looks like a textbook sweep, but it’s economic news volatility, driven by repricing rather than stop clusters.
Spreads are wide, fills are unreliable, and the “reversal” is often just the market finding its new fair price. Treat the first 5 to 15 minutes after major releases as off-limits for sweep entries.
Structure Shifts and Fair Value Gaps Defined
Four terms do most of the confirmation work. One sentence each:
Displacement is an impulsive, large-bodied move that shows one side overwhelmed the other.
Change of character (CHoCH) is the first break of a minor swing point against the prevailing short-term trend, signaling momentum may be turning.
Market structure shift (MSS) is a confirmed break of structure against the prior trend, usually through a more significant swing point, with a close beyond it.
Fair value gap (FVG) is a three-candle pattern where the wicks of the first and third candles don’t overlap, leaving an inefficient price zone the market often revisits.
The sequence matters.
Displacement comes first, because it usually creates both the fair value gap and the structure break. The change of character follows as the earliest structural hint.
The market structure shift is the stronger confirmation. The fair value gap then becomes a potential entry zone on the retracement, not a confirmation on its own.
From Signal to Trade: Entry Rules
Spotting a sweep is the easy part.
Converting it into a trade with defined risk is where most accounts bleed out. The good news?
Entry rules can be written down, tested, and followed without judgment calls in the moment.
Confirmation Sequence Before Entry
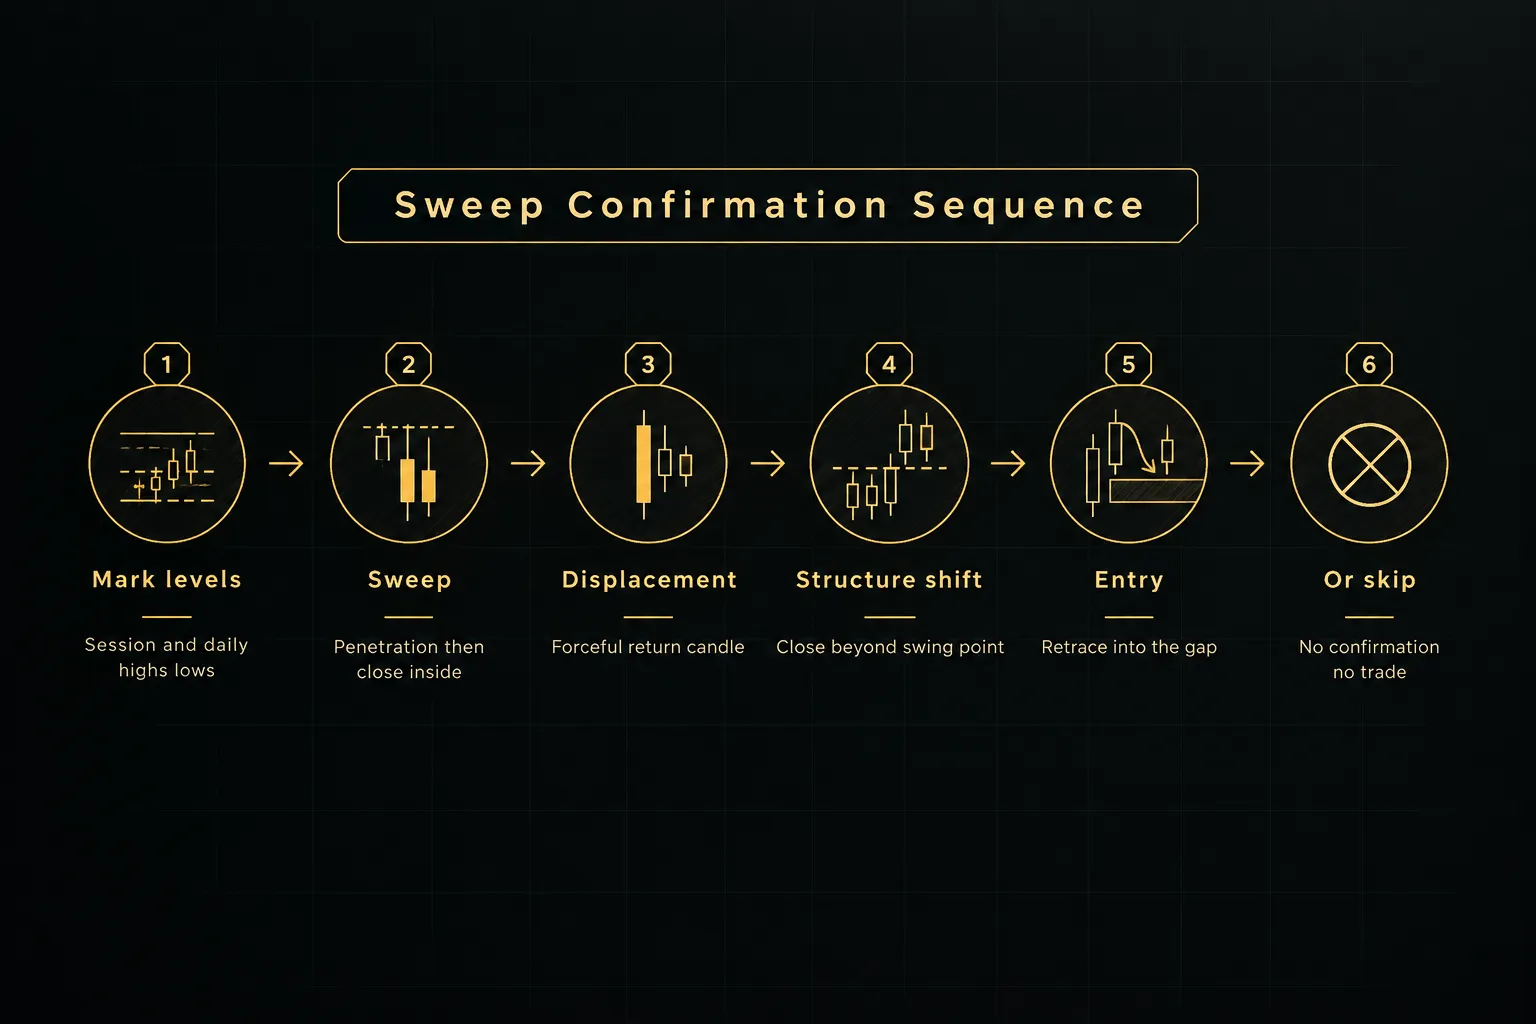
Every sweep presents four choices, and each trades speed for reliability. Decide in advance which one your system uses.
Option 1: Enter on displacement. You enter as soon as the forceful return candle closes.
This gives the best price and the largest risk-to-reward ratio, but the lowest confirmation. Expect more stop-outs from sweeps that turn into liquidity runs.
Option 2: Wait for a reclaim. You enter after price closes back inside the level and holds for at least one more candle.
Slightly worse price, fewer false starts.
Option 3: Wait for a structure shift. You enter only after a market structure shift, often on the retracement into the fair value gap it created.
This is the most conservative option. You’ll miss some fast reversals entirely, and that’s the price of filtering out weak ones.
Option 4: Skip. If the sweep occurs into scheduled news, against higher-timeframe bias, or in a choppy range, no entry.
Skipping is a position.
Stop-Loss Placement That Accounts for Slippage
The classic stop placement is a fixed distance beyond the swept extreme, for example 3 pips on EUR/USD or 2 ticks on ES futures. It’s simple and easy to backtest.
But fixed distances ignore how much the market is actually moving.
A volatility-adjusted stop uses volatility and ATR: place the stop 0.25 to 0.5 ATR beyond the sweep extreme. On a quiet Asian session, that might be 3 pips. During the London-New York overlap, it might be 8.
The stop breathes with conditions instead of fighting them.
Spread, session, and slippage shift the right choice. Spreads can widen dramatically at the daily rollover (around 5 p.m. New York time) and around news, which means a tight fixed stop can get hit by the spread alone.
Thin sessions also produce worse fills when your stop does trigger.
Ironically, you become part of the next stop cluster.
As a rule, use ATR-based stops when volatility varies meaningfully across your trading window, and add your average spread on top of whatever distance you calculate.
Position Sizing and Expected Value
Position sizing starts with a hard cap: most professional risk frameworks limit risk to 0.5% to 1% of account equity per trade. Your position size is that dollar amount divided by the distance to your stop.
A wider ATR stop means a smaller position, not a bigger risk.
Then check expected value.
The formula is simple: (win rate × average win) minus (loss rate × average loss). Say your backtest shows a 45% win rate with an average winner of 2R and losers of 1R. Expected value is (0.45 × 2) minus (0.55 × 1), which equals 0.35R per trade.
Positive, and worth trading.
Now add reality.
If slippage and spread cost you an average of 0.1R on entry and another 0.1R on exit, your edge drops from 0.35R to roughly 0.15R.
That’s more than half your edge gone, and you never “made a mistake.”
Small frictions compound over hundreds of trades. This is why an entry method with a slightly lower win rate but cleaner fills can outperform one that looks better on paper.
A strategy’s backtest shows its gross edge. Your trade journal shows its net edge. Only one of those pays the bills.
Where Indicators Fit In
Indicators don’t find sweeps.
They filter them.
Used correctly, they help you reject setups that look good on one timeframe but fight everything else.
PipTrend’s multi-timeframe table is built for exactly this layer of multi-timeframe analysis. If you spot a buy-side sweep on the 5-minute chart but the 1-hour and 4-hour readings are strongly bullish, that sweep is more likely to become a liquidity run than a reversal.
Alignment raises the odds; conflict is a reason to wait.
Its session and VWAP levels give you objective reference points for session liquidity: the Asian range, London high and low, and where price sits relative to volume-weighted value. A sweep of the London high that closes back below VWAP carries more weight than one that happens in the middle of nowhere.
The Confidence Band adds a further filter by showing whether current conditions support directional follow-through or look more like chop.
Be clear about what these tools do.
They validate a sweep hypothesis and screen out weak setups. They don’t prove institutional intent, and they don’t guarantee the trade. The decision still rests on your predefined rules and risk limits.
Testing the Strategy Across Markets
Most sweep strategies are “tested” by scrolling back through charts and spotting the beautiful reversals.
That’s not a backtest.
That’s a highlight reel, and it will lie to you every single time.
A Backtesting Protocol That Avoids Hindsight Bias
Write the rules before you open the chart. Penetration threshold, reclaim window, close location, displacement size, confirmation type, stop method, target.
If a rule isn’t written, it doesn’t exist during testing.
Then log everything, not just trades taken. Record missed trades (setups that met every rule but you didn’t mark), near-misses (setups that failed one criterion), and how each played out.
Near-misses are gold.
If they perform as well as full setups, a rule may be unnecessary. If they perform worse, the rule is earning its place.
Separate outcomes by type.
Tag each sweep as a reversal, a continuation (liquidity run), or chop. Many traders discover their “sweep reversal” strategy is actually profitable only in specific sessions, while continuation cases cluster around trending days.
Track sample size honestly: 30 trades tell you very little, and 100 or more across different market conditions starts to mean something.
Remember, too, that a visible liquidity pool is a hypothesis. You’re inferring that stops cluster above equal highs, but you can’t see them.
Your backtesting should reflect that uncertainty by including sweeps of levels that didn’t produce any meaningful reaction.
Those count.
Forex, Futures, and Crypto Differences
The same chart pattern behaves differently depending on how orders actually meet.
Order flow structure changes everything.
Futures trade on centralized exchanges like CME, with a single order book and published volume. Every participant sees the same high and low.
This makes levels cleaner and volume confirmation more reliable, and slippage is generally predictable in liquid contracts like ES or NQ during regular hours.
Forex is decentralized.
Your broker’s price comes from a dealer or ECN aggregation, so the “session high” on your chart may differ slightly from another broker’s. Volume data is tick volume, a proxy rather than true traded volume.
Sweeps still work, but penetration thresholds need extra tolerance and spread widening matters more.
Crypto adds liquidation clusters.
With high leverage common on perpetual futures, forced liquidations can produce violent sweeps far beyond obvious levels. Liquidity is fragmented across exchanges, markets run 24/7, and weekend order books are thin.
Expect sharper wicks and wider slippage than in forex or futures.
Across all three, filter from the top down. Establish higher-timeframe bias first.
Prioritize sweeps of daily and weekly highs and lows over random intraday swings. Favor session highs and lows (Asian, London, New York) as reference levels.
And check the economic calendar before every session, so no lower-timeframe sweep gets taken into a scheduled release.
FAQ
What is a liquidity sweep in trading?
A liquidity sweep is a price move beyond a key high or low that triggers resting orders and then closes back inside the prior range. It reflects stop orders converting into market orders, as covered in the mechanics section.
On its own, it doesn’t guarantee a reversal.
How do you trade a liquidity sweep?
You trade a liquidity sweep by waiting for defined confirmation, then entering with a predefined stop and position size. Most traders use displacement followed by a market structure shift, with entry on a retracement into the resulting fair value gap.
The pattern is only the starting point; the rules make it tradeable.
What is the difference between a liquidity sweep and a liquidity grab?
A liquidity grab is a faster, shallower version of a sweep, usually a single-candle wick with an immediate snap back. A sweep may take one to three candles to reclaim the level.
Both describe price behavior, not proven intent.
How do you identify buy-side and sell-side liquidity?
Buy-side liquidity sits above swing highs, and sell-side liquidity sits below swing lows. The strongest pools form at equal highs and equal lows, prior session extremes, and daily or weekly highs and lows.
Treat each as a likely order cluster, not a confirmed one.
What confirms a liquidity sweep?
Displacement followed by a market structure shift is the most reliable confirmation. Supporting evidence includes a close in the opposite third of the sweep candle, rising volume on the return move, and alignment with higher-timeframe bias.
See the identification section for measurable thresholds.
Are liquidity sweeps profitable?
Liquidity sweeps can be profitable when traded with rules-based confirmation and strict risk management. The pattern alone has no guaranteed edge, since many sweeps become continuation moves.
Profitability depends on your tested win rate, reward-to-risk, and real-world costs like slippage and spread.
The Bottom Line on Liquidity Sweeps
Liquidity sweep trading works best when you stop expecting it to predict the future. A sweep describes price behavior and shifts probabilities.
It doesn’t promise a reversal, and it never proves what large players are thinking.
Here’s your next action.
Before tomorrow’s session, mark the Asian, London, and New York highs and lows, plus the prior day’s and week’s extremes. Write down the exact confirmation you’ll require.
Then wait.
The decision rule is simple.
If displacement and a structure shift both confirm, take the trade with predefined risk. If only the wick appears… wait, or skip it entirely.
As of 2026, the edge isn’t in seeing sweeps.
It’s in the discipline to trade only the ones that earn it.
Sources
- Investor.gov: Stop, Stop-Limit, and Trailing Stop Orders
- New York Fed: Stop-Loss Orders and Price Cascades in Currency Markets - FEDERAL RESERVE BANK of NEW YORK
- FINRA: Stop orders factors consider during volatile markets
- CME Group: Liquidity and Immediacy
- CFTC: Customer Advisory: Eight Things You Should Know Before Trading Forex
Risk Disclaimer: Trading involves risk. Past performance doesn't guarantee future results. Only trade with money you can afford to lose. PipTrend is a tool to assist your trading decisions, not financial advice.