On this page
What Smart Money Concepts Actually Means
No retail chart can show you a bank’s order book.
Yet thousands of traders talk about “seeing” institutional orders on a five-minute candle chart. That gap between what the chart shows and what people claim it shows is where most confusion about the SMC trading strategy begins.
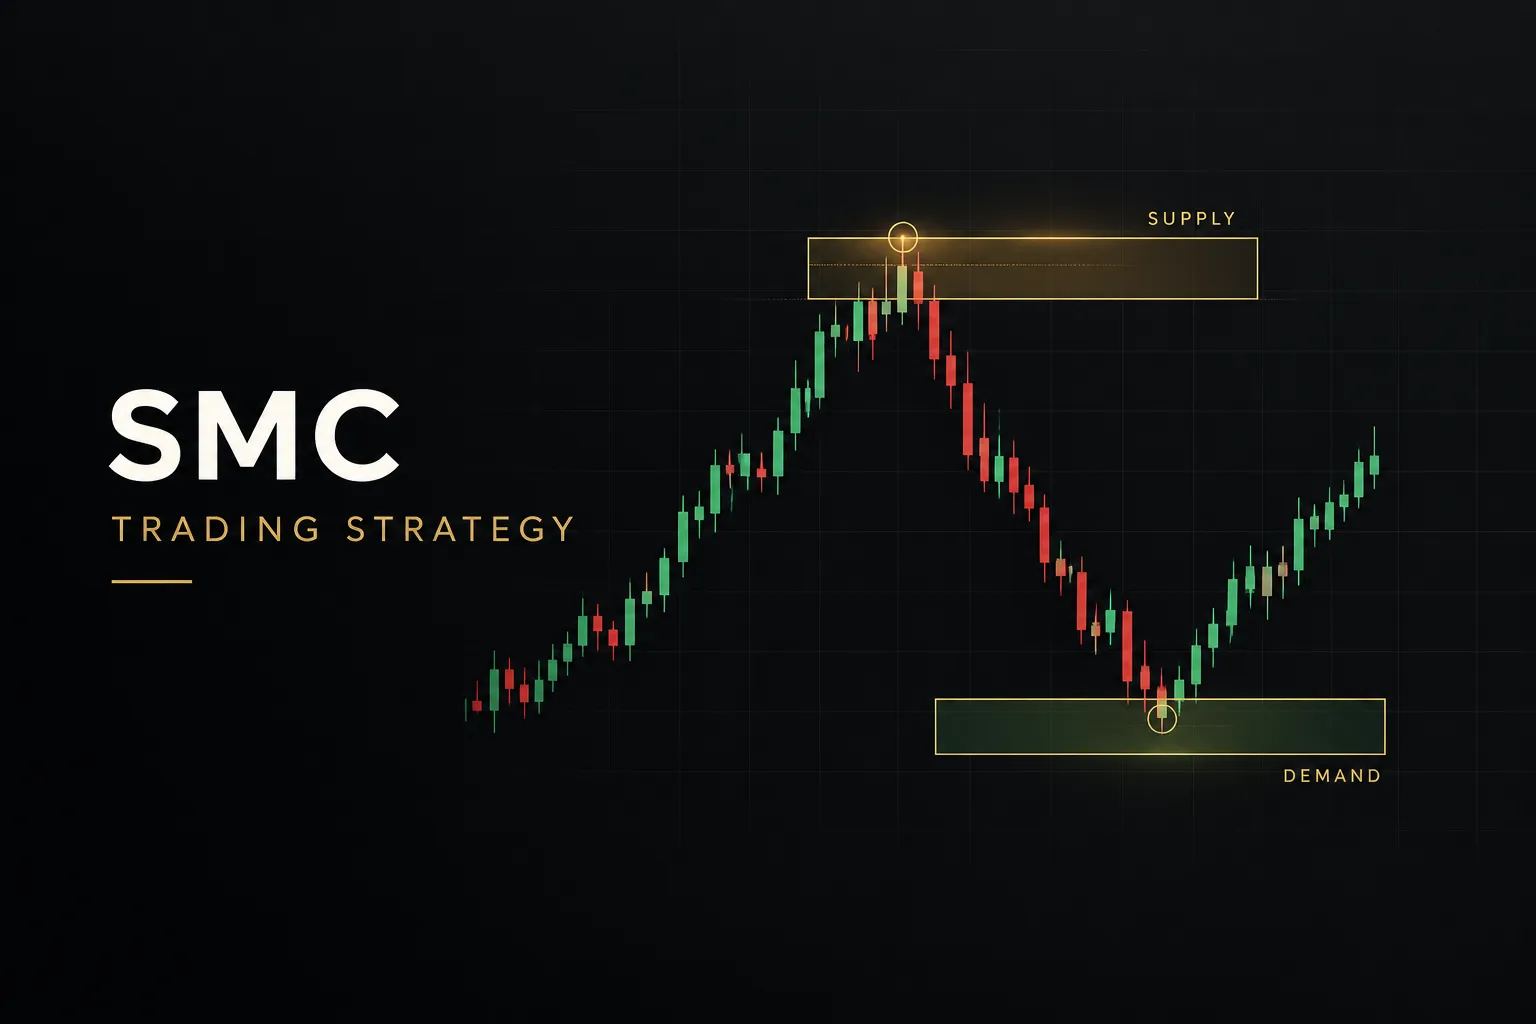
Smart money concepts (SMC) is a price-action framework for interpreting charts through three lenses: swing structure, liquidity, and imbalance. It assumes large participants leave footprints in price, such as sharp moves, unfilled gaps, and stop runs.
It does not give you direct visibility into institutional order flow.
Most of the vocabulary comes from ICT (Inner Circle Trader), the teaching brand of Michael J. Huddleston. Over roughly the last decade, online communities generalized and rebranded his material into what is now broadly called SMC.
The two overlap heavily, but the naming drifts.
- Shared terms: order block, fair value gap, liquidity, displacement, premium and discount, dealing range.
- Different labels: ICT calls a reversal signal a “market structure shift” (MSS), while most SMC material calls it a “change of character” (CHoCH).
- Different emphasis: ICT leans heavily on time-of-day models like kill zones, while generic SMC content focuses more on structure and zones.
So here is this guide’s stance, stated plainly.
Every pattern described below is an observable, testable chart event. You can define it with candle closes and check it on historical data.
Claims about “bank orders” or “smart money intent” are inferences, not verified facts. Trade what you can define. Treat the story as optional.
That distinction keeps you honest. When a setup fails, you can ask whether your rules were followed, rather than wondering why “the banks” changed their minds.
Most SMC tutorials list concepts in isolation, which is why beginners end up with charts covered in boxes and no plan. This guide builds toward a single connected workflow: bias, liquidity, sweep, structure shift, zone entry, invalidation, target.
Each section adds one link to that chain.
Reading Market Structure Like a Trader
Ask ten SMC traders to mark the same swing high and you will often get ten different answers.
That is not a skill problem.
It is a definition problem, and fixing it is the first step to a strategy you can actually test.
Swing Points and Trend Direction
Use a rule you can apply mechanically. A swing high is a candle whose high exceeds the highs of the candles immediately on both sides, and it is confirmed only after the candle to its right has closed.
A swing low is the mirror image.
Once swings are defined, market structure follows.
An uptrend is a sequence of higher highs and higher lows. A downtrend prints lower highs and lower lows.
When that sequence breaks, for example an uptrend fails to make a new higher high and then takes out its last higher low, the trend is in question.
Not reversed. In question.
BOS vs CHoCH, Defined
A break of structure (BOS) is a candle close beyond the prior swing in the direction of the existing trend. In an uptrend, closing above the last swing high is a BOS.
It signals continuation.
A change of character (CHoCH) is a close beyond the prior swing against the trend. In an uptrend, that means closing below the last higher low.
It flags a potential reversal, and ICT traders would call the same event a market structure shift.
Notice the word “close.”
A wick through a level is not a BOS under this rule. That single requirement removes a huge amount of ambiguity.
Why Displacement Matters
Not every structure break deserves attention.
Displacement is one or more large-bodied candles with small wicks that break structure with clear momentum. Many traders quantify it, for example requiring a candle body at least 1.5 times the average body of the previous 20 candles.
Displacement works as a noise filter. A slow, overlapping drift through a swing high is a weak BOS, while a single aggressive candle through the same level suggests real commitment.
If this sounds familiar, it should.
A BOS is a breakout through resistance. A CHoCH is a failed trend that breaks its last support. SMC reframes classic support, resistance, and breakout logic with tighter definitions.
It is not a new discipline.
Order Blocks, FVGs, and Liquidity
Here is the uncomfortable truth about zones.
If you draw every possible order block on a chart, price will touch one of them almost every hour. That makes the concept useless unless you filter hard.
What Makes an Order Block Valid
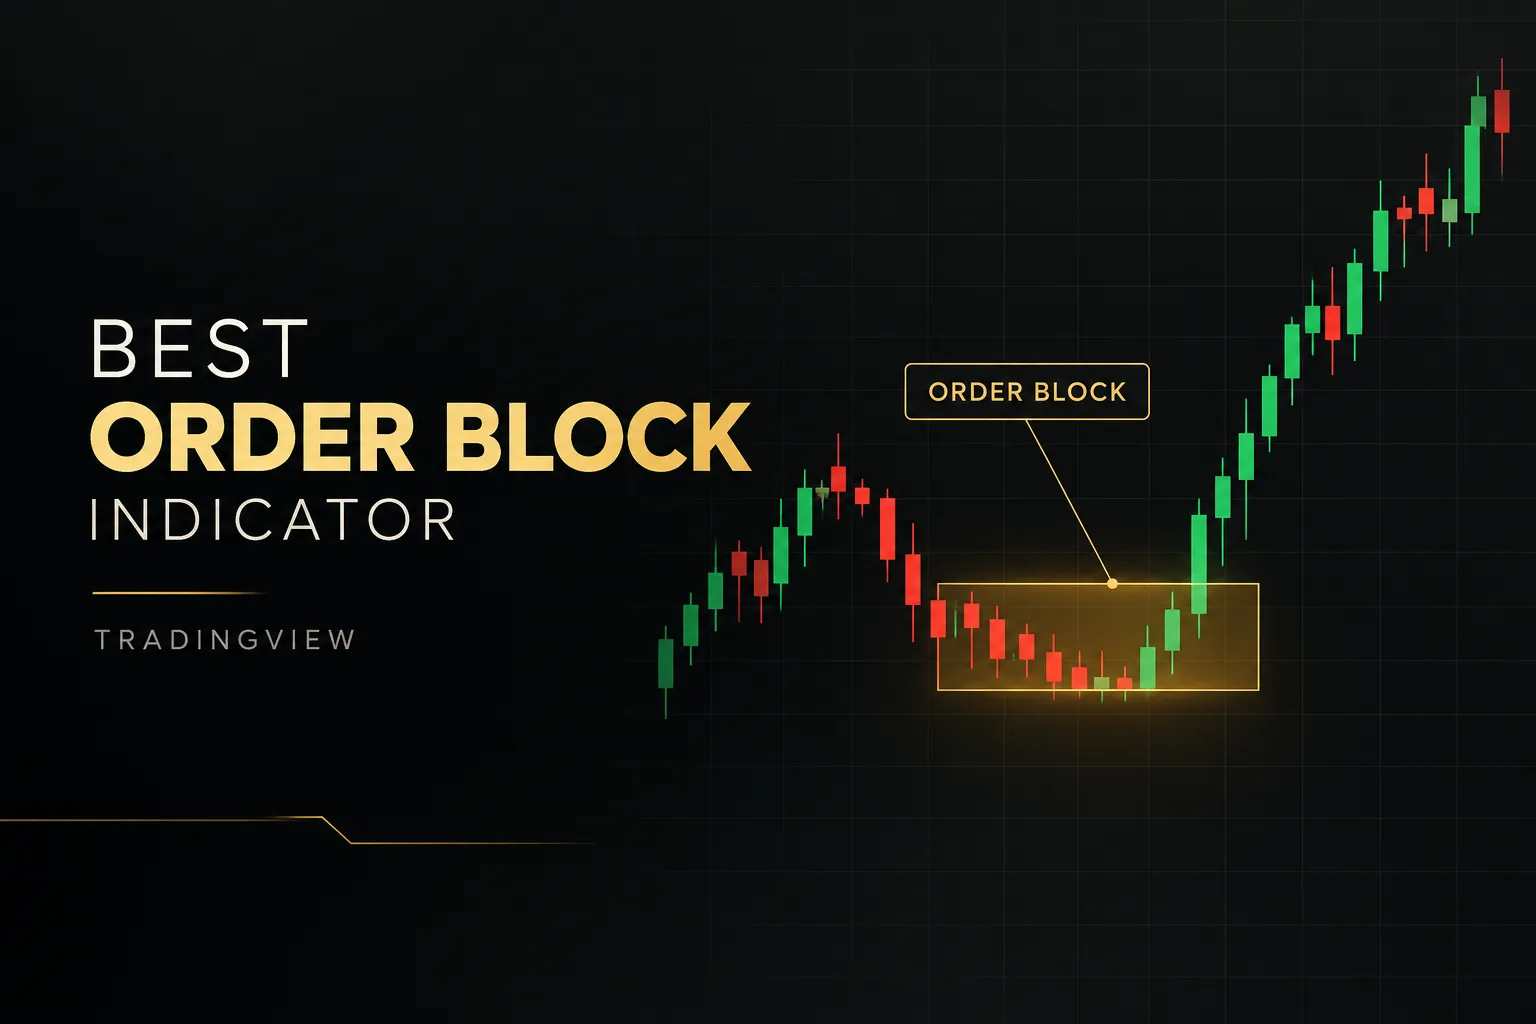
An order block is the last opposite-colored candle before a displacement move that breaks structure. For a bullish order block, that is the final bearish candle before a strong bullish move that produces a BOS or CHoCH.
The zone typically spans that candle’s high to low (some traders use open to low for a tighter entry).
One more condition matters: the zone counts only if it remains unmitigated, meaning price has not returned to it since it formed. Apply these quality filters before treating any order block as tradable:
- Higher-timeframe alignment: a bullish order block inside a bullish Daily or H4 bias beats one fighting the larger trend.
- Displacement strength: the move away from the zone should be decisive, ideally leaving a fair value gap behind.
- Freshness: recent, untouched zones tend to be more reactive than ones formed dozens of sessions ago.
- Proximity to liquidity: zones that sit just beyond a pool of resting stops, such as equal lows, are higher quality because a sweep often precedes the reaction.
- Prior taps: if price already tested the zone once, treat it as weakened or skip it.
Location matters too.
In a dealing range (the span between a significant swing low and swing high), longs are generally favored in the discount half and shorts in the premium half. This premium and discount split keeps you from buying at the top of a range.
When an order block fails and price closes through it, some traders flip it into a breaker block, expecting the old zone to act as support turned resistance (or the reverse). Treat breakers as a separate setup with its own rules.
Fair Value Gaps Explained
A fair value gap (FVG) is a three-candle imbalance. In a bullish FVG, the high of the first candle sits below the low of the third candle, so their wicks never overlap.
The middle candle moved so fast that it left a price range traded on only one side.
Price frequently revisits these gaps, either partially or fully, before continuing. Traders often use the midpoint of the gap (ICT calls it “consequent encroachment”) as a refined entry level.
The invalidation rule applies to both zone types.
An order block or FVG is invalid once a candle closes fully through the zone on the opposite side. A bullish FVG with a candle closing below its low is done.
Delete it.
Liquidity Sweep or Just a Wick?
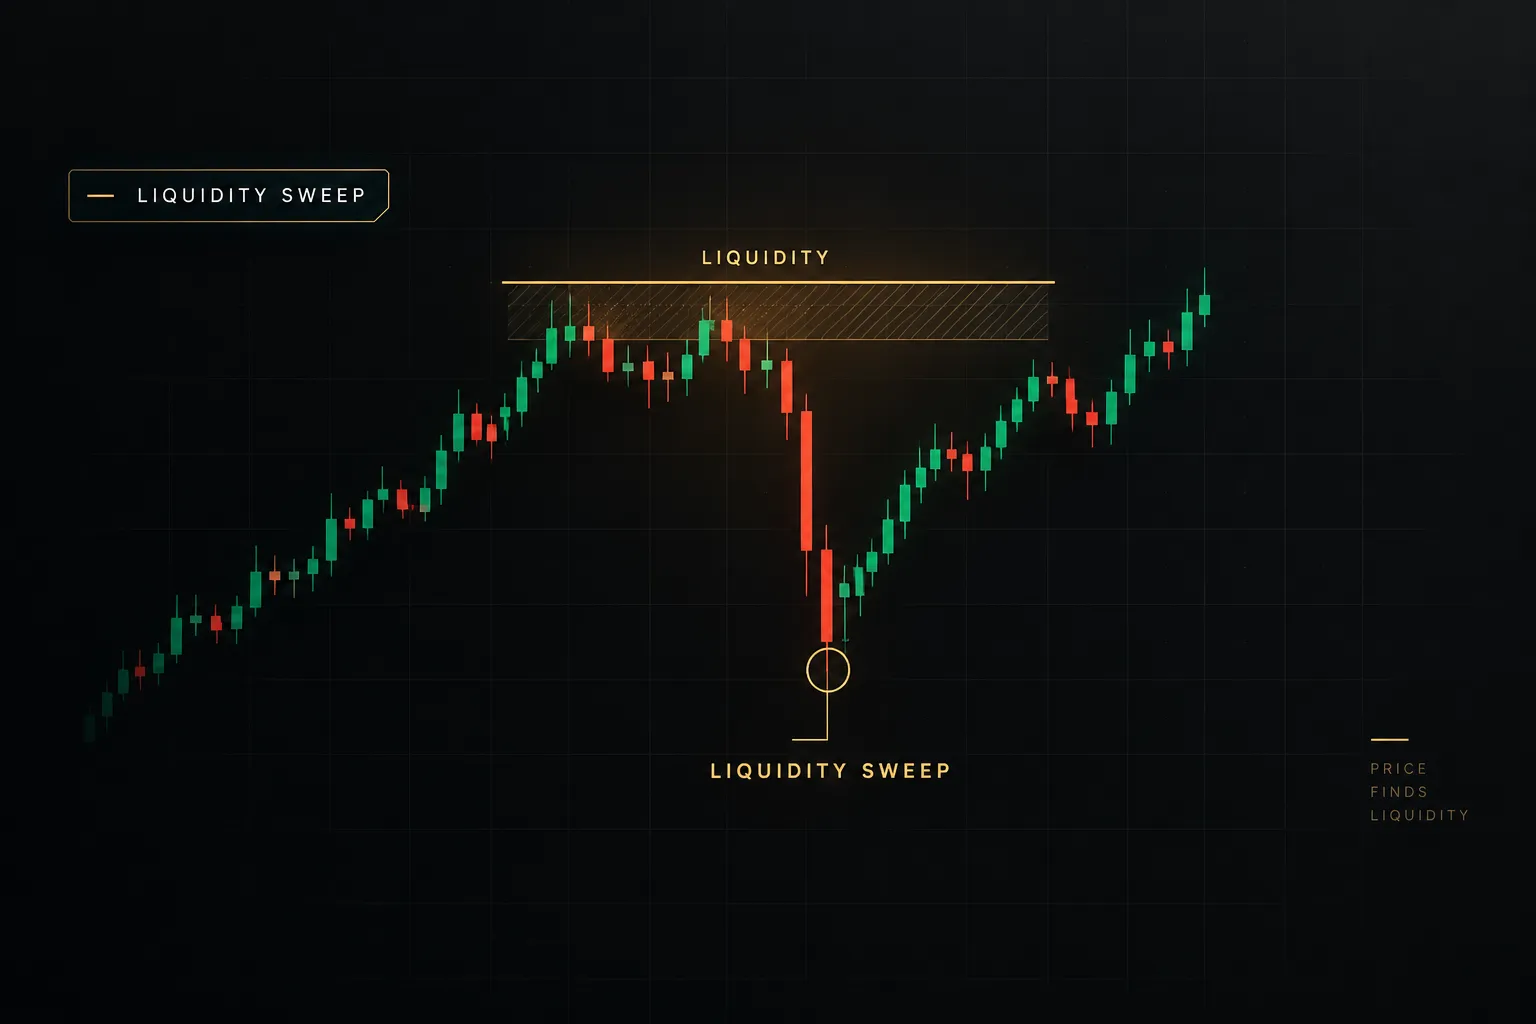
Buy-side liquidity rests above swing highs, where short sellers keep stops and breakout traders place buy orders. Sell-side liquidity sits below swing lows.
Equal highs and equal lows are especially obvious pools because so many traders see them.
Three different events can happen at these levels, and confusing them is costly:
- Liquidity sweep: a wick pierces the level, then the candle closes back inside. Breakout traders who entered are now trapped on the wrong side.
- Genuine breakout: a candle closes beyond the level and price holds or extends on the following candles.
- Random wick: price pokes through and closes back inside, but nothing follows. No displacement, no structure shift, no trade.
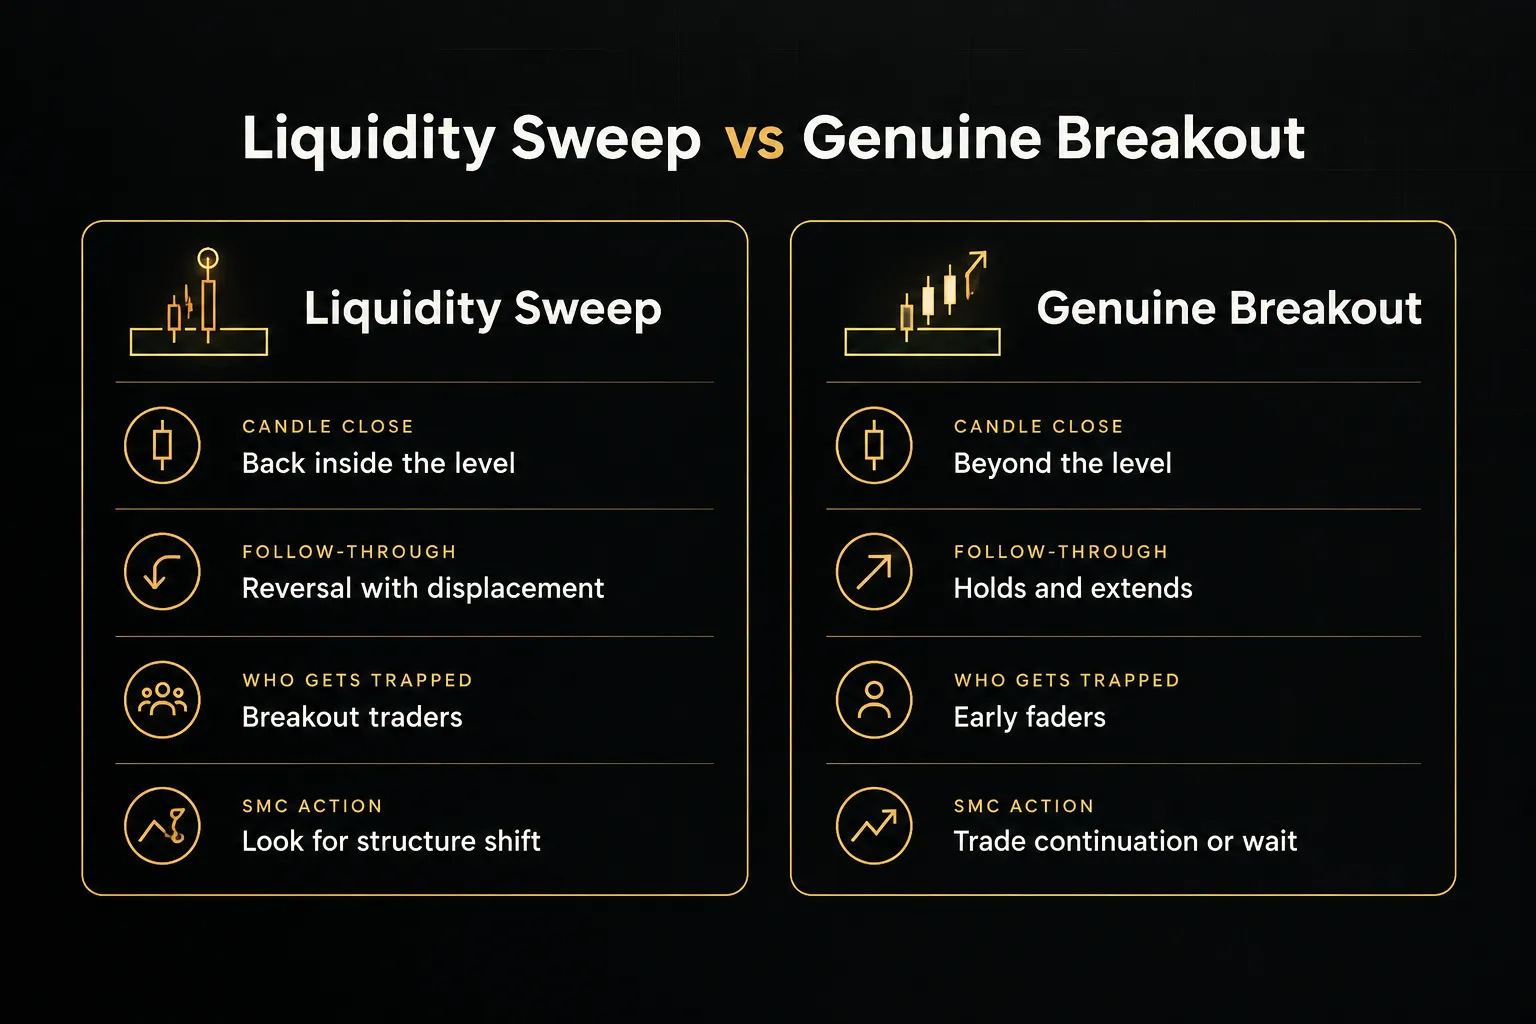
The sweep only becomes meaningful when a structure shift follows it. A wick alone proves very little.
Turning Concepts Into One Setup
Knowing the vocabulary is the easy part. The hard part is putting it in order, because a perfect order block in the wrong context is just a rectangle on a chart.
The Top-Down Sequence
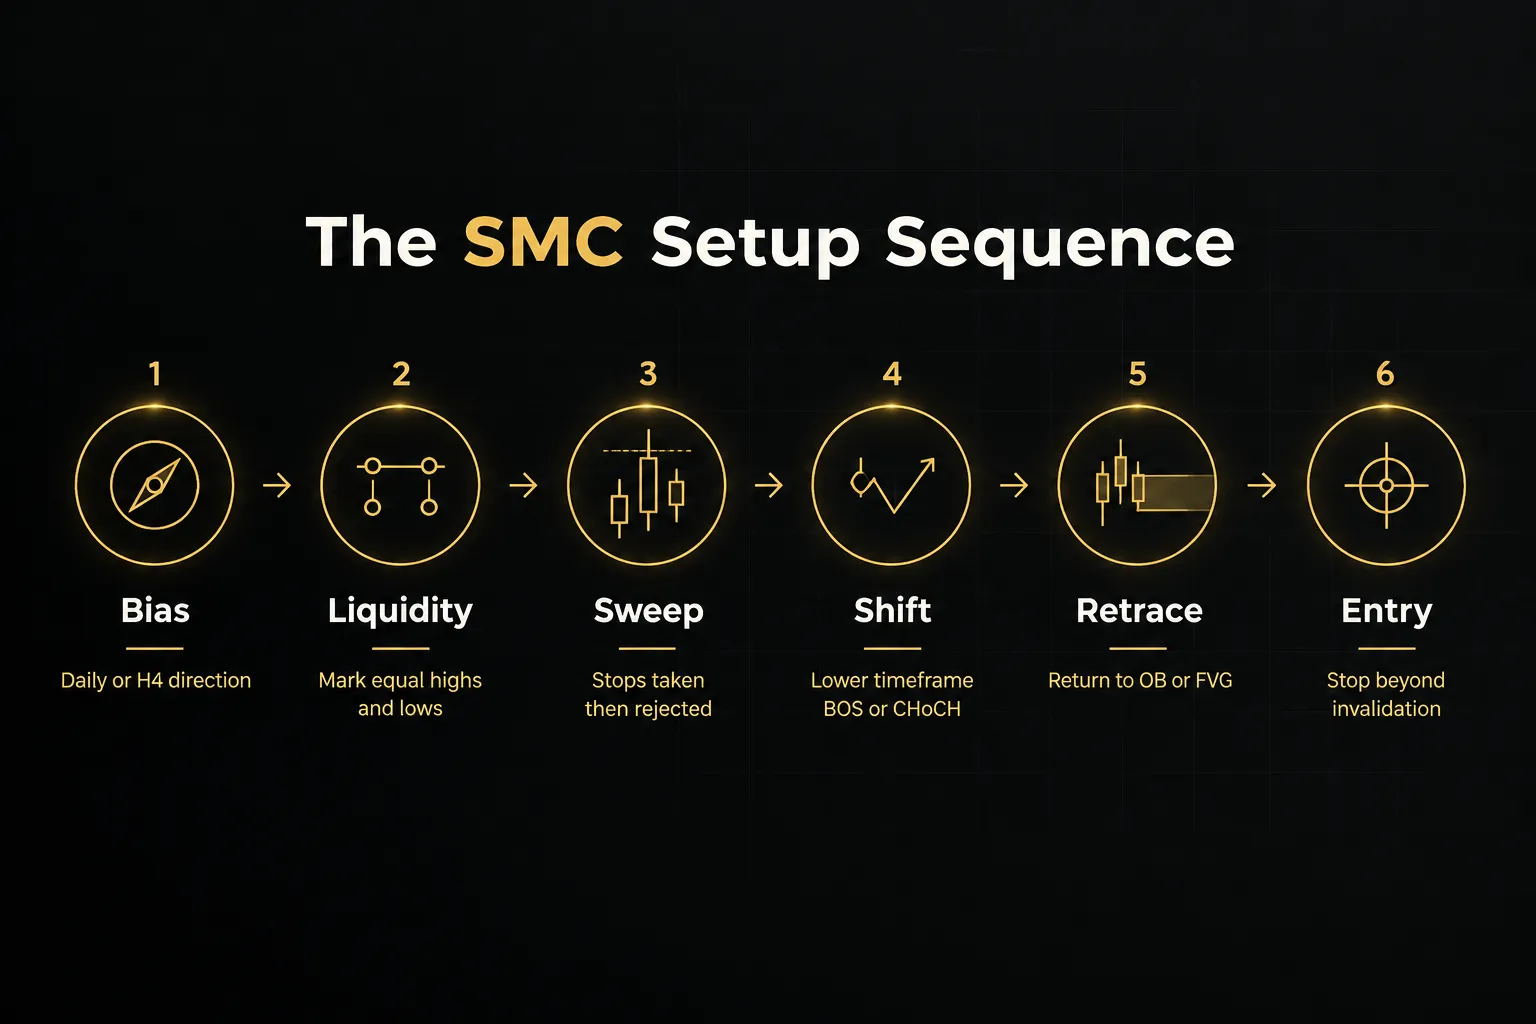
Run every trade through the same sequence. If any step fails, there is no trade.
- Set higher-timeframe bias. Read Daily or H4 structure and decide whether you are looking only for longs, only for shorts, or nothing at all.
- Mark nearby liquidity. Note equal highs and equal lows, the prior day’s high and low, and session highs and lows (Asian range highs and lows are popular reference points).
- Wait for a sweep or displacement in the bias direction. In a bullish bias, you ideally want sell-side liquidity taken first, followed by a strong move up.
- Confirm a lower-timeframe BOS or CHoCH. This is your entry confirmation, a candle close that proves the move has structural intent.
- Wait for retracement into an order block or FVG. The zone should have formed during the displacement that created the structure shift.
- Trigger the entry. Use a limit order at the zone or wait for a confirmation candle inside it, but pick one method and stick with it.
Best Timeframes to Use
Multi-timeframe analysis works best with a fixed hierarchy. Changing timeframes mid-trade to find a better-looking signal is one of the fastest ways to break a system.
- Bias on Daily or H4. These timeframes filter out intraday noise and define the dealing range you are trading within.
- Structure on H1. Use this to see whether the higher-timeframe move is actually unfolding or stalling.
- Entry on M15. Look for the CHoCH and the order block or FVG that you will trade from.
- Scale down only as a whole. Day traders can run H1 bias with M5 or M1 entries, as long as the rules stay identical and the ratio between timeframes stays roughly consistent (about 4x to 15x per step).
Placing Stops and Targets
This is where most SMC traders quietly cheat.
They pick a stop that “feels right” or a fixed 20 pips, which disconnects risk from the setup’s logic.
- Find the invalidation point first. For a bullish order block, that is a close below the zone’s low; for a sweep setup, it is typically just beyond the sweep wick.
- Place the stop just beyond it. Add a small buffer for spread, often 1 to 3 pips on major forex pairs, so normal noise does not take you out.
- Target the next untapped liquidity pool. That might be equal highs, the prior day’s high, or an unfilled opposing FVG.
- Check the risk-to-reward ratio before entry. If the distance to target is less than twice the distance to the stop, many traders pass, and a minimum of 2:1 is a sensible default.
- Reject setups without clear invalidation. If you cannot point to a specific level where the idea is wrong before you enter, it is not a valid SMC trade, no matter how clean it looks.
Risk, Tools, and Honest Testing
You can be wrong six times out of ten and still make money.
That sounds like a sales pitch.
It is just arithmetic, and it is the part of the SMC trading strategy that most video tutorials skip.
Risk Math You Can’t Skip
Fixed fractional risk means risking the same percentage of your account on every trade, commonly 0.5% to 1%. Position sizing then depends on your stop distance, not on how confident you feel.
The formula is simple: Position size = (Account balance × Risk %) ÷ (Stop distance × Value per pip).
On a $10,000 account risking 1%, you risk $100. With a 25-pip stop on EUR/USD, where a standard lot is worth about $10 per pip, that works out to 0.4 lots.
Now the expectancy.
Trade expectancy = (Win rate × Average win) − (Loss rate × Average loss). At a 40% win rate and 2:1 reward-to-risk, that is (0.4 × 2R) − (0.6 × 1R) = +0.2R per trade.
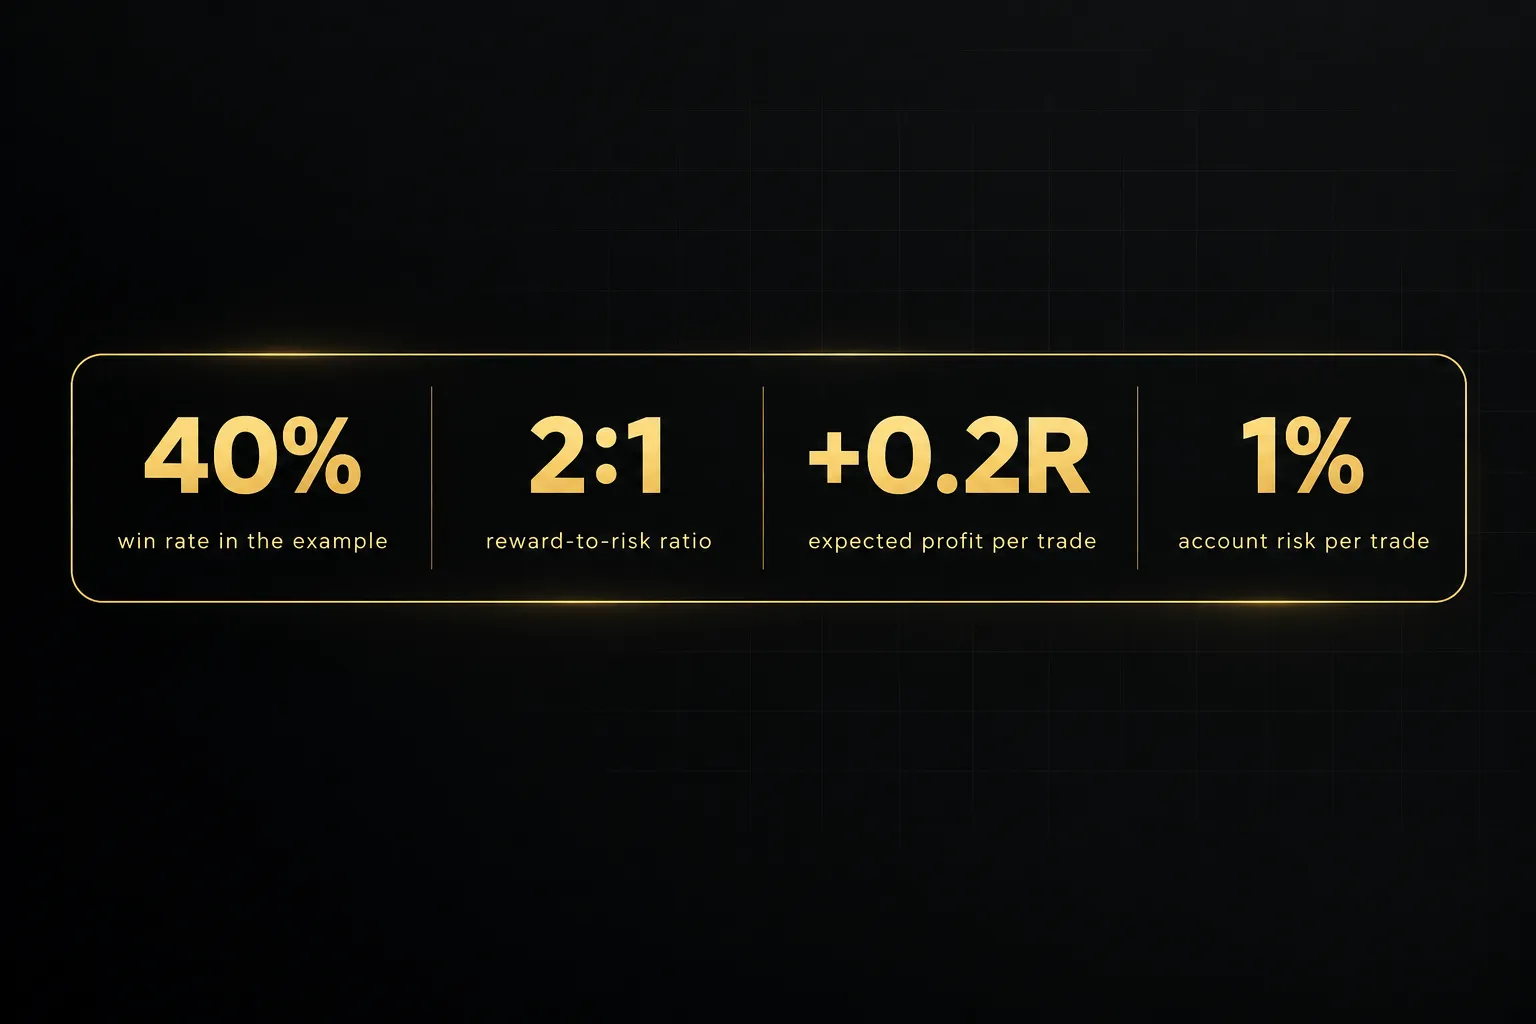
Over 100 trades at 1% risk, +0.2R averages out to roughly +20% before costs.
But averages hide pain.
With a 60% loss rate, the chance of five losses in a row at any given point is about 7.8%, and over a 200-trade sample you should statistically expect a losing streak of around 8 to 10 trades.
Plan for it.
A sound system will still feel broken for weeks at a time.
Where Indicators Like PipTrend Fit In
Execution costs hit SMC traders harder than most. Tight FVG and order block entries often use stops of 5 to 15 pips, so a 1-pip spread plus 0.5 pips of slippage can eat 10% to 30% of your risk before the trade moves.
Market microstructure also differs by asset. Major forex pairs and index futures like the E-mini S&P 500 offer deep liquidity, while small-cap stocks and lower-volume crypto pairs can gap through zones entirely, especially around news or the weekend.
Charts get cluttered fast when you mark structure, liquidity, and zones across three timeframes. A structured indicator system such as PipTrend can organize those signals, visually marking entry zones like fair value gaps and supply and demand levels, and displaying multi-timeframe alignment so you can see at a glance whether H4 and M15 agree.
Be clear about what any tool does.
PipTrend shows direction and levels; it does not guarantee outcomes. And any automated SMC labeling tool can be affected by repainting or delayed confirmation, because a swing point cannot be confirmed until the following candle closes.
Check how your tool handles that before trusting historical signals.
Backtesting Without Hindsight Bias
Scrolling back through a chart and spotting perfect setups is not backtesting.
It is pattern recognition with the answer key visible.
To get honest numbers, lock these variables before you start:
- Timeframe hierarchy: for example, H4 bias, H1 structure, M15 entry.
- Swing-detection rule: the exact candle-close definition from earlier.
- Entry trigger: limit at zone edge, zone midpoint, or confirmation candle.
- Stop and target rule: beyond invalidation, target next liquidity, minimum 2:1.
- Zone-expiry rule: for example, zones older than 50 candles are ignored.
- Transaction costs: realistic spread, commission, and slippage per trade.
Then test on one period and validate on a separate out-of-sample period you have not looked at. Use bar-by-bar replay so you see each candle as it forms.
Follow with forward testing on a demo account, logging every trade in a trading journal.
Your SMC Questions Answered
What is the best SMC strategy for beginners?
The best SMC strategy for beginners is the simplest one: a single currency pair, a fixed higher-timeframe bias, and one zone type.
Pick either order blocks or fair value gaps, not both.
Add complexity only after 50 or more logged trades show your rules are being applied consistently.
Is SMC trading profitable?
No strategy is inherently profitable, and SMC is no exception.
Profitability depends on consistent rules, disciplined risk management, and execution costs, not on the labels used to describe price. A trader with positive expectancy and controlled risk can profit with SMC; a trader without those will lose with any method.
What are the 3 main concepts of SMC?
The three core concepts of SMC are market structure, liquidity, and imbalance or order flow zones.
Every other term fits under one of these.
BOS and CHoCH belong to structure, sweeps and equal highs belong to liquidity, and order blocks and FVGs belong to imbalance zones.
What is the difference between a liquidity grab and a liquidity sweep?
A liquidity grab and a liquidity sweep are generally the same thing.
Both describe a wick through a known level, such as a swing high or equal lows, followed by a close back inside and a reversal. Neither should be confused with a confirmed breakout, where price closes beyond the level and holds.
How accurate is the Smart Money Concept strategy?
There is no public, peer-reviewed data showing SMC outperforms other price-action methods. Any specific win-rate claim you see online, as of 2026, comes from selective examples or unverified accounts.
SMC’s real value is a precise vocabulary for a structured entry process, which makes rules easier to define and test.
What is the best timeframe for Smart Money Concepts?
The most common combination is H4 or Daily for bias and H1 or M15 for execution. This balances signal quality with enough trade frequency.
Day traders often adapt the same hierarchy down, using H1 for bias and M5 or M1 for entries, without changing the underlying rules.
Is SMC better than traditional technical analysis?
SMC is not inherently better than traditional technical analysis.
Both largely describe the same price behavior with different vocabulary: an order block resembles a demand zone, and a liquidity sweep resembles a false breakout.
The better approach is whichever one you can define precisely and execute consistently.
Can SMC be used for day trading?
Yes, SMC can be used for day trading.
Your rules need to account for session timing (the London and New York opens typically provide the cleanest moves), liquidity on your chosen instrument, and the outsized effect of spread and slippage on small stops.
Test intraday rules with realistic costs built in.
Your Next Step With SMC
Watching another SMC video will not improve your trading.
Writing down your rules will.
Before your next session, write out personal candle-close definitions for five terms: swing high and low, BOS, CHoCH, order block, and fair value gap. Make each one specific enough that another trader could mark the same chart and get the same result.
Then backtest at least 20 historical instances with bar-by-bar replay before risking any live capital.
Twenty is not a statistically meaningful sample.
But it will expose vague rules fast… and vague rules are what sink most SMC traders.
Keep perspective as you go.
SMC is a price-action lens that organizes decision-making, not proof of institutional intent. Indicator tools, PipTrend included, can support your analysis by organizing zones and timeframe alignment, but none of them guarantee results.
Risk disclosure: Trading leveraged forex, CFDs, futures, options, and other derivatives, as well as day trading in general, carries a high risk of rapid and substantial losses, including losses exceeding your initial deposit in some products. Past performance and backtested results do not guarantee future returns. Before trading with real money, review investor education and fraud-awareness resources from regulators such as the Commodity Futures Trading Commission (CFTC) and the National Futures Association (NFA), or the equivalent authority in your country.
Define the rules. Test them honestly. Size every position as if the next ten trades might lose.
That is the SMC trading strategy without the hype.
Sources
- ScienceDirect: Profitability of technical analysis in financial and commodity futures markets - A reality check
- DOI: The profitability of technical analysis: Evidence from the piercing line and dark cloud cover patterns in the forex market
- ScienceDirect: Does intraday technical analysis in the U.S. equity market have value?
- Wikipedia: Market microstructure
Risk Disclaimer: Trading involves risk. Past performance doesn't guarantee future results. Only trade with money you can afford to lose. PipTrend is a tool to assist your trading decisions, not financial advice.