How to trade candlestick patterns with real rules
On this page
Why most candlestick guides get it wrong
Most traders who lose money with candlesticks can identify the patterns perfectly. They know a hammer from a shooting star and can name every engulfing bar on the chart. The problem isn’t recognition. It’s what they do next.
The core premise of this guide is simple: a candlestick pattern is a clue, not a signal. A clue tells you something might be changing in the balance between buyers and sellers. A signal tells you to act. Beginners treat the first as the second, and that single mistake accounts for a large share of early losses.
Think of it like a detective finding a footprint at a crime scene. The footprint matters, but nobody gets convicted on one footprint alone. You need motive, opportunity and corroborating evidence.
Candlestick patterns work the same way.
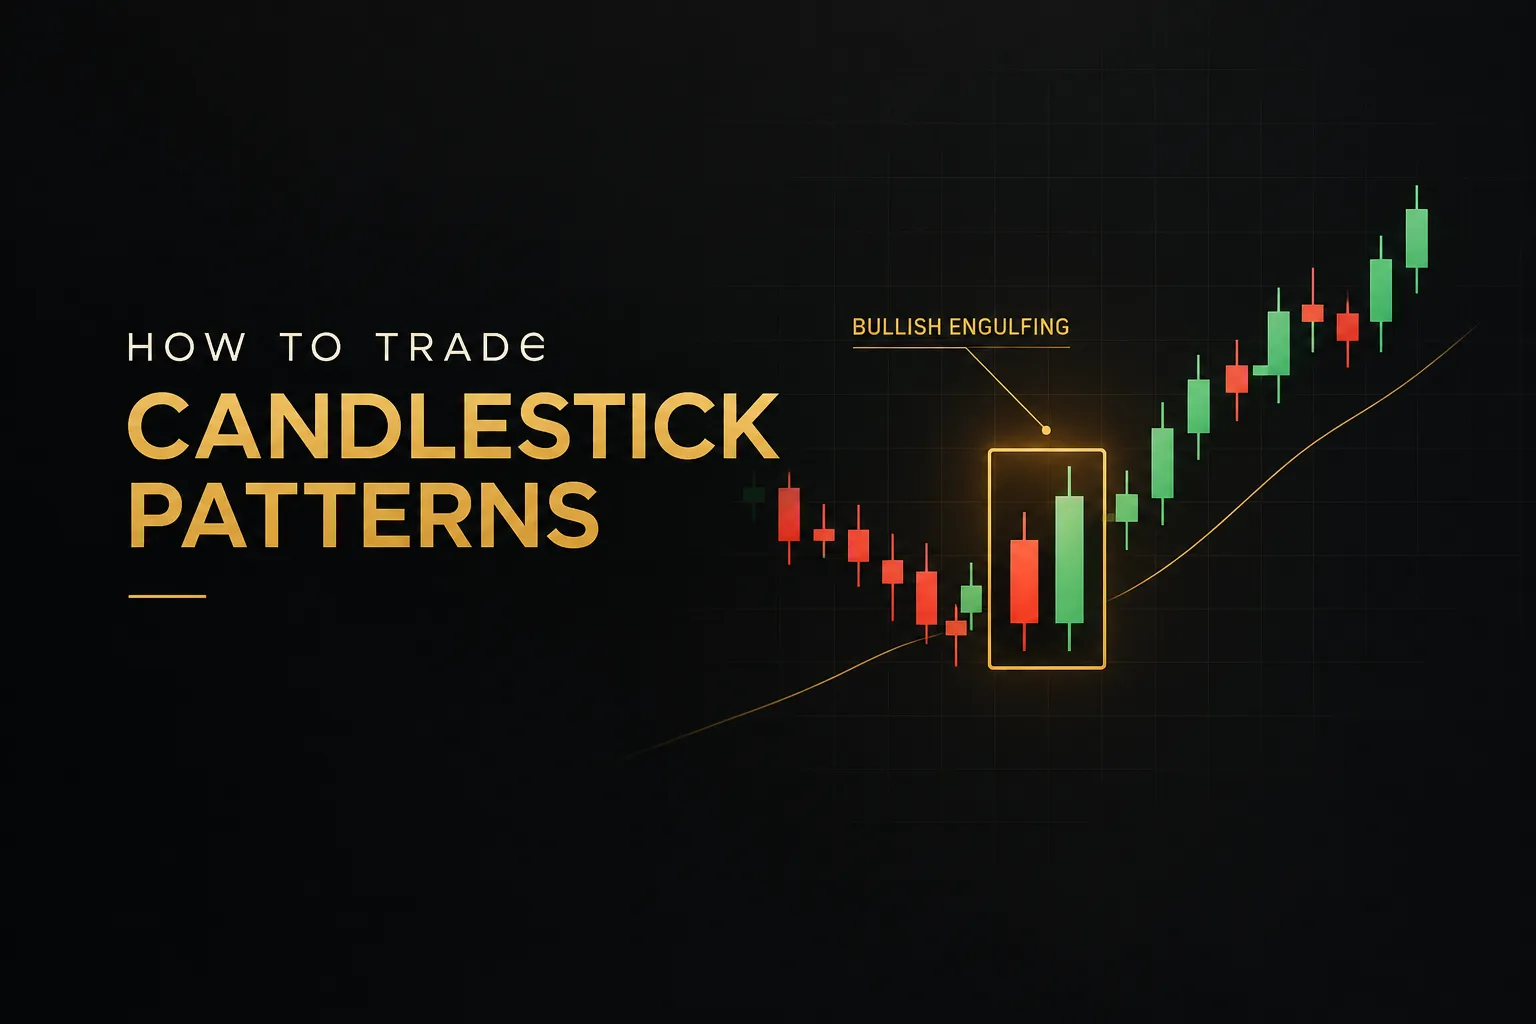
Here’s a concrete example. A bullish engulfing pattern that forms at a major weekly support level, after a sustained decline, with rising volume, carries real information. The exact same two-candle shape printed in the middle of a sideways, choppy range carries almost none.
Same pattern. Completely different odds.
Memorizing shapes is the easy part. Knowing when a shape matters is where the edge lives.
That’s why this article teaches a context-first framework for how to trade candlestick patterns. Before any entry, you’ll check four things in order:
Trend (what is the broader market structure doing?), location (is price at a level that matters?), confirmation (has the market actually agreed with the pattern?) and risk (where are you wrong, and is the reward worth it?). Only when all four line up does a pattern become a trade.
This approach won’t make you right every time. Nothing will. But it filters out the low-quality setups that drain accounts, and it gives you objective rules you can test, journal and improve.
By the end, you’ll have a complete process, from reading a single candle to sizing a position and knowing when to sit on your hands.
Reading a candle before you trade it
Every candle on your chart is a compressed story of a fight. Four prices tell you who showed up, who pushed hardest and who was standing at the end.
Learn to read that story and patterns stop being mysterious shapes.
Anatomy of a candlestick
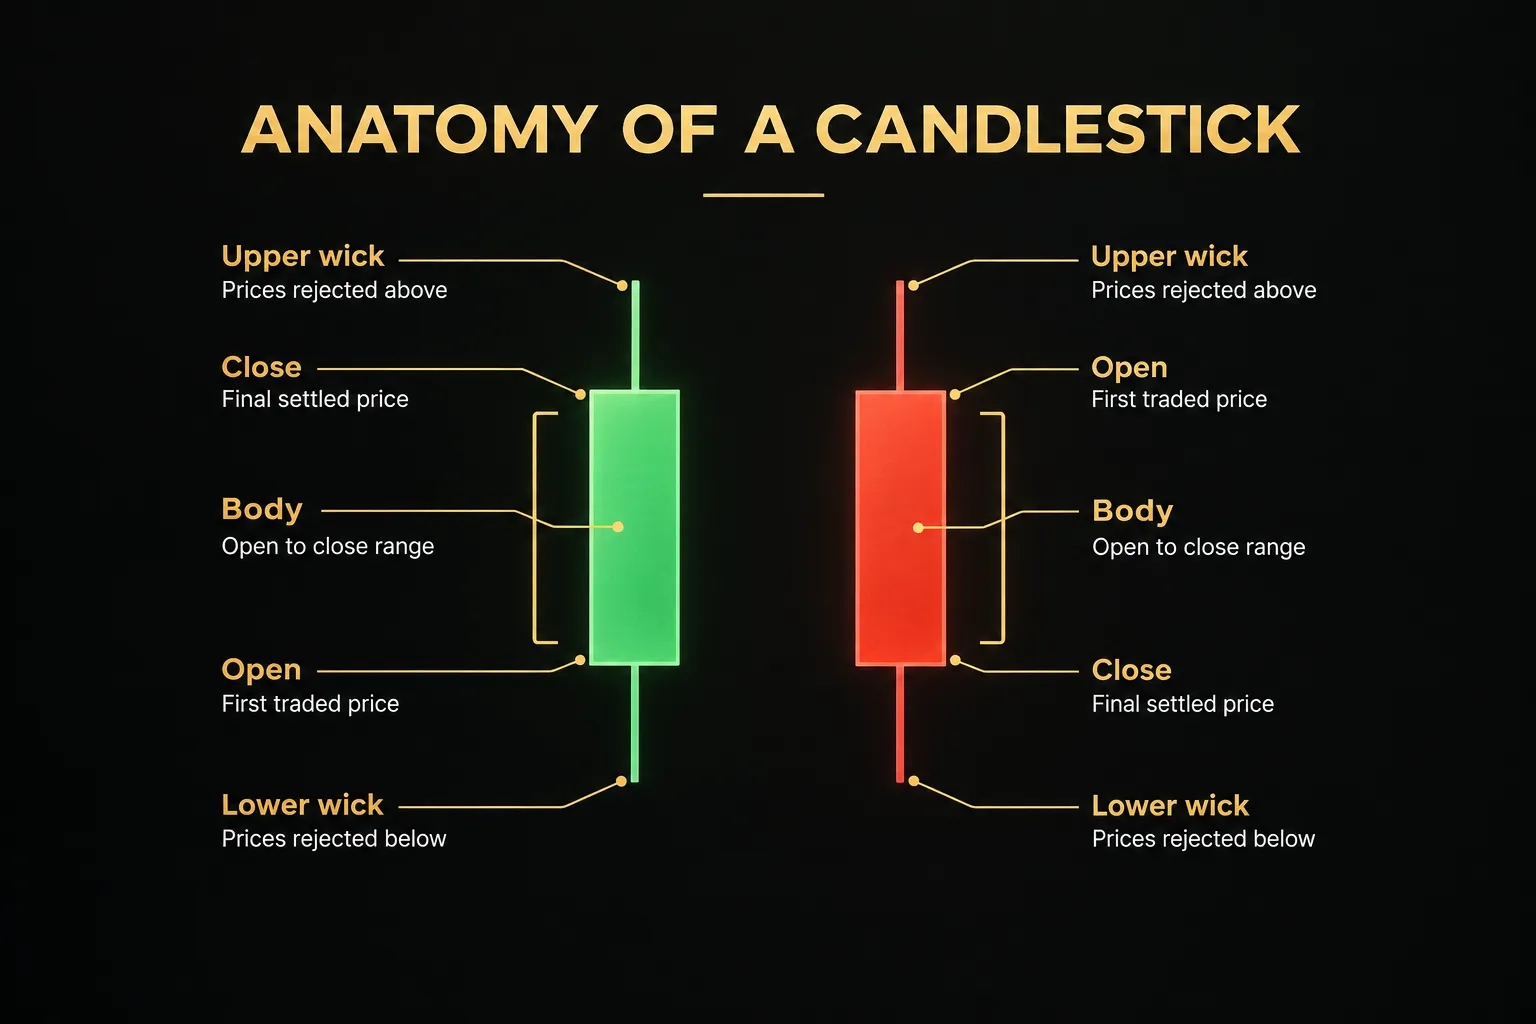
Each candle is built from four data points: open, high, low, close (often shortened to OHLC). The open is the first traded price of the period. The close is the last. The high and low mark the extremes reached in between.
The body is the rectangle between the open and the close. When the close is above the open, the candle is bullish (usually green or white), meaning buyers controlled the period overall. When the close is below the open, it’s bearish (red or black), and sellers won.
The wicks (also called shadows) are the thin lines extending above and below the body. They show prices that were reached but rejected. A long upper wick means buyers pushed price up, then sellers overwhelmed them and drove it back down before the close.
So the candlestick body and wick each tell you something different. The body shows conviction. The wicks show failed attempts.
A candle with a big body and tiny wicks says one side dominated from start to finish. A small body with long wicks on both sides says nobody won.
A candlestick pattern is simply a visual summary of order flow across one or more sessions. It records what happened. It does not predict what will happen.
That distinction sounds academic, but it shapes every decision that follows.
Why context decides meaning
A hammer is just a candle with a long lower wick. Whether it means anything depends entirely on where it appears. Before reading any pattern, run three context checks.
First: is it after an extended move? Reversal patterns need something to reverse. A hammer after five consecutive down days and a 12% decline has meaning. A hammer after one red candle in a flat market doesn’t.
Second: is it at a key support and resistance level? Patterns forming at prior swing highs, swing lows, round numbers or well-tested horizontal zones carry far more weight. These are places where large orders tend to sit, so a rejection there reflects real participants defending real prices.
Third: is the market trending or chopping? In a clean trend, continuation setups in the trend’s direction tend to perform better than counter-trend reversals. In a choppy range, both reversal and continuation patterns produce frequent false reads because there’s no sustained directional pressure.
Timeframe changes meaning too. A 5-minute candle on EUR/USD represents a few hundred thousand trades over five minutes, often influenced by a single news headline or a large order. A daily candle on a large-cap stock reflects a full session of institutional activity, earnings reactions and portfolio flows.
The same shooting star shape on both charts doesn’t carry the same weight. The daily candle summarizes far more participation, so its signal is slower but generally more meaningful. The 5-minute candle is noisier… and noise is exactly what context checks are designed to filter.
Candlestick patterns worth learning
There are over 100 named candlestick patterns, and most of them are unnecessary. A handful cover nearly every meaningful price action scenario you’ll encounter. Learn these deeply, including what kills them, and you’ll outperform traders who memorize fifty.
For each pattern below, pay as much attention to the invalidation rule as to the confirmation rule. Knowing when a pattern has failed is what lets you place a logical stop.
Bullish and bearish engulfing
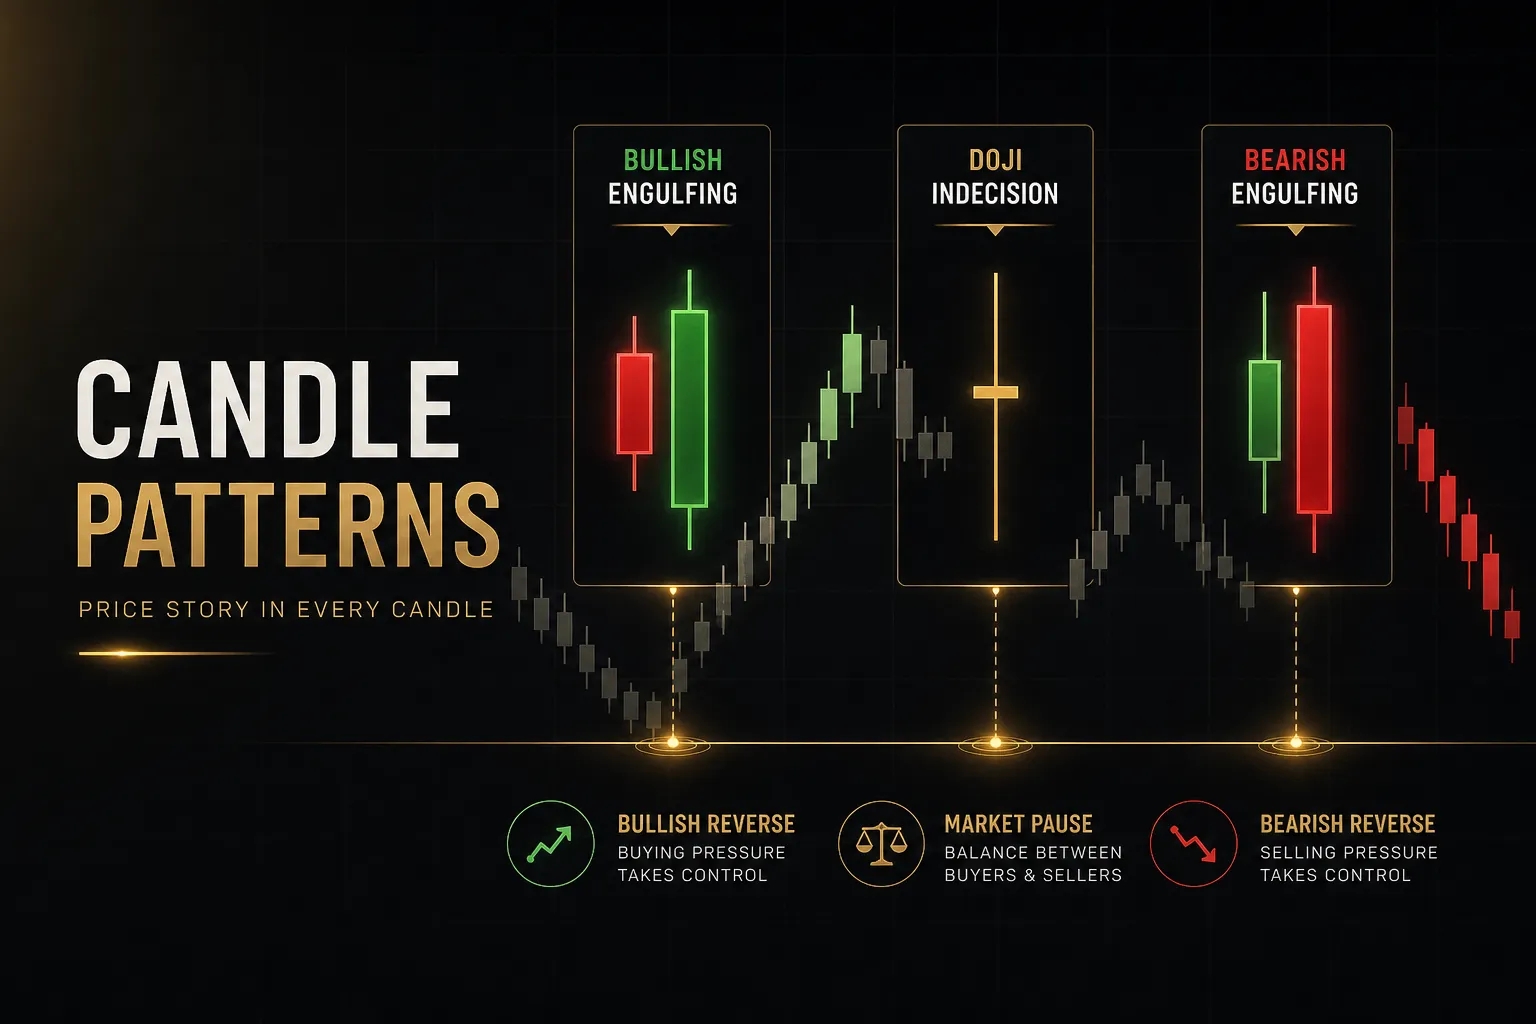
Engulfing patterns are two-candle reversal setups that show a decisive shift in control. They are among the clearest patterns to define objectively.
- Bullish engulfing: A bearish candle is followed by a bullish candle whose body fully covers the prior candle’s body. The structural rule is strict: the second body must open at or below the first close and close above the first open.
- Bearish engulfing: The mirror image. A bullish candle is followed by a bearish candle whose body completely covers the prior body, showing sellers absorbed all of the previous session’s buying.
- Why it signals a shift: The engulfing candle doesn’t just reverse the prior move, it erases it entirely within one period. That means the side that was winning got overwhelmed, not just slowed down.
- Where it works best: At a tested support level after a decline (bullish) or at resistance after a rally (bearish), ideally with above-average volume on the engulfing candle.
- Invalidation: A bullish engulfing is invalidated if price closes below the low of the engulfing candle, and a bearish engulfing fails on a close above its high.
Hammer and shooting star
These single-candle patterns are defined by their wick-to-body ratio. The shape alone isn’t enough, though. Location is part of the definition.
- Hammer: A small body near the top of the range with a lower wick at least two times the length of the body, and little or no upper wick. It must appear after a down move to qualify, because it shows sellers pushed price lower and buyers rejected those lows by the close.
- Shooting star: A small body near the bottom of the range with an upper wick at least two times the body length and minimal lower wick. It must appear after an up move, showing buyers tried to extend the rally and failed.
- The location requirement: A hammer-shaped candle at the top of a rally is called a hanging man and has a different interpretation. The shape is identical. The context changes the meaning.
- Quality markers: Longer wicks relative to the body (three times or more) and formation directly at support or resistance generally make the rejection more convincing.
- Invalidation: A hammer fails when price closes below its low, and a shooting star fails when price closes above its high, because the rejected prices have been reclaimed.
Doji, inside bars and three-candle setups
These patterns are less about direction and more about the state of the market. They tell you when pressure is building or when conviction has disappeared.
- Doji: The open and close are virtually equal, creating a cross or plus-sign shape. It signals indecision, not reversal, and it only becomes useful when it appears after a strong move at a significant level. A doji is invalidated as a turning signal when the next candle closes beyond its range in the direction of the prior trend.
- Inside bar: A candle whose entire range (high and low) sits within the previous candle’s range, often called the mother bar. It represents compression, a pause where volatility contracts before expansion, and it can act as either a reversal setup or a continuation setup depending on the trend. It’s invalidated when price breaks out of the mother bar, then closes back inside it, which signals a false breakout.
- Morning star: A three-candle bullish reversal. A large bearish candle, then a small-bodied candle (often a doji) showing exhaustion, then a strong bullish candle closing well into the first candle’s body. It’s invalidated by a close below the middle candle’s low.
- Evening star: The bearish version at the top of an uptrend: large bullish candle, small indecision candle, strong bearish candle. It fails on a close above the middle candle’s high.
- Why three candles help: Three-candle patterns build confirmation into the structure itself, since the third candle proves the market acted on the indecision, which reduces false reads compared to acting on a single bar.
Turning a pattern into a complete trade setup
A pattern is one ingredient. A trade is the whole recipe. The gap between the two is where most of the real work in learning how to trade candlestick patterns happens.
Confirmation and the closed-candle rule
Here’s a mistake almost every beginner makes. They see a hammer forming at support with ten minutes left in the hour, and they buy. Then the candle finishes as a long red bar and the “hammer” never existed.
A candle isn’t a pattern until it closes. Until then, the open, high, low and close are still changing, and the shape you’re looking at is provisional. This is the closed-candle rule: never act on a pattern before the candle that completes it has closed.
Confirmation goes one step further. It needs a definition, not a feeling. Phrases like “strong signal” or “looks bullish” can’t be tested or repeated.
A workable definition: confirmation is a close beyond a defined level, plus agreement from volume or momentum. For a bullish engulfing at support, that might mean the next candle closes above the engulfing candle’s high, with volume above its 20-period average or RSI turning up from below 40. Both conditions can be checked by anyone, every time.
Volume confirmation matters most in stocks and futures, where centralized volume data is reliable. In spot forex, where volume is fragmented across brokers, momentum indicators or tick volume often serve as the second check instead.
If you can’t write your confirmation rule down in one sentence, you don’t have a rule. You have a mood.
Entry, stop loss and target placement
Your stop loss should come from the pattern, not from your comfort level. A fixed 20-pip or 2% stop is arbitrary. The market doesn’t know or care what you’re willing to lose.
Instead, place the stop beyond the pattern’s invalidation point. For a hammer, that’s below the hammer’s low. For a bearish engulfing, it’s above the engulfing candle’s high. If price reaches that level, the pattern’s logic is broken and staying in the trade means hoping, not trading.
Many traders add a small buffer using the Average True Range. An ATR stop loss might sit 0.1 to 0.25 ATR beyond the invalidation point, which keeps the stop clear of normal spread fluctuations and minor wicks without moving it far from the logical level.
Targets come next. The most objective target is the nearest opposing structure: the next resistance level for a long, the next support for a short. Then measure the distance to that target against the distance to your stop.
That ratio is your risk-to-reward ratio, and it acts as a gate. Set a minimum (1:1.5 or 1:2 is common) and skip any setup that doesn’t meet it.
A beautiful hammer with resistance sitting just above it is still a bad trade.
Finally, position sizing converts your stop distance into a trade size. Decide the percentage of your account you’ll risk per trade (0.5% to 1% is typical for disciplined traders), then divide that dollar amount by the stop distance. On a $10,000 account risking 1%, that’s $100. With a 25-pip stop on EUR/USD, you’d trade $4 per pip, or 0.4 standard lots.
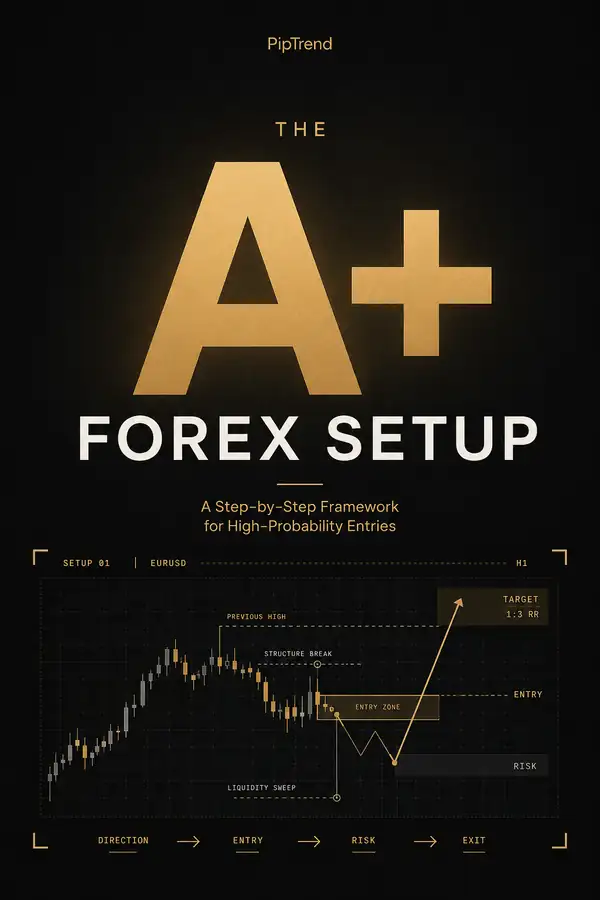
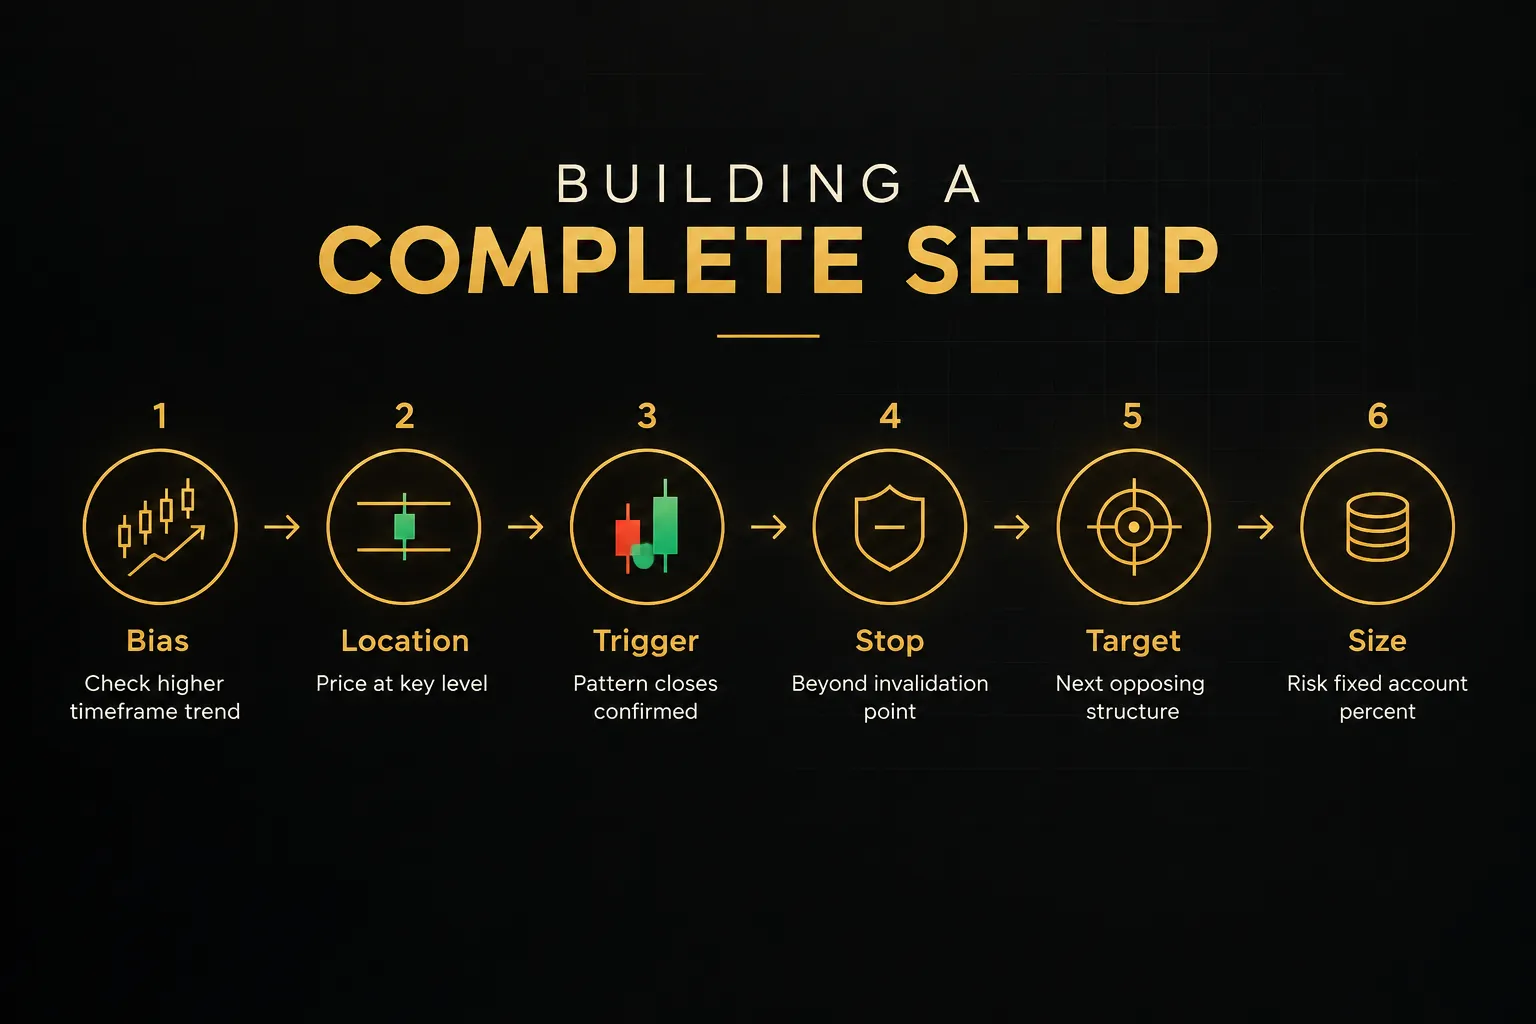
Put all of this together and you can see the difference between a bare pattern and a complete setup. A complete setup has seven elements present before you click buy or sell:
Directional bias from the higher timeframe. A meaningful location. A trigger pattern. A defined entry method (market order on close, or a stop order beyond the trigger candle). A stop at invalidation. A target at opposing structure. And a position size calculated from the stop.
Miss any one and you’re improvising.
Confirming with multi-timeframe tools
A 15-minute bullish engulfing looks very different when the 4-hour and daily charts are in a strong downtrend. The lower-timeframe pattern may still play out, but it’s swimming against the current. Multi-timeframe analysis exists to catch that conflict before you trade.
The manual version is simple. Before acting on a lower-timeframe candle, check one or two higher timeframes for trend direction and nearby structure. If the higher timeframe agrees, the setup gains confluence. If it disagrees, you either skip the trade or require a higher reward-to-risk to compensate.
The challenge is consistency. Flipping through six or eight charts before every trade is slow, and under time pressure traders tend to see what they want to see. That’s where a structured dashboard can help.
Tools like PipTrend’s 12-timeframe dashboard display trend direction across multiple timeframes in a single table, so you can check higher-timeframe agreement at a glance. The value isn’t prediction. It’s reducing subjectivity: the table shows whether the 1-hour, 4-hour and daily trends agree with your trade direction, using the same criteria every time.
To be clear, no dashboard guarantees outcomes. Higher-timeframe alignment improves the context around a trade. It doesn’t remove risk.
Think of it as a checklist that can’t be skipped when you’re tired or impatient, which is often exactly when traders break their own rules.
Why candlestick setups fail even when read correctly
You can follow every rule in this article and still lose on a given trade. That’s not a flaw in the process. It’s the nature of probabilistic markets, and understanding why it happens keeps you from abandoning a sound approach after a normal losing streak.
Execution costs, gaps and liquidity
Pattern statistics you see in books usually assume perfect fills at the exact close price. Real trading doesn’t work that way. Spread, slippage, overnight gaps and thin liquidity all chip away at theoretical performance.
Compare two trades. The first is a hammer on the 1-hour EUR/USD chart during the London session. Spreads are often under one pip at major brokers, liquidity is deep, and your stop below the hammer’s low will usually fill within a fraction of a pip. On a 20-pip stop, round-trip costs might be around 5% of your risk.
The second is a daily hammer on a stock at $50, with your stop at $48. That evening, the company reports earnings and the stock opens at $46. Your stop doesn’t fill at $48. It fills at the open, near $46, turning a planned 1R loss into a 2R loss.
The pattern was read correctly. The gap ignored it.
Liquidity matters within sessions too. Forex candles during the late New York and early Asian hours often have wider spreads and erratic wicks, so patterns forming then are less reliable. The same applies to stocks in the first and last few minutes of trading, and to small-cap names with thin order books.
Backtesting, sample size and expectancy
Win rate is the most misunderstood number in trading. A high win rate feels good.
It doesn’t necessarily make money.
What matters is trade expectancy: the average amount you expect to win or lose per trade, measured in units of risk (R). The formula is (win rate × average win) minus (loss rate × average loss).
Consider two strategies. Strategy A wins 40% of the time but averages 2R per winner and 1R per loser. Its expectancy is (0.40 × 2) minus (0.60 × 1), which equals +0.2R per trade. Strategy B wins 60% of the time but averages only 0.5R per winner because it takes profits too early, and still loses 1R per loser. Its expectancy is (0.60 × 0.5) minus (0.40 × 1), which equals −0.1R per trade.
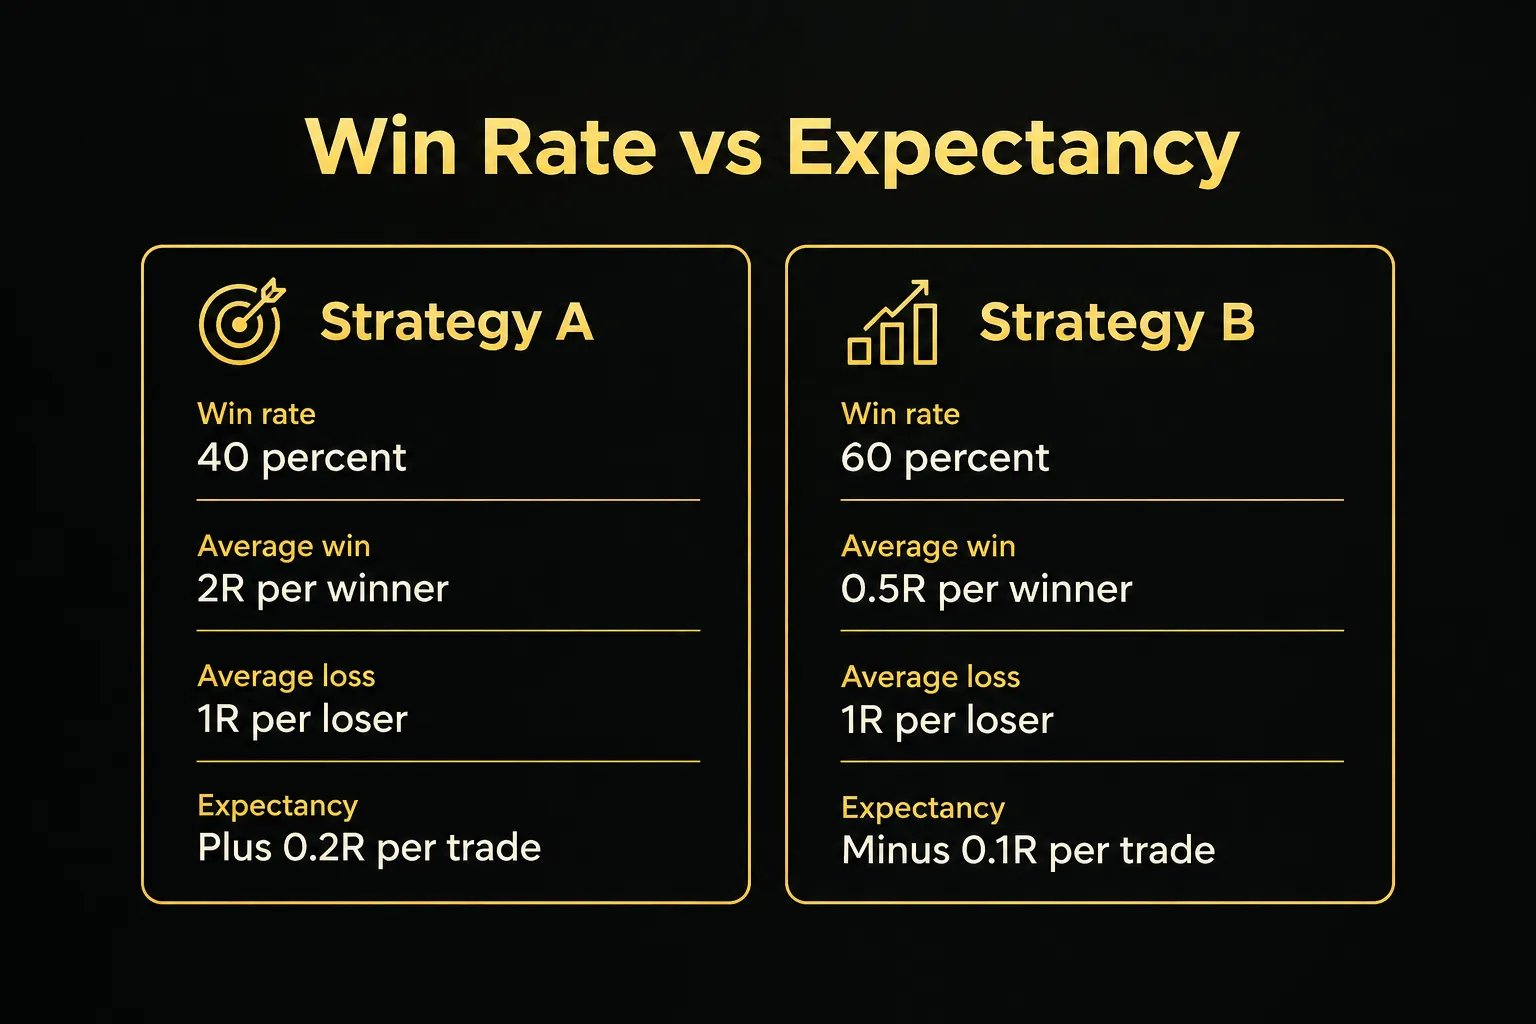
The lower win rate makes money. The higher one loses it. This is why the minimum risk-to-reward gate from earlier matters so much.
Judging expectancy requires enough data. A sample of 50 to 100+ trades is commonly cited as the minimum before drawing conclusions about a setup. With 15 trades, a strategy with a 40% win rate can easily show 10 losses in a row by pure chance.
Watch for two biases when reviewing historical charts. Hindsight bias makes winning patterns jump out because you already see what happened next, while failed patterns fade into the background. Look-ahead bias sneaks in when your test uses information you wouldn’t have had in real time, like entering at the low of a candle that hadn’t closed yet. Scroll charts forward one candle at a time, and record every qualifying pattern, not just the ones that worked.
When not to trade a pattern
Some of the best trades are the ones you skip. Having explicit no-trade conditions protects you from setups that look valid but sit in hostile conditions.
Major news releases. Avoid entering within roughly 15 to 30 minutes of high-impact events like central bank decisions, CPI or non-farm payrolls. Candles around these releases reflect a sudden repricing, not the gradual order flow that patterns are meant to summarize.
Compressed, low-volatility ranges. When ATR drops to unusually low levels and price is stuck in a tight box, patterns appear constantly and mean little. Wait for the range to resolve.
Late entries far from the trigger. If price has already moved more than about one ATR from the trigger candle’s close, your stop distance has ballooned and the risk-to-reward no longer works. Chasing is how good setups become bad trades.
Conflicting higher-timeframe structure. A bullish reversal pattern on the 15-minute chart directly into daily resistance is fighting a bigger force. Skip it unless the reward is exceptional.
Reward-to-risk below 1:1.5. If the nearest opposing level is too close to justify the stop, the math doesn’t work, no matter how clean the pattern looks.
Frequently asked questions
What is the most reliable candlestick pattern for trading?
No single candlestick pattern is universally the most reliable. Reliability depends on location, confirmation and market regime rather than the shape itself. An engulfing pattern at major support in a trending market will typically outperform the same pattern in a choppy range, so focus on context before choosing favorites.
How do you trade candlestick patterns step by step?
Trade candlestick patterns by checking trend, location, confirmation and risk in that order. Identify the higher-timeframe direction, wait for a pattern at a meaningful support or resistance level, and require a closed candle plus volume or momentum agreement. Then place your stop beyond the invalidation point, set a target at opposing structure, and size the position from the stop distance.
Do candlestick patterns actually work?
Candlestick patterns work as context clues, not as standalone signals. On their own, they offer a weak edge that often disappears after spreads and slippage. Combined with market structure, confirmation rules and disciplined risk management, they become a useful framework for timing entries and defining where a trade is wrong.
Which candlestick pattern is best for day trading?
Inside bars and engulfing patterns are among the most practical for day trading because they have clear, objective boundaries for entries and stops. Intraday charts are noisy, so stick to liquid sessions, check the 1-hour or 4-hour trend first, and skip patterns that form around major news releases.
What is the 3 candle rule in trading?
The 3 candle rule is a confirmation concept, not a guaranteed signal. It refers to waiting for a three-bar sequence (such as the morning star or evening star) where the third candle proves the market acted on the indecision shown by the second. It reduces false reads compared to single-candle entries, but it still requires a defined stop and favorable location.
Should I buy after a bullish candlestick pattern?
No, you should not buy after a bullish candlestick pattern without confirmation. Wait for the pattern candle to close, then require a close beyond a defined level with volume or momentum agreement. The pattern also needs to sit at a meaningful location with acceptable reward-to-risk, otherwise it’s just a green candle.
Your next step as a candlestick trader
Where you go from here depends on where you are now. Be honest about which group you’re in.
If you’re still learning to read charts, don’t risk capital yet. Open historical data, scroll forward one candle at a time, and practice identifying context and invalidation for every pattern you spot. Mark the trend, the level, the confirmation and the stop before you reveal the next candle.
If you already trade patterns but your results are inconsistent, start a journal today. Record setup quality, whether confirmation was present, your planned risk-to-reward and the outcome for at least 30 trades. Patterns in your own behavior will show up faster than you expect.
Either way, one habit matters more than any other: wait for the close and define invalidation before entry, every time. No exceptions for “obvious” setups.
As of 2026, there’s no shortage of new indicators and pattern scanners. But consistency doesn’t come from finding a better-looking pattern.
It comes from rules you follow and reviews you actually do.
Sources
Risk Disclaimer: Trading involves risk. Past performance doesn't guarantee future results. Only trade with money you can afford to lose. PipTrend is a tool to assist your trading decisions, not financial advice.