Price action vs indicators: which actually wins?
On this page
Introduction
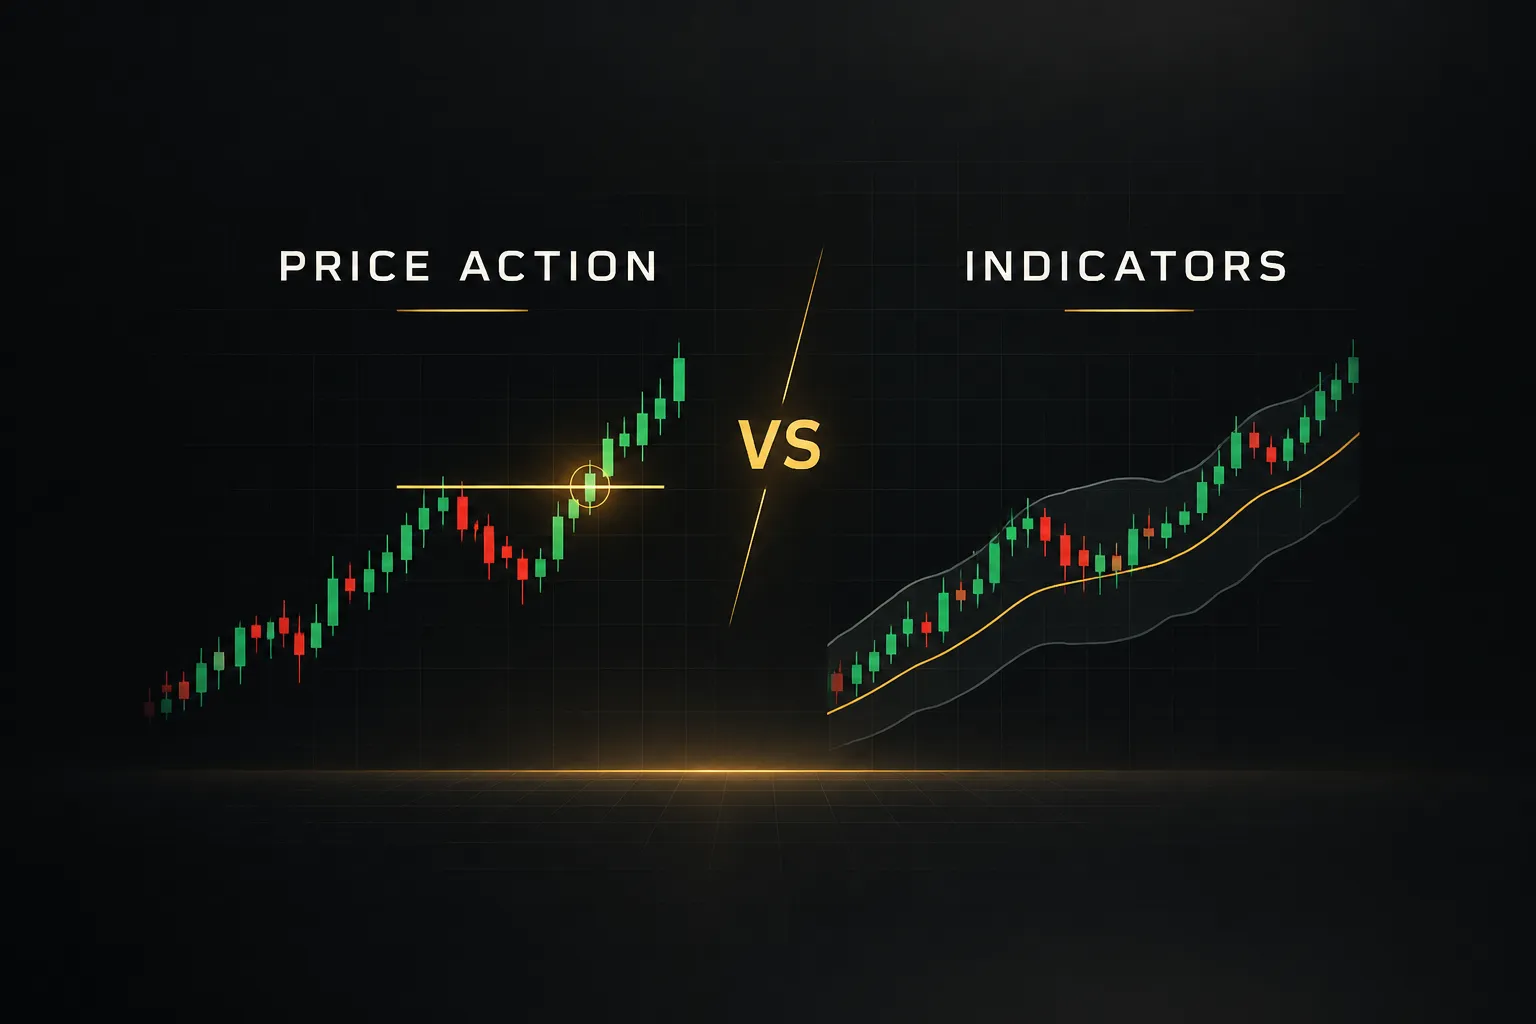
Quick verdict: pure price action trading wins on context and adaptability, while pure indicator-based trading wins on objectivity and automation.
Neither wins outright.
Most consistently profitable traders end up using both.
The “price action vs indicators” debate usually gets framed as a philosophy. One camp says naked charts are the only honest way to read the market. The other says discretionary chart reading is just guessing with extra steps.
Both camps are partly right.
And both are missing the point.
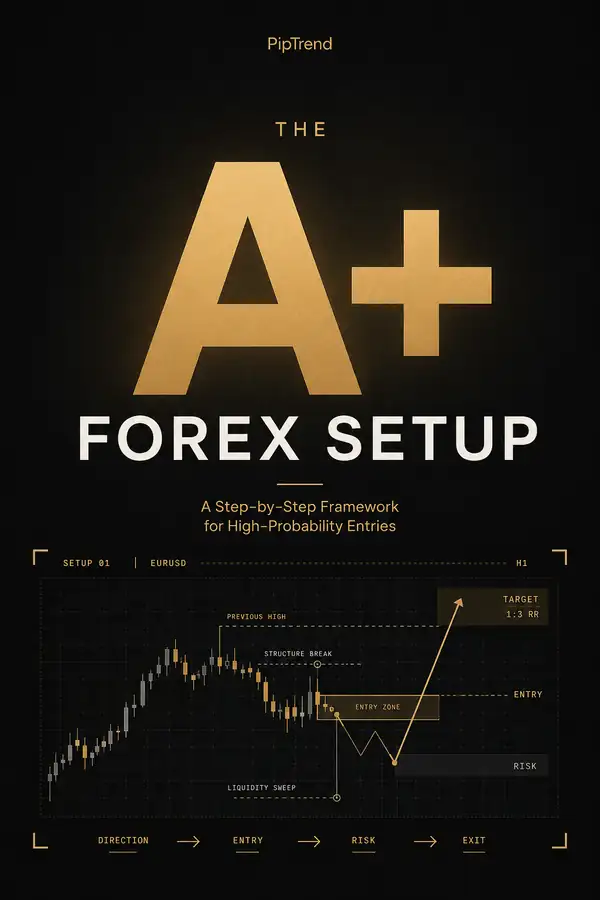
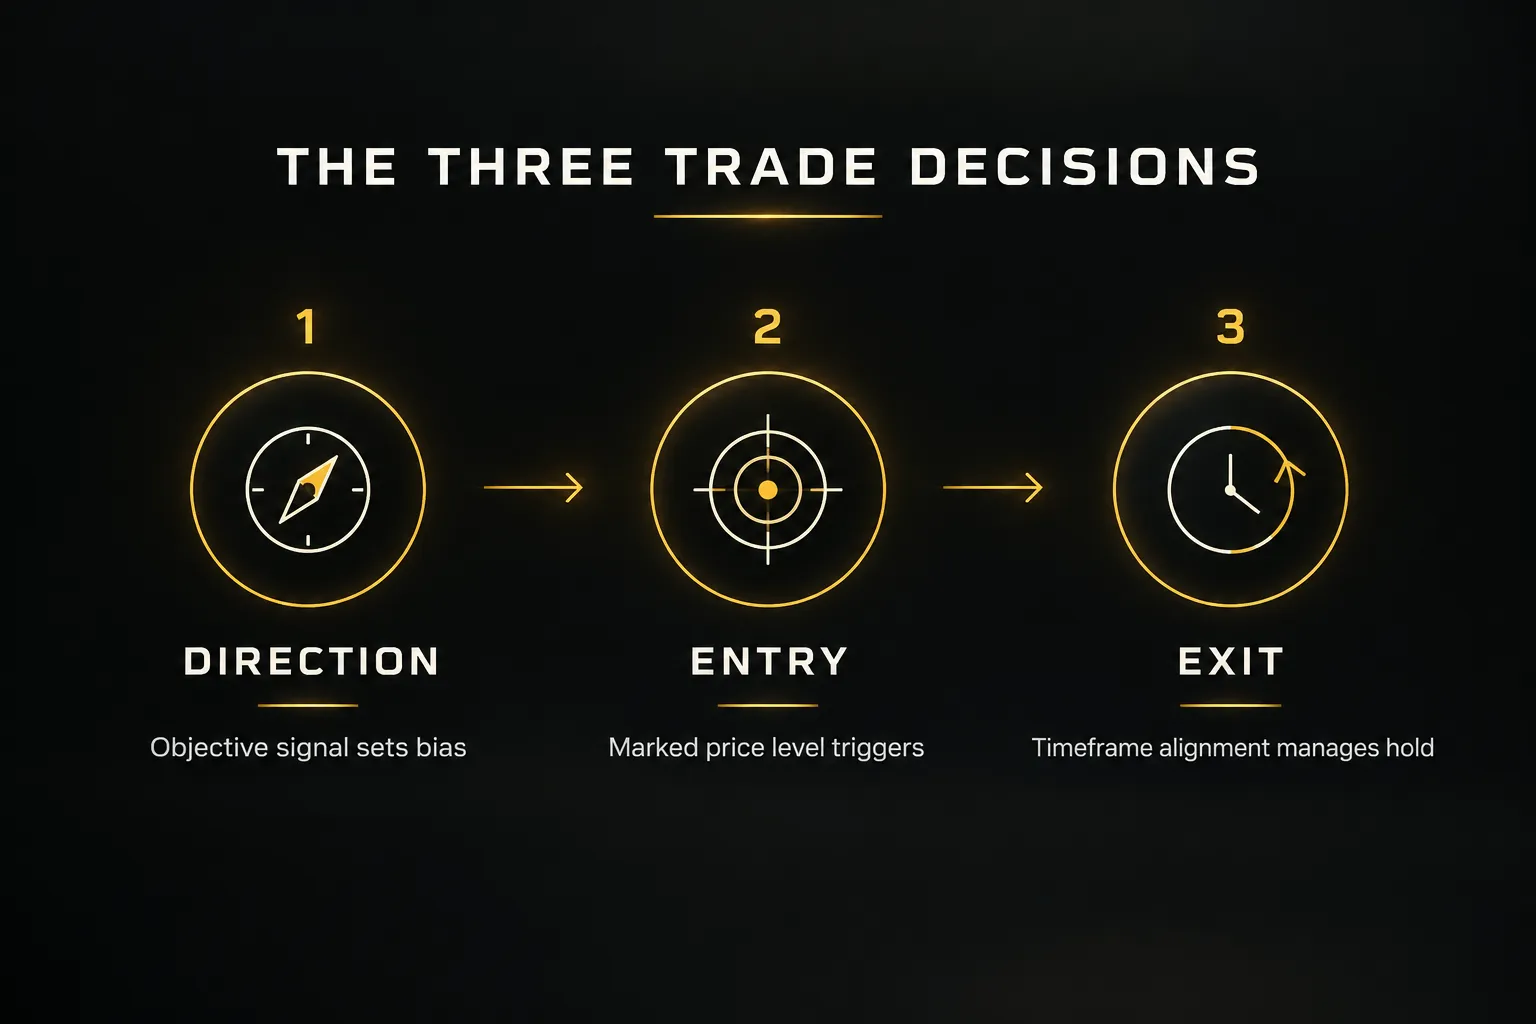
Every trade involves four separate decisions: which direction to trade, where exactly to enter, how long to hold, and when to exit.
Price action is very good at some of these jobs. Technical indicators are very good at others.
Asking which approach “wins” is like asking whether a hammer beats a screwdriver.
The more useful question is which tool should handle each decision.
Once you split the trade into parts, the debate gets practical fast. A calculated signal can tell you direction without emotion. A price-action level (a session high, VWAP, a supply zone) can tell you the exact price to enter. A multi-timeframe framework can tell you when to hold and when to take profit.
This is the logic behind systems that separate the signal (direction only) from the entry (a marked price level). It removes the biggest weakness of each approach: indicators that fire late and send you into the top of a move, and price-action reads that change depending on your mood that day.
So instead of another opinion-driven list of pros and cons, this guide uses a measurable decision matrix. We compare both approaches (and the hybrid that combines them) on signal quality, entry precision, exit rules, repainting, alerts, cost, and workflow, with real 2026 pricing for the leading TradingView indicator suites.
Price action vs indicators at a glance
Price action wins on reading context and adapting to regime changes. Indicators win on objectivity, automation, and backtestable rules.
A hybrid system keeps the strengths of both by assigning each one a specific job: the signal handles direction, and the price-action level handles entry.
| Factor | Pure price action | Pure indicators | Hybrid (signal + price-action level) |
|---|---|---|---|
| Learning curve | Steep. Often takes years of screen time | Moderate. Rules are learnable in weeks | Moderate. Fixed rules, with structure taught by the levels on the chart |
| Subjectivity | High. Two traders can read the same chart differently | Low. Same inputs produce the same output | Low for direction, low for entry once levels are plotted automatically |
| Entry precision | High, if the trader identifies levels correctly | Low to moderate. Crossovers often trigger after the move starts | High. Entry comes from a marked price, not the signal candle |
| Exit rules | Discretionary and emotion-prone | Mechanical, but can exit late on lagging tools | Multi-timeframe alignment defines hold vs take-profit |
| Alerts | Manual monitoring or basic horizontal-line alerts | Push, email, and desktop alerts on any condition | Alerts on signals across any timeframe and instrument |
| Repainting risk | None from code, but hindsight bias on historical charts | Varies. Some indicators repaint, some confirm on candle close | Low when signals confirm on candle close |
| Adaptability to regime change | Strong. Experienced traders adjust in real time | Weak. Fixed parameters struggle when volatility shifts | Moderate to strong. Adaptive trend detection plus price-derived levels |
| Cost (2026) | Free (paid in screen time) | LuxAlgo $24.99-$119.99/mo, Zeiierman $37.99-$95.20/mo | PipTrend $40-$59.99/mo |
Read the table by rows, not columns.
Price action’s weakest row is subjectivity. Indicators’ weakest row is entry precision.
The hybrid approach exists to fix exactly those two weaknesses without giving up what each method does well.
Price action vs indicators: how each approach actually works
There is no single winner at the method level.
Price action supplies context, and indicators supply confirmation.
Treating them as opposites is the most common mistake in trading education, and it keeps a lot of traders stuck switching between camps every few months.
Price action trading: reading raw market structure
Price action trading means making decisions from the chart itself: candles, swing highs and lows, market structure, support and resistance, and how price reacts at those areas.
No calculated overlays.
Just what price did and where it did it.
Strengths: context, adaptability, no lag
Price action has zero calculation lag. A rejection wick at a prior day high is visible the moment it forms, not three candles later when an average catches up.
It also carries context that a single number can’t.
A skilled trader sees that a breakout happened during the Asian session on thin liquidity, or that price swept a session low before reversing. That kind of read adapts naturally when a market shifts from trending to ranging.
Limits: subjective, experience-dependent, hard to automate or backtest objectively
The same chart produces different reads from different traders.
Sometimes from the same trader on different days.
Where exactly is the swing high? Was that a break of structure or a liquidity grab? Without fixed definitions, the answers drift.
That subjectivity makes backtesting and forward testing unreliable. Scrolling back through history, every setup looks obvious… because you already know what happened next.
And discretionary reads can’t trigger an alert while you sleep.
Indicator-based trading: rules built on calculated data
Indicator-based trading uses formulas applied to price, volume, or time to produce objective readings. The appeal is simple: the same inputs always produce the same output, which means rules can be written, tested, and automated.
Trend-following, momentum, volatility, volume, and level-based indicators are not the same thing
Most “price action vs indicators” articles lump every indicator together as laggy.
That’s lazy.
Indicators fall into distinct categories, and they behave very differently:
- Trend-following: moving averages and adaptive trend filters. They define direction and lag by design, which is the trade-off for filtering noise.
- Momentum indicators: RSI and MACD measure the speed of price change. Useful for spotting exhaustion, but prone to false readings in strong trends.
- Volatility: ATR and bands measure range expansion and contraction, which helps with stop placement and sizing.
- Volume analysis: volume profiles and VWAP show where real participation happened.
- Level-based: session highs and lows, previous day high and low, supply and demand zones, and fair value gaps. These are price-derived, not oscillators.
That last category matters most for this debate.
Level-based tools are price action, just plotted objectively by code instead of drawn by hand. You keep price-based analysis and remove the guesswork about where the level sits.
This is also where the leading versus lagging indicators argument falls apart.
A moving average crossover lags. A plotted session low doesn’t.
It’s the exact price where liquidity sits right now.
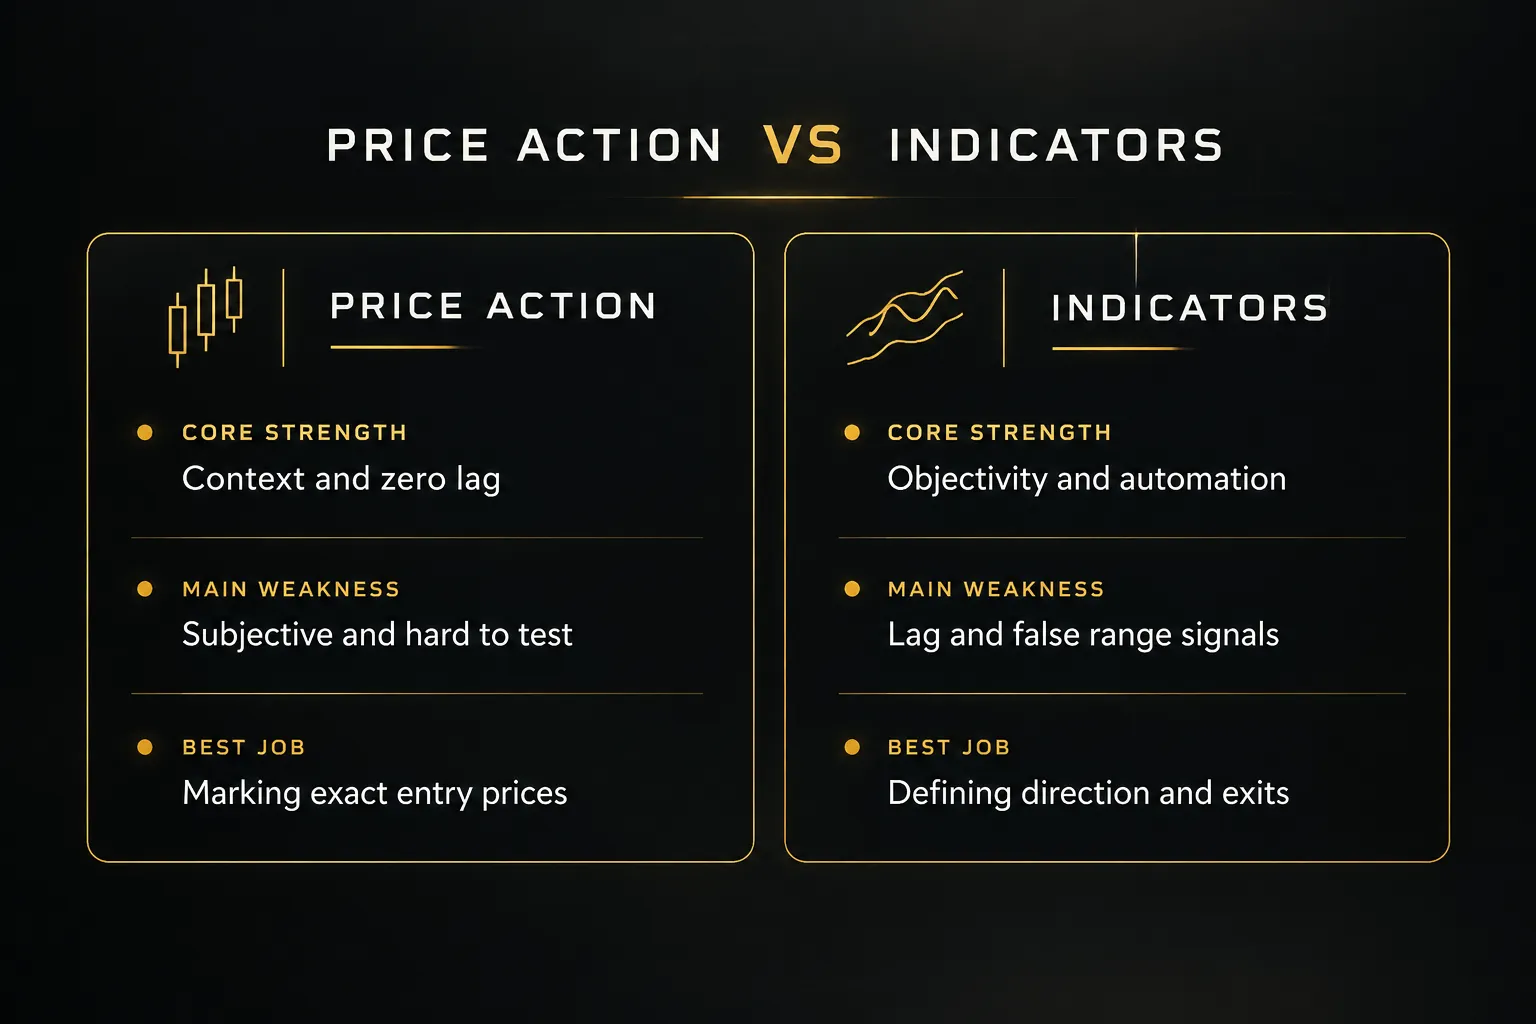
Strengths: objective, repeatable, alertable; limits: lag, parameter curve-fitting, false signals in ranges
Indicators remove emotion from the decision. A rule either fires or it doesn’t, and trading alerts can watch dozens of charts at once.
But the weaknesses are real.
Trend tools lag.
Parameters tuned to last year’s data often fail on this year’s (classic curve-fitting). And most trend indicators whipsaw in sideways markets, printing buy and sell signals back to back while the range chops your account apart.
Here’s the practical takeaway.
Use a calculated signal to decide direction, where objectivity matters most. Use a price-action level to decide entry, where precision matters most.
Each approach then covers the other’s blind spot.
Signal quality, entries, and exit precision
No method is more accurate in isolation.
Accuracy depends on how many independent confirmations line up (direction, location, timeframe alignment), not on which ideology you follow.
The clearer way to compare is to break a trade into three distinct decisions and judge each one separately.
| Decision | Pure price action | Pure indicators | Hybrid (signal + level) | Winner |
|---|---|---|---|---|
| Overall accuracy | Depends on trader skill | Depends on market condition and settings | Depends on confluence across direction, level, and timeframes | Tie (confluence decides) |
| Direction | Discretionary structure read | Objective trend or momentum signal | Objective signal with whipsaw filter | Indicators / hybrid |
| Entry location | Exact price at a hand-drawn level | Crossover or signal candle, often late | Exact price at an automatically plotted level | Price-action levels |
| Holding period and exit | Emotional, discretionary | Rule-based (trend tables, trailing logic) | 12-timeframe alignment table | Indicator-based tools |
| Behavior in ranges | Good, if trader recognizes the range | Poor. Frequent false signals | Filtered. Gray candles while trend forms | Price action / hybrid |
| Risk of buying tops / selling bottoms | Moderate (FOMO entries) | High (entering on the signal candle) | Low (wait for pullback to level) | Hybrid |
Direction: objectivity beats opinion
Direction is where discretionary trading leaks the most money. A trader who “feels” bearish will find bearish patterns everywhere.
A calculated trend-following system doesn’t care what you feel.
PipTrend’s smart signal engine handles this job with color-coded candles: green for bullish momentum, red for bearish pressure, and gray while a trend is still forming. A whipsaw filter keeps traders out of choppy, low-probability conditions, which addresses the classic indicator failure in ranges.
Entry location: price-action levels win
This is price action’s clearest victory.
Session highs and lows, VWAP, and order blocks mark exact prices. Indicator crossovers mark a zone where something already happened, usually after a chunk of the move is gone.
Ever taken a buy signal, watched price immediately pull back, and got stopped out right before the move continued?
That’s what happens when the signal doubles as the entry.
The signal was right.
The location was wrong.
PipTrend’s core design fixes this by separating the two.
The signal shows direction only. The entry comes from a marked price level: session highs and lows, previous day high and low, VWAP, supply and demand zones with mitigation tracking, fair value gaps, or the Confidence Band, a dynamic zone that acts as support in uptrends and resistance in downtrends.
Verdict on entries: let indicators tell you which way to trade, but let price tell you where. Entering on the signal candle is the single most common reason a correct directional call still loses money.
Exits: rules beat discretion
Exits are where good trades go to die.
Traders cut winners early out of fear and hold losers out of hope. Pure price action offers little protection against this, because every exit is a fresh judgment call.
Indicator-based exit frameworks win here.
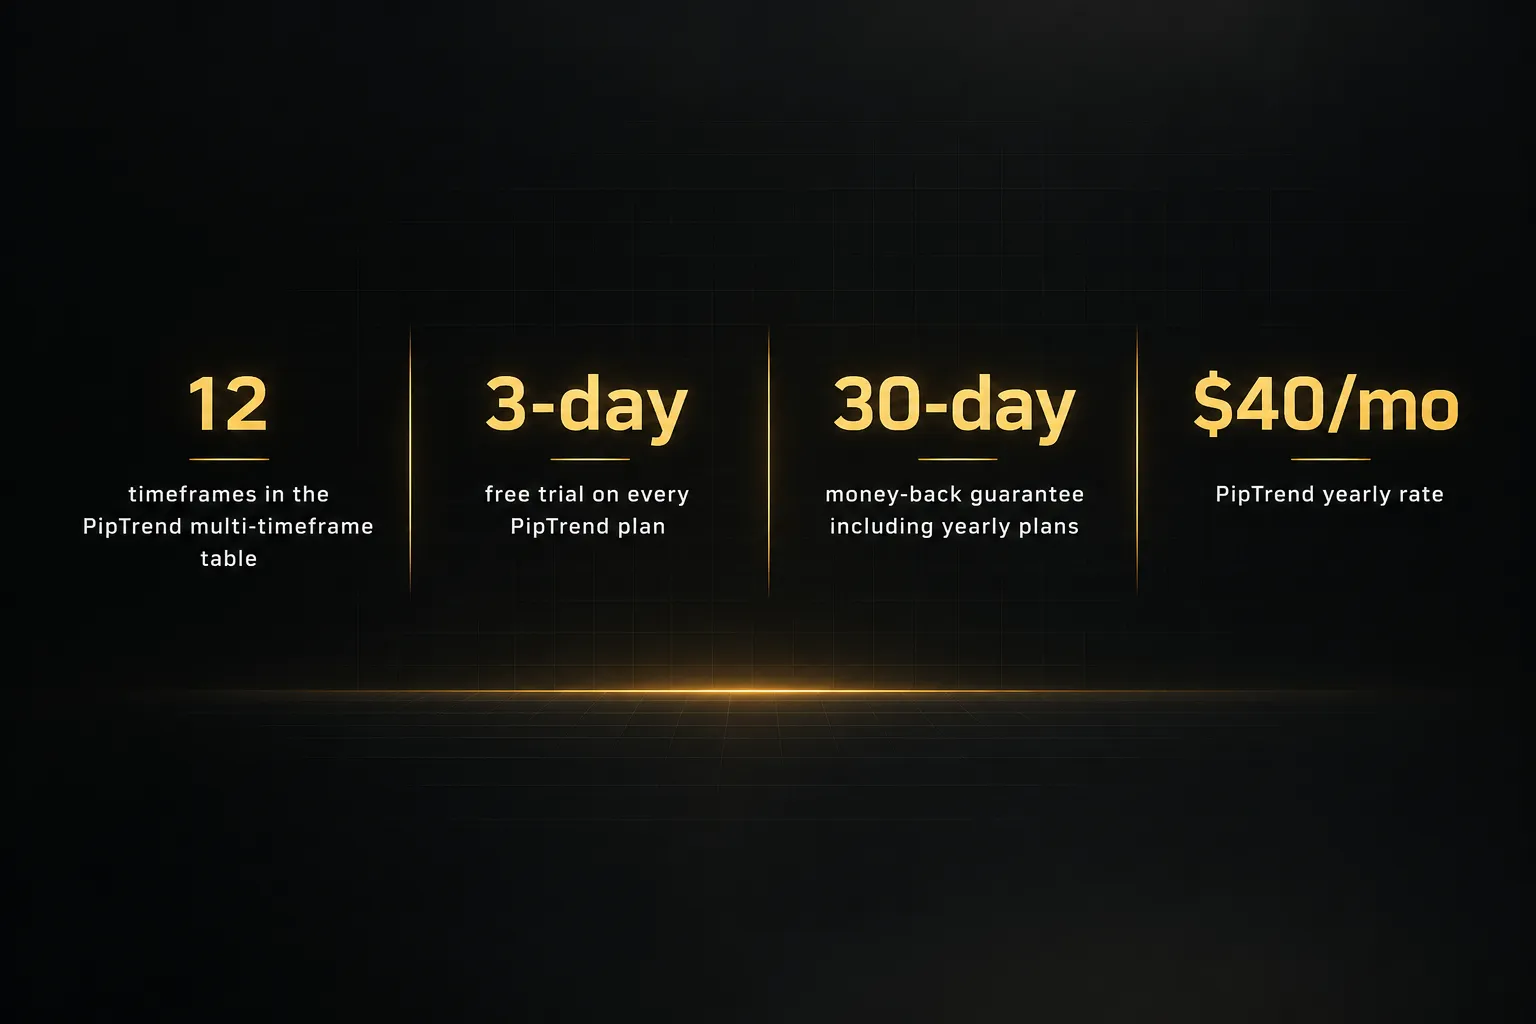
Multi-timeframe analysis gives a concrete reason to hold: if higher timeframes still agree with your trade, you stay in. PipTrend’s table shows BUY, SELL, or NEUTRAL status across 12 timeframes, from 1-minute to Monthly, so the hold-or-take-profit decision becomes a reading, not a mood.
Most comparison articles never split direction, entry, and exit apart.
But once you do, the answer to “price action vs indicators” stops being either/or.
It becomes: indicators for direction and exits, price-action levels for entries.
Repainting, alerts, cost, and market coverage
Candle-close-confirmed, non-repainting signals win on reliability.
They beat both repainting indicators and discretionary calls made in hindsight.
For always-on execution, indicator alerts beat price action outright, because price action requires someone watching the chart.
Reliability and alerts by approach
| Factor | Pure price action | Repainting indicators | Candle-close-confirmed indicators | Winner |
|---|---|---|---|---|
| Historical chart honesty | Hindsight bias makes past setups look obvious | Past signals shift after the fact | Printed signal stays fixed after candle close | Candle-close confirmation |
| Backtest reliability | Low (subjective) | Misleading | High | Candle-close confirmation |
| Alerts | Manual or basic line alerts | Available, but may trigger then vanish | Push, email, desktop on confirmed signals | Confirmed indicator alerts |
| Screen time required | High | Moderate | Low | Confirmed indicator alerts |
| Workflow simplicity | Clean chart, heavy mental load | Often stacked 5+ tools | One signal, one entry layer, one table | Purpose-built system |
Repainting indicators are the hidden trap in many TradingView indicators. A signal appears, you act on it, and then it disappears or moves once the candle closes.
On a historical chart, those indicators look nearly perfect.
In live trading, they aren’t.
PipTrend signals confirm on candle close: once the candle closes, the printed signal does not change. Zeiierman’s documentation makes a similar claim for its premium scripts.
Ask any vendor this question before you pay.
Cost comparison: 2026 indicator pricing and reviews
Pure price action is free.
But it isn’t cheap.
You pay in screen time, often years of it, before the reads become consistent. Paid suites trade money for structure and automation, and the price spread across vendors is wide.
| Product | Monthly price | Best long-term rate | Free trial / free tier | Guarantee and refund notes |
|---|---|---|---|---|
| PipTrend | $59.99/mo | $40/mo ($479.99/yr); $45/mo quarterly ($134.99) | 3-day free trial on all plans | 30-day money-back guarantee on all plans |
| LuxAlgo | $24.99-$119.99/mo by tier | Annual billing available; renews at standard rate | Free plan | Advanced features split across higher tiers |
| Flux Charts | Not fully listed | $59.99/mo billed yearly ($719.88) | 50+ free indicators | Only monthly plans qualify for 30-day guarantee |
| ChartPrime | $67/mo Pro, $117/mo Plus | Yearly option shown, full price not listed | Not stated | Plan terms can vary by promotion |
| Zeiierman | $95.20/mo | $455.82/yr; promo $37.99/mo yearly; $1,999 lifetime | Not stated | Access ends when subscription ends |
| Market Cipher | No monthly plan listed | $1,000/yr ($600 promo); $3,000 lifetime ($1,500 promo) | Not stated | High upfront commitment |
| AlgoXpert | $79/mo | $58/mo ($696/yr); $66/mo quarterly ($198) | 7-day free trial | Same features on all plans |
The sticker price is only half the story.
Check four things most roundups skip: free trial length, money-back guarantee terms, TradingView compatibility (LuxAlgo, Zeiierman, and AlgoXpert confirm their tools work without a paid TradingView plan), and whether refunds apply to yearly plans.
Flux Charts, for example, excludes yearly plans from its 30-day guarantee.
PipTrend’s 30-day guarantee covers every plan, including yearly. That makes the $40/mo annual rate a lower-risk commitment than an annual plan you can’t get refunded.
Market coverage and workflow
Most major suites run on TradingView and cover multiple asset classes. PipTrend works across Forex, Crypto, Indices, Commodities, and Stocks, with common instruments including EUR/USD, GBP/JPY, XAU/USD, BTC/USD, US30, and NAS100.
Workflow is where many traders lose their edge without noticing. Stacking five or more separate indicators creates clutter, conflicting signals, and decision paralysis.
More tools rarely means more edge.
A purpose-built setup (one signal, one entry layer, one timeframe table) keeps every tool responsible for one decision.
Who should choose what
Bottom line: most retail traders are better served by a hybrid system than by either pure approach.
But the right choice depends on your timeframe, experience, and how much screen time you can realistically commit.
Choose pure price action if…
- You trade low-timeframe scalps in highly liquid markets where reading order flow in real time matters more than any calculated signal.
- You already have years of screen time and can read market structure consistently without written rules.
- You’re comfortable with discretionary exits and have the emotional discipline to follow through.
- Drawback: no automation, limited alerts, and little ability to backtest your edge objectively.
Choose pure indicators if…
- You want fully mechanical, backtestable rules that produce the same decision every time.
- You plan to automate execution or run strategies through webhooks.
- You don’t need discretionary market-structure judgment and prefer to accept some lag in exchange for objectivity.
- Drawback: late entries and false signals in ranging markets unless you add filters.
Choose a hybrid signal-plus-level system (like PipTrend) if…
This is the best fit for most traders who understand the basics but struggle with consistency.
PipTrend gives objective direction from the smart signal engine, precise price-action entries from session liquidity levels and the Confidence Band, and a multi-timeframe exit framework, all in one workflow.
- Day traders: use session highs and lows, VWAP, and session killzones (Asian, London, New York AM, New York PM, adjusted to your timezone) for precise intraday entries on 1-minute to 15-minute charts.
- Swing traders: read direction from H8 and Daily, then confirm alignment in the multi-timeframe table before entering.
- Long-term investors: use Weekly and Monthly color-coded candles to time entries into major trends.
- Prop-firm challenge participants: follow fixed rules (signal for direction, liquidity level for entry, timeframe table for exits) to stay consistent and inside drawdown limits.
- Honest limitations: the monthly plan at $59.99 is pricier than LuxAlgo’s entry tier, and the 3-day trial is shorter than AlgoXpert’s 7 days. The 30-day guarantee on every plan offsets most of that risk.
Choose a broad multi-tool platform (LuxAlgo, Zeiierman) if…
- You want to build custom strategies from dozens of components. Zeiierman lists more than 80 premium tools; LuxAlgo spans price action, signals, order flow, backtesting, and AI features.
- You enjoy experimenting and don’t mind a steeper learning curve.
- You can tolerate more chart clutter and have the discipline to pick a few tools and ignore the rest.
- Also consider: AlgoXpert for session-based futures and intraday auction-theory traders, Flux Charts for screeners plus live education, ChartPrime for a community-heavy package, and Market Cipher if you specifically want its proprietary momentum tools and accept a high upfront cost.
A practical note on risk
No method eliminates risk.
Not price action, not indicators, not a hybrid.
Trade expectancy, position sizing, and execution discipline decide outcomes regardless of approach.
A strong entry and exit strategy with poor risk management still blows accounts. Run the numbers on position size, risk-reward, and expectancy before every system you test (PipTrend includes free calculators for each of these).
FAQ
Is price action more accurate than indicators?
No, neither is inherently more accurate.
Accuracy comes from confluence and risk management, not the method itself.
A trade where an objective signal, a precise price-action level, and higher-timeframe alignment all agree will outperform either approach used alone.
Price action is more precise for entry location. Indicators are more reliable for consistent direction and exit rules.
Combine them and you get the best of both.
Which is better for beginners, price action or indicators?
Beginners should start with objective indicator rules, then layer in price-action context as experience builds. Clear rules reduce early mistakes and make it possible to track what works.
Pure price action asks beginners to make dozens of subjective calls per trade with no reference point. A hybrid system shortens the learning curve, because the price-action levels are plotted for you and you learn market structure by watching how price reacts to them.
Can price action replace technical indicators?
Not fully.
Price action can’t replace indicators for automated alerts, multi-timeframe confirmation, or hands-off monitoring. You’d have to watch every chart yourself, across every timeframe, all day.
For traders with jobs, families, or multiple instruments to track, that’s not realistic.
Indicators handle the monitoring. Price action handles the precision.
What indicators work best with price action?
Level-based, price-derived tools work best with price action: VWAP, session highs and lows, previous day high and low, supply and demand zones, and fair value gaps.
They aren’t lagging oscillators.
They mark real prices where liquidity and participation sit.
VWAP trading and session levels are especially useful for intraday entries, while supply and demand zones with mitigation tracking help swing traders identify where institutional orders may still be resting.
Do indicators actually work in trading?
Yes, when matched to the right category and market condition.
Trend tools work in trends. Momentum tools help spot exhaustion. Volume tools show participation. Level-based tools mark entries.
Indicators fail when used universally or in isolation, such as running a trend-following crossover in a tight range. Pick the category that fits the job, and favor signals with candle-close confirmation so your backtests reflect what you’d see live.
What is the best trading system for price action and indicators?
PipTrend is the best trading system for combining price action and indicators in 2026. Direction comes from the smart signal engine, entries come from price-action levels (session highs and lows, VWAP, supply and demand zones, fair value gaps, and the Confidence Band), and exits come from the 12-timeframe confirmation table.
It also publishes trade ideas taken with the indicator on a public results page, backed by verified cTrader statements, losses and break-evens included. Plans start at $40/mo billed yearly, with a 3-day free trial and a 30-day money-back guarantee on every plan, so you can test the signal-plus-level approach on a live chart before committing.
Sources
Risk Disclaimer: Trading involves risk. Past performance doesn't guarantee future results. Only trade with money you can afford to lose. PipTrend is a tool to assist your trading decisions, not financial advice.