Market Structure Trading: A Trader's Practical Guide
On this page
Why Structure Reads Go Wrong
Hand the same 4-hour chart to ten traders and ask them to mark the most recent break of structure. You will get four or five different levels.
Sometimes more.
That is not a skill gap.
It is a definition gap.
Almost every guide to market structure trading teaches the shapes (higher high, higher low, lower high, lower low) without ever defining what makes a swing point significant enough to count.
Without that rule, structure becomes whatever you want it to be after the fact. The chart always looks obvious in hindsight because your eye is drawn to the swings that worked.
If your structure rules cannot be written down and handed to another trader who then marks the same levels you did, you do not have rules. You have opinions with candlestick decoration.
This guide fixes that in three moves. First, it separates chart structure (the raw sequence of swings that gives you context) from Smart Money Concepts terminology (BOS, CHoCH, MSS, liquidity sweeps) which is interpretation layered on top of that context.
Second, it gives you fixed confirmation criteria so a break is either valid or it is not, with no room for negotiation mid-trade.
Third, it shows where structure actually fits in a trading plan.
Structure tells you the context and the invalidation point.
It does not tell you the exact price to click buy.
That job belongs to a precision entry method, and the last third of this article covers how the two layers work together.
Read structure first. Guess less.
What Market Structure Trading Actually Means
Search “market structure” and you will land in two completely different conversations.
One is about swing highs on a chart. The other is about exchange matching engines and academic finance papers.
Two Definitions You Need to Separate
Technical market structure is the framework traders build from swing highs and swing lows to describe whether price is trending, ranging, or transitioning. It is a visual, price-action-based read of the chart.
Market microstructure is an academic field studying how orders actually get executed: bid-ask spread behaviour, order book depth, market maker inventory, latency, and exchange mechanics.
Serious research area.
Almost never what a retail trader means.
When someone on a trading forum says “wait for market structure to shift,” they mean the first definition, every time. This article uses the technical definition throughout.
That distinction matters more than it sounds.
Microstructure concepts (liquidity, order flow, stop clusters) get borrowed into retail terminology, often loosely. Knowing which layer you are actually looking at keeps you honest about what your chart can and cannot tell you.
Why Not Every Swing Point Matters
Here is the rule most guides skip.
A swing point only counts as structurally significant if price closes beyond a prior meaningful high or low and then shows follow-through.
Not every three-candle fractal.
Not every wick that pokes above the candle either side of it.
A fractal is a pattern.
A structural swing is a pattern that did something.
Concretely, on your working timeframe, a swing high qualifies as significant when the move away from it covers a distance comparable to recent average range, and when the subsequent break of a prior low is confirmed by a candle body close rather than a wick.
Pick one definition and apply it to every chart.
Consistency beats precision here.
Why does this matter so much?
Because treating minor fractals as major structure produces a chart covered in fifteen BOS labels per session, most of which contradict each other. You end up flipping market bias every twenty minutes and calling it “reading price action.”
The clutter problem is real and measurable.
On a 5-minute EURUSD chart during London session, a loose three-candle fractal rule will generate roughly 30 to 50 “swing points” in a single session. A significance filter typically cuts that to four or six.
Those four or six are the ones that actually define the trend.
Throughout this guide, these operating definitions stay fixed:
- Swing high: a high that price moved away from decisively, with a subsequent close below the preceding structural low or a clearly formed lower high.
- Swing low: the mirror image, with a close above the preceding structural high.
- Break of structure (BOS): a candle body close beyond the last significant swing in the direction of the existing trend.
- Change of character (CHoCH): a candle body close beyond the last significant swing against the existing trend.
Every example that follows obeys those four lines.
No exceptions, no retroactive relabeling.
Mapping Trends, Ranges, and Reversals
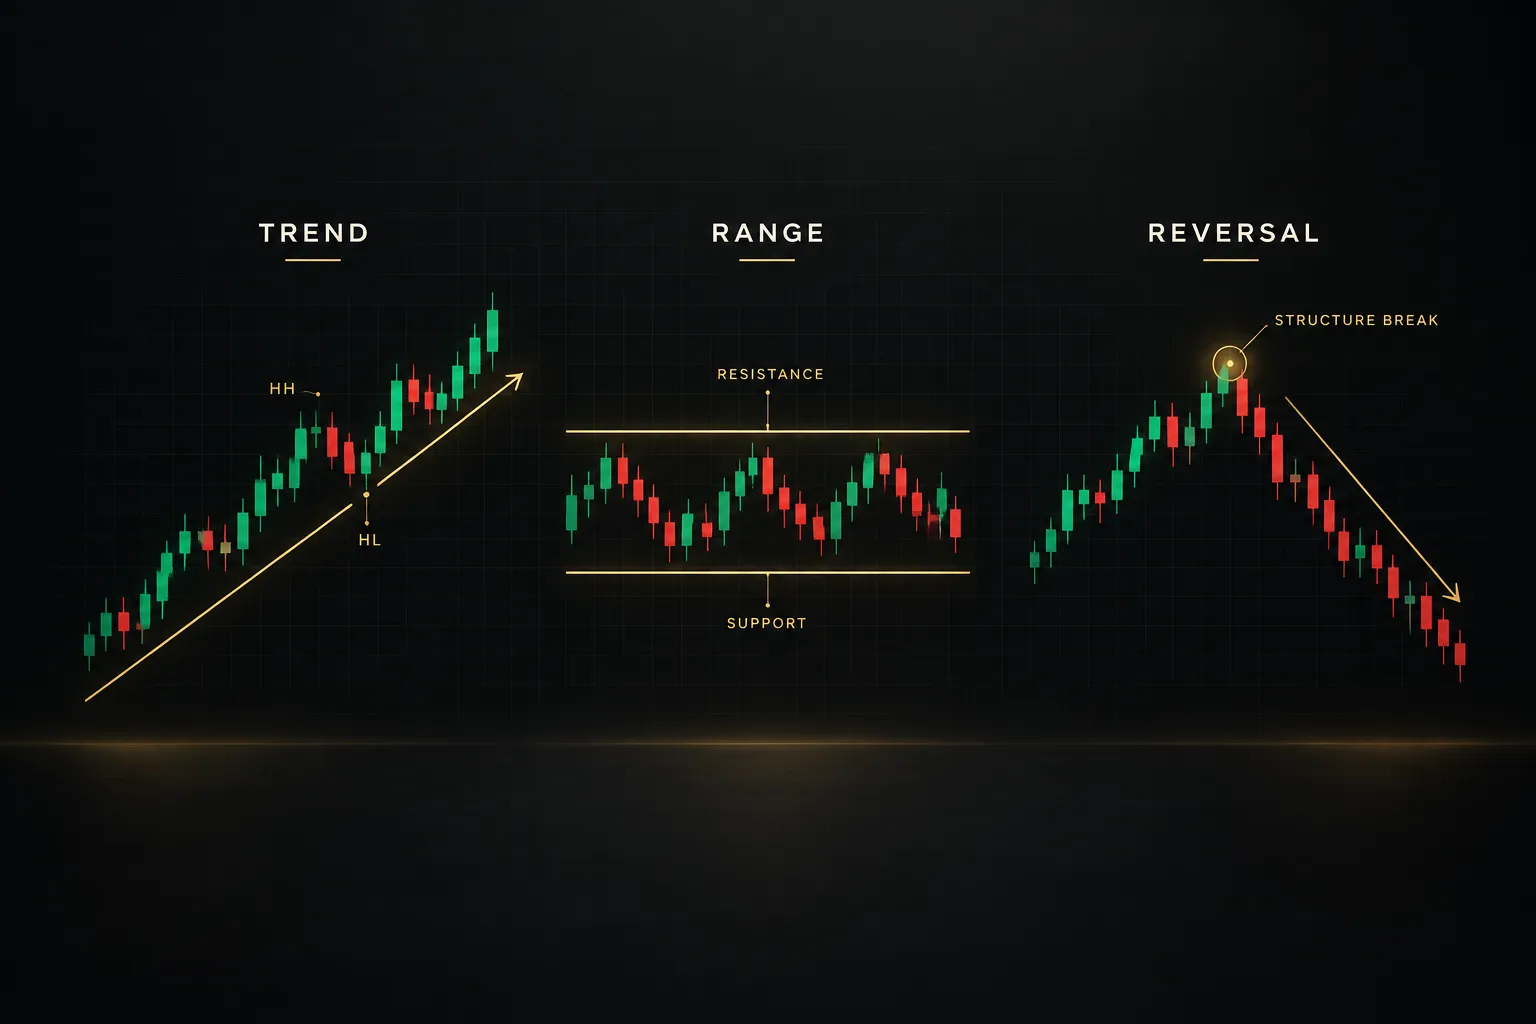
Most traders can name the four swing labels. Far fewer can explain the sequencing rule that turns those labels into a trend read.
That gap is where structure trading quietly falls apart.
HH, HL, LH, LL in Practice
Isolated swings mean nothing.
Sequences mean everything.
Here is how the four building blocks work and what sequence actually confirms a directional bias:
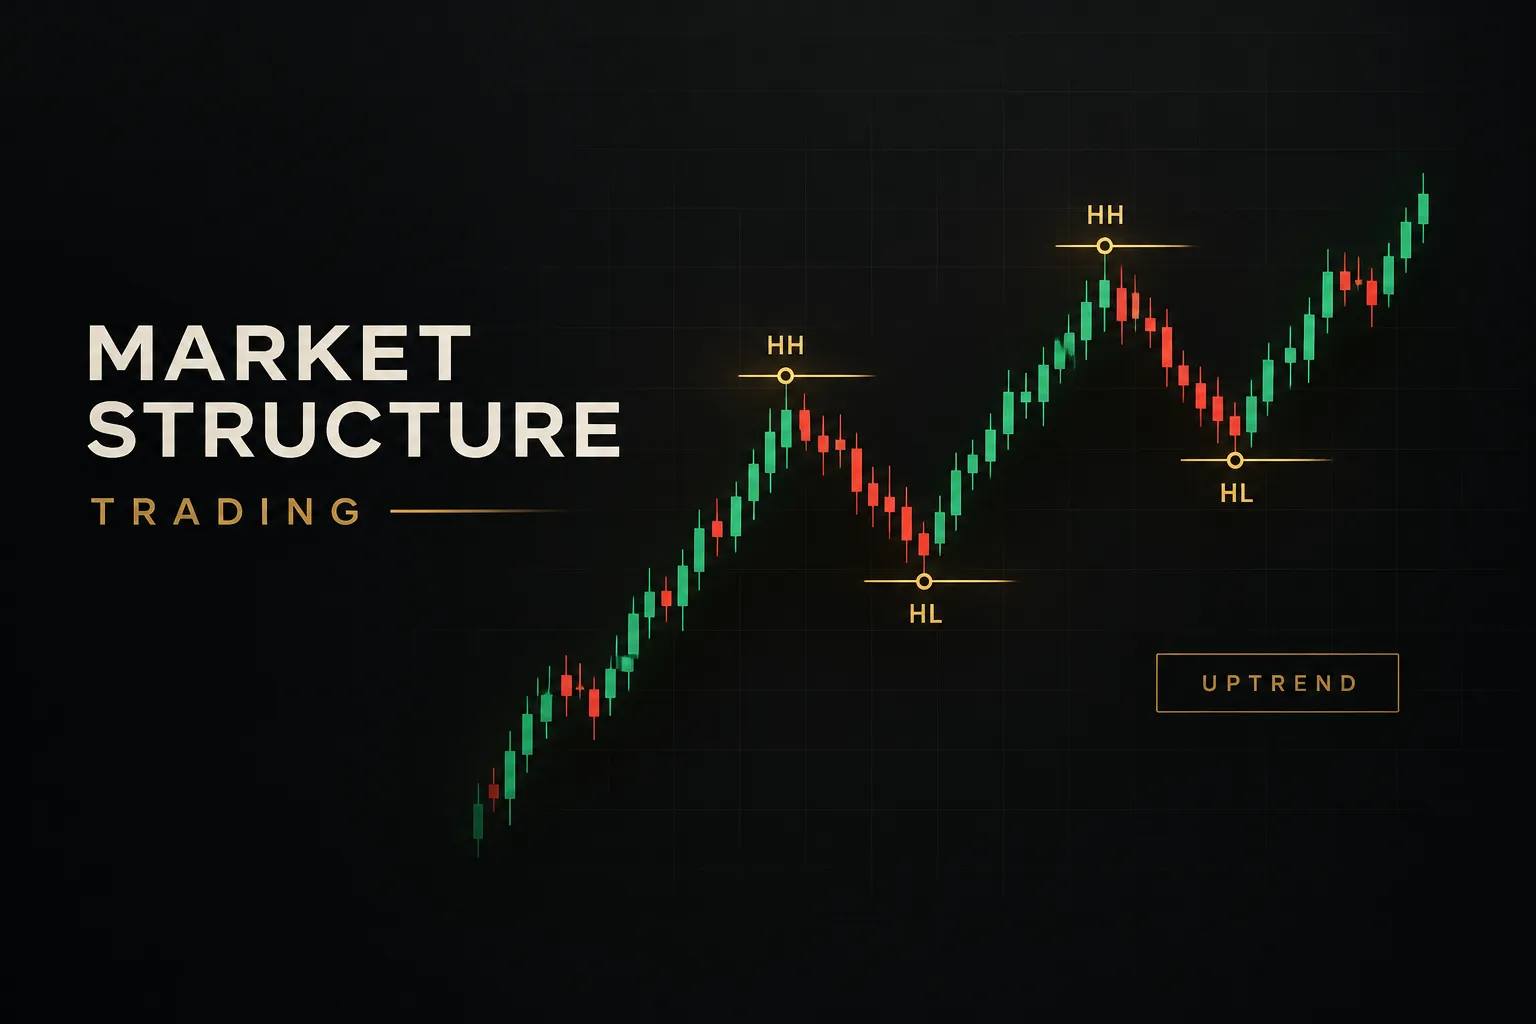
- Higher high (HH): a swing high that closes above the previous significant swing high. On its own, it might just be an overshoot in a range.
- Higher low (HL): a swing low that forms above the previous significant swing low. This is the more informative of the two bullish labels, because it proves buyers stepped in earlier than last time.
- Lower high (LH): a swing high that fails to reach the previous high. Sellers are getting more aggressive, or buyers are exhausted.
- Lower low (LL): a swing low closing beneath the prior low. Confirms sellers are winning the current leg.
- Bullish structure confirmed: requires a minimum sequence of HL, then HH, then a second HL that holds above the first. Two points draw a line. Three points confirm a trend.
- Bearish structure confirmed: the inverse, LH then LL then a second LH that fails beneath the first.
- The failure signal: in an uptrend, the first close below the most recent higher low is the warning. It does not confirm reversal, but it does void the existing sequence.
Internal vs External Structure
External structure is the sequence of major swing points that defines the overall trend on your chosen timeframe. Internal structure is the smaller sequence of pullback swings that form inside the current external leg.
Confusing the two is the single most common structure error.
A trader sees an internal bearish sequence inside a strong external uptrend, calls it a reversal, shorts into demand, and gets run over.
Read the chart in this order, every single time:
- Mark external structure first. Zoom out until you can see 50 to 100 candles and mark only the swings that clearly defined the trend. Usually four to eight points.
- Establish directional bias from external structure alone. Bullish, bearish, or ranging. Write it down before you zoom in.
- Zoom into the current leg and mark internal swings. These are your timing tools, not your bias tools.
- Use internal breaks only in the direction of external bias. An internal BOS aligned with external trend is a continuation entry. An internal CHoCH against external trend is a pullback signal at best.
- Re-check external structure after every major move. Internal structure can eventually become external structure once it breaks a major swing.
When the Market Is Just Ranging
Roughly 70 to 80% of the time, depending on instrument and timeframe, price is not trending in any usable way.
It is oscillating.
And trend logic applied to a trading range is a reliable way to lose money in small, repeated increments.
Signs you are in a range rather than a trend:
- Equal highs and equal lows: two or more swing highs terminating within a few pips of each other, and the same at the lows. Price is respecting horizontal support and resistance, not a directional sequence.
- Compression: each swing covers less distance than the last, with declining volatility. Average true range contracting over 20 periods is a decent numeric proxy.
- HH/LL logic producing contradictions: if you get a higher high followed immediately by a lower low followed by another higher high, you are not in a trend. Stop labeling.
- The choppy-market tell: repeated failed breaks of the same level without displacement. Price closes 3 pips beyond resistance, then closes back inside within two candles. Three of those in a session is a hard stop on breakout trading.
A range demands a different playbook entirely: fade the edges with tight invalidation, or stand aside and wait for a breakout with genuine follow-through.
Trying to trade continuation inside a range is how accounts bleed out.
Break of Structure vs Change of Character
These two terms carry more weight than any other vocabulary in modern price action trading. They also carry the most confusion, because different communities use different names for the same candle.
BOS and CHoCH: Working Definitions
Break of structure (BOS) signals continuation. Price closes beyond the most recent significant swing in the direction the trend is already moving. An uptrend making a new higher high is a bullish BOS.
Change of character (CHoCH) signals a potential reversal. It is the first close beyond a significant swing against the prevailing trend. In an uptrend, the first body close below the last higher low is a bearish CHoCH.
Terminology warning: many traders call this exact event a market structure shift (MSS). Some communities treat CHoCH as the internal version and MSS as the external version. Others use them interchangeably.
Pick a convention, document it, and stop arguing about vocabulary.
What Confirms a Real Break
A break is valid or it is not.
The difference comes down to four checkable criteria, applied in order.
| Criterion | Valid Break | Invalid / Suspect Break | Why It Matters |
|---|---|---|---|
| Candle close | Full body closes beyond the swing level | Wick pierces the level, body closes back inside | Wick-only breaks are the signature of a stop run, not a directional commitment |
| Displacement | Breaking candle range is 1.5x or more the recent average candle range | Breaking candle is average or below-average size | Real structural shifts come with urgency; slow drifts through a level rarely hold |
| Follow-through | Next one or two candles close in the same direction or hold beyond the level | Immediate reversal candle closing back inside prior range | Confirms participation rather than a single liquidity grab |
| Volume confirmation (optional) | Volume on break candle above the 20-period average | Volume flat or declining into the break | Useful on centralized exchanges and futures; unreliable on spot forex where volume is broker-specific |
| Higher-timeframe alignment | Break direction matches the higher-timeframe external structure | Break fights the higher-timeframe trend | Counter-trend breaks on low timeframes are pullbacks far more often than reversals |
Treat the first three as mandatory.
Volume is a bonus where the data is trustworthy. Higher-timeframe alignment determines position size rather than whether you take the trade at all.
The single most valuable rule in this table: a lower-timeframe CHoCH inside a higher-timeframe uptrend is a pullback until the higher timeframe says otherwise. A 5-minute bearish CHoCH during a daily uptrend is, statistically, just a retracement finding support.
So check the higher-timeframe external structure before acting on any lower-timeframe reversal signal.
Every time.
The 15-minute chart does not outrank the daily chart, no matter how convincing the candle looks.
Liquidity Sweeps and False Breaks
Equal highs are a magnet.
Every trader who bought the range placed a stop just beneath the equal lows, and every breakout trader placed a buy stop just above the equal highs. That clustering is visible, and it gets targeted.
A liquidity sweep is price pushing through those clustered orders, triggering them, and then reversing hard. On the chart it looks nearly identical to a valid BOS for about thirty seconds.
The distinguishing feature is almost always the close.
A sweep produces a long wick and a body that closes back inside the prior range. A genuine break produces a body close beyond the level that then holds on the retest.
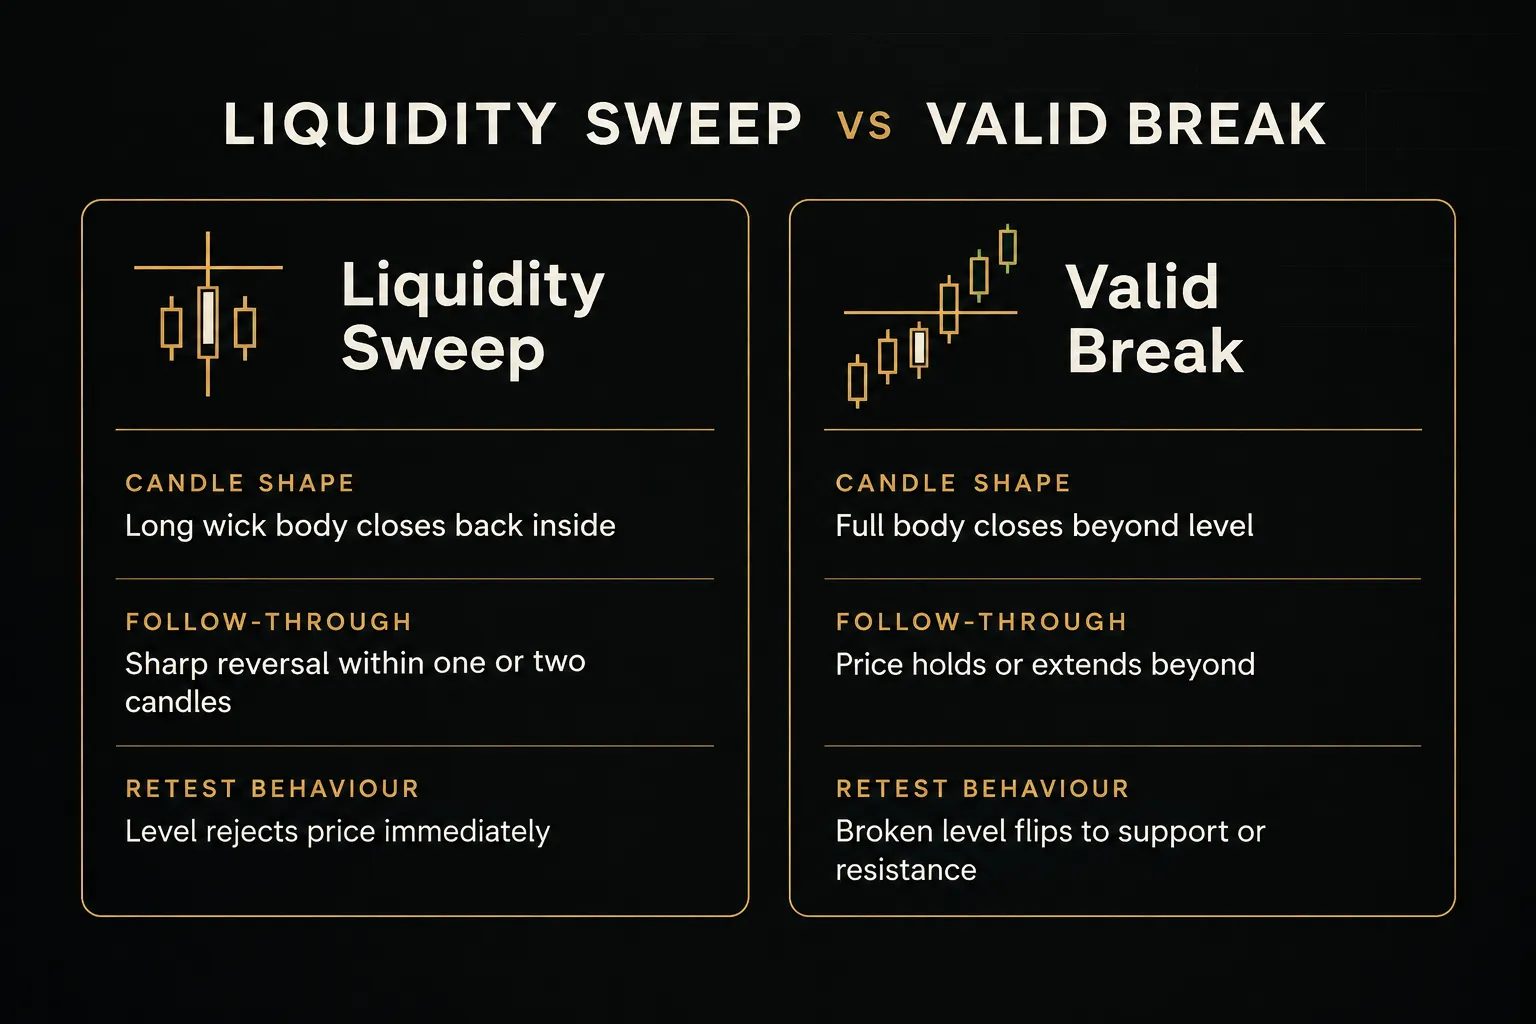
The practical rule: wait for close-and-hold, never react to the wick.
You will miss the first few pips of some genuine moves. You will also avoid the majority of stop-run traps, which is a trade you should happily make.
Building a Structure-Based Trading Plan

Structure knowledge without a plan is trivia.
Here is the workflow that turns swing labels into repeatable decisions with defined risk.
Timeframes, Sessions, and Market Differences
- Set bias on the higher timeframe. Daily or 4-hour for swing traders, 1-hour for intraday traders. Mark external structure only, and write down one word: bullish, bearish, or ranging. This read stays fixed for the session.
- Confirm structure on the middle timeframe. Typically one-quarter to one-sixth of your higher timeframe (4-hour bias to 1-hour confirmation, or 1-hour bias to 15-minute confirmation). Look for a BOS aligned with your bias or a CHoCH that warns you the bias is under threat.
- Find the entry trigger on the lower timeframe. 5-minute or 1-minute. This is where an internal CHoCH in your bias direction, or a clean retest of a broken level, becomes an actual trade.
- Handle conflicts with a hierarchy rule. When timeframes disagree, the higher timeframe wins on direction and the lower timeframe loses you the trade. No trade is a valid outcome. Trade only when at least two of three timeframes align.
- Adjust for the venue you actually trade. Centralized futures and equity exchanges give you genuine consolidated volume, so volume confirmation is meaningful. Spot forex is decentralized, meaning your broker’s volume is a proxy at best and your wick highs may differ by a pip or two from another feed.
- Account for CFDs and crypto quirks. CFD pricing is broker-derived and can print swing points that do not exist on the underlying. Crypto venues fragment liquidity across exchanges, so a sweep on one venue may not appear on another.
- Respect session timing. A breakout at 3am in a thin Asian session with a widened spread is a different animal to a London open break with real participation. Spreads, slippage, and scheduled news can all manufacture a fake break that no structure rule will save you from.
Entries, Stops, and Targets From Structure
Structure’s real gift is that it defines invalidation logically. You do not need to guess where to put a stop.
- Enter on the retest, not the break. Once a break is confirmed by close and follow-through, wait for price to return to the broken level. The broken swing should now act as support or resistance. If it does not hold, your read was wrong and you saved the trade.
- Place the stop beyond the swing that caused the break. For a bullish continuation entry, that means below the higher low that formed before the BOS, plus a buffer for spread and normal noise. This is stop-loss placement based on invalidation, not on a fixed pip count.
- Define invalidation in words before you click. “This trade is wrong if price closes below the 1.0840 higher low.” If you cannot write that sentence, you do not have a setup.
- Target the next external swing or liquidity pool. The most obvious target is the previous external high in a bullish continuation, or a cluster of equal highs where stops are sitting. Those are real destinations, not round numbers.
- Size the position from the resulting risk-to-reward ratio. Measure stop distance and target distance first, then calculate size. If the structural stop gives you a 1:1.2 risk-to-reward ratio, either skip it or wait for a deeper retest that improves the geometry.
- Never widen a stop to save a trade. The stop sits beyond structural invalidation. Moving it means you no longer believe your own read, which means you should be flat.
Indicators, PipTrend, and Backtesting Your Reads
Indicators do not replace price reading.
They also are not useless.
The honest position is that structure gives you context and invalidation, while a well-built indicator layer filters noise and speeds up confirmation.
- Use indicators as a filter, never as the primary signal. If your structural read says bullish and your trend filter says bearish, that is information about conflict, not a reason to override the chart.
- Look for directional confirmation you can see at a glance. Tools like PipTrend use color-coded trend candles so the current directional read is visible without re-marking swings mid-session, which reduces the temptation to reinterpret structure after a losing candle.
- Automate the multi-timeframe check. A multi-timeframe confirmation table does mechanically what step 4 of the workflow above does manually: it tells you whether your higher, middle, and lower timeframes agree before you commit.
- Separate the signal from the entry level. This is the part most traders skip. Structure tells you direction and invalidation; a precision layer tells you the price. PipTrend marks specific entry levels such as VWAP, supply and demand zones, and session highs and lows, which converts a directional read into an actual level rather than a market order placed on conviction.
- Track outcomes publicly or at least honestly. A public results page, like the one PipTrend maintains, is a useful model for what transparent performance tracking looks like. Whatever tool you use, log every trade whether it worked or not.
- Build a fixed backtesting template. Six columns, no exceptions: swing identification rule used, break confirmation criteria met, entry trigger, stop level, target level, and outcome in R multiples. Same rules on every chart.
- Test forward, not backward. Load a historical chart with the right edge hidden and bar-replay forward candle by candle. Marking structure in real time, without knowing the outcome, is the only test that means anything. A hindsight-perfect chart example proves nothing.
Run 50 to 100 replayed setups before risking money. Most traders discover their confirmation rules were far looser than they believed.
Market Structure FAQ
What is the best way to learn market structure trading?
Practice on historical charts using bar-replay, marking swings in real time before you know the outcome. That is the entire answer, and it is the step almost everyone skips.
Write your swing significance rule and break confirmation criteria down first. Then replay a chart forward candle by candle, marking each structural point as it forms, and log whether your read held or failed.
Scrolling back through completed charts teaches your eye to find patterns that were only obvious after the fact. Fifty forward-tested reads beats five hundred hindsight reviews.
What are the 4 types of market structure?
The four commonly referenced conditions are uptrend, downtrend, range, and transitional or reversal structure.
An uptrend shows sequential higher highs and higher lows.
A downtrend shows lower highs and lower lows.
A range shows roughly equal highs and lows with no directional sequence.
Transitional structure is the messy phase between the other three, typically following a change of character, where the old sequence has broken but a new one has not yet formed.
It is the lowest-probability environment to trade.
What is the difference between a break of structure and a change of character?
A break of structure signals continuation; a change of character signals the first potential reversal.
BOS is a close beyond the last significant swing in the direction of the existing trend. In an uptrend, that is a new higher high.
It confirms the trend is still running.
CHoCH is a close beyond the last significant swing against the trend, such as the first close below a higher low during an uptrend. Some communities call this a market structure shift or MSS.
The terminology overlaps; the concept does not change.
How do you identify a bullish and bearish market structure?
Bullish structure requires a consistent sequence of higher highs and higher lows; bearish structure requires lower highs and lower lows.
One higher high is not a trend.
You need at least three confirmed points in sequence, ideally a higher low, then a higher high, then a second higher low holding above the first.
The structure remains bullish until price closes below the most recent higher low. That close is the change of character, and the bullish read is void from that moment.
Is market structure the same as price action?
Market structure is one component of price action analysis, not a separate discipline.
Price action covers everything readable from raw price: candlestick behaviour, momentum, wick rejection, volatility expansion, and support and resistance. Market structure is specifically the swing-sequencing framework within that broader toolkit.
Treating structure as a standalone system leads to mechanical labeling with no read on context. Structure works best combined with the rest of the price action picture.
Can market structure predict where price will go next?
No.
Market structure describes context and defines invalidation; it does not forecast future price with certainty.
What it gives you is probability and a framework for risk. A confirmed bullish external structure means continuation setups have better odds than reversal setups, and it tells you exactly which level proves you wrong.
Any tool or educator presenting structure as prediction rather than context is selling certainty that does not exist. Trade the context, respect the invalidation, and let the outcome distribution do its work over a large sample.
Read the Chart, Don’t Guess It
Three rules carry most of the weight in market structure trading, and they fit on an index card.
Mark external structure first, before you zoom in and before you form an opinion.
Confirm every break with a candle body close plus follow-through, never a wick.
And treat every lower-timeframe change of character as a pullback until the higher timeframe agrees it is something more.
That is it.
Everything else is refinement.
What structure will never do is hand you an exact entry price.
It defines where you are in the market and what would prove you wrong, which is the foundation of position sizing and risk. The specific level you execute at is a separate problem requiring separate tools.
That is why the signal-and-entry separation built into tools like PipTrend is useful: directional context from structure, then a marked precision level (VWAP, a supply zone, a session high) to translate that context into a tradeable price rather than a guess dressed up as conviction.
Structure tells you the story.
Your entry method decides where you join it.
Sources
Risk Disclaimer: Trading involves risk. Past performance doesn't guarantee future results. Only trade with money you can afford to lose. PipTrend is a tool to assist your trading decisions, not financial advice.