The Stochastic Indicator: A Trader's Complete Guide
On this page
What Stochastic Actually Measures
Most traders learn the stochastic indicator backwards. They memorise “above 80 means sell, below 20 means buy” and then spend two years wondering why that rule keeps losing money in trending markets.
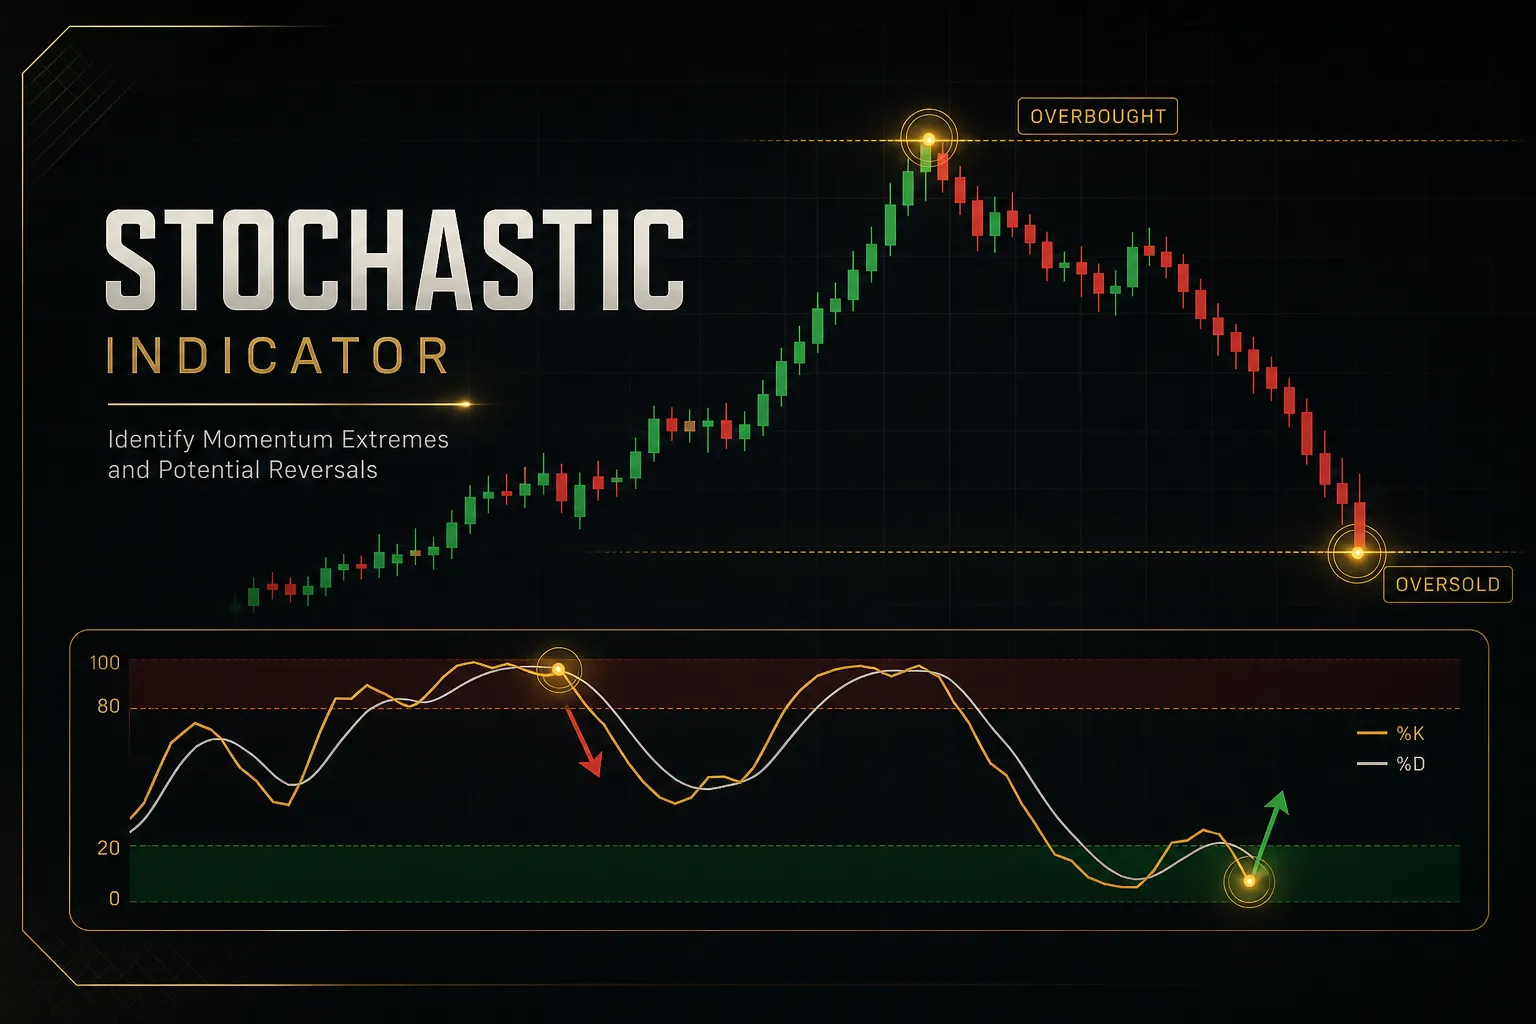
The stochastic oscillator is a momentum tool developed by George Lane in the late 1950s. It answers one narrow question: where does the current close sit inside the recent high-low trading range?
That is all it does.
It is not a price forecast, not a valuation model, and not a signal generator you can trade blind.
Lane himself was clear about this.
The oscillator tracks the speed of price, not its direction, and speed changes before direction does. A reading of 92 tells you the close landed near the top of its recent range.
It says nothing about whether the asset is expensive.
Overbought and oversold levels, %K/%D crossovers, and divergence all become useful only when you add context: the trend regime, the timeframe you are trading, the surrounding market structure, and some form of price action confirmation.
The indicator works on forex, stocks, indices, and crypto.
But interpretation has to adapt.
A stochastic reading of 15 on EUR/USD during the London session means something very different from a 15 on a low-liquidity altcoin at 3am, where a single order can drag the range around.
How the Oscillator Is Calculated
The maths behind stochastic is simple enough to do on paper, which is exactly why it survives seventy years of market evolution. Understanding the formula changes how you read the output.
The %K and %D Formulas
- Set the lookback period. Choose how many candles define the range. The default is 14 periods, meaning the indicator scans the highest high and lowest low of the last 14 bars.
- Calculate raw %K. The formula is %K = (Close − Lowest Low) ÷ (Highest High − Lowest Low) Ã, 100. This produces a value bounded between 0 and 100.
- Interpret the output as position, not price. A %K of 100 means the close printed exactly at the top of the 14-bar range. A %K of 0 means it closed at the absolute bottom.
- Derive the %D signal line. The %D signal line is a moving average of %K, conventionally a 3-period simple moving average. It smooths the jitter and gives you a second line to generate crossovers against.
- Watch the two lines interact. When the faster %K line crosses the slower %D, momentum has shifted direction within the range. That crossover is the mechanical trigger most systems build around.
Fast, Slow, and Full Stochastic
Three variants exist, and platforms label them inconsistently. The difference is purely how much smoothing gets applied.
- Fast stochastic. Plots raw unsmoothed %K against a 3-period %D. It reacts instantly and produces a large number of false signals. Most traders find it unusable on anything below the daily chart.
- Slow stochastic. Applies a 3-period average to raw %K, so the old %D becomes the new %K, and a fresh 3-period average becomes the new %D. This is the 14,3,3 setting almost everyone actually uses.
- Full stochastic. Exposes all three parameters independently: lookback, %K smoothing, and %D smoothing. Written as 14,3,3 or 21,7,7, it lets you tune sensitivity to your instrument and holding period.
A Worked Calculation Example
Numbers make this concrete.
Assume a 14-period lookback on a currency pair.
- Identify the range. Over the last 14 candles, the highest high is 1.1000 and the lowest low is 1.0800. The range is 200 pips.
- Take the current close. Price closes at 1.0960. Subtract the low: 1.0960 − 1.0800 = 0.0160, or 160 pips.
- Divide and scale. 160 ÷ 200 = 0.80, multiplied by 100 gives a raw %K of 80. The close sits 80% of the way up its recent range.
- Test the midpoint. A close at 1.0900 sits dead centre: 100 ÷ 200 = 0.50, so %K = 50. Neither buyers nor sellers dominated the range.
- Test the lower zone. A close at 1.0840 gives 40 ÷ 200 = 0.20, so %K = 20. Sellers pushed the close into the bottom fifth of the range.
- Note the trap. If the range compresses to 40 pips during a tight consolidation, a 32-pip move from the low produces the same %K of 80 for a fraction of the actual price movement. The indicator is scale-blind.
Interpreting Signals the Right Way
Overbought and Oversold Zones
Here is the sentence that costs retail traders the most money: overbought does not mean expensive.
A %K reading above 80 means the close landed in the top 20% of a rolling window.
During a strong uptrend, that is exactly what you would expect it to do, over and over, for weeks.
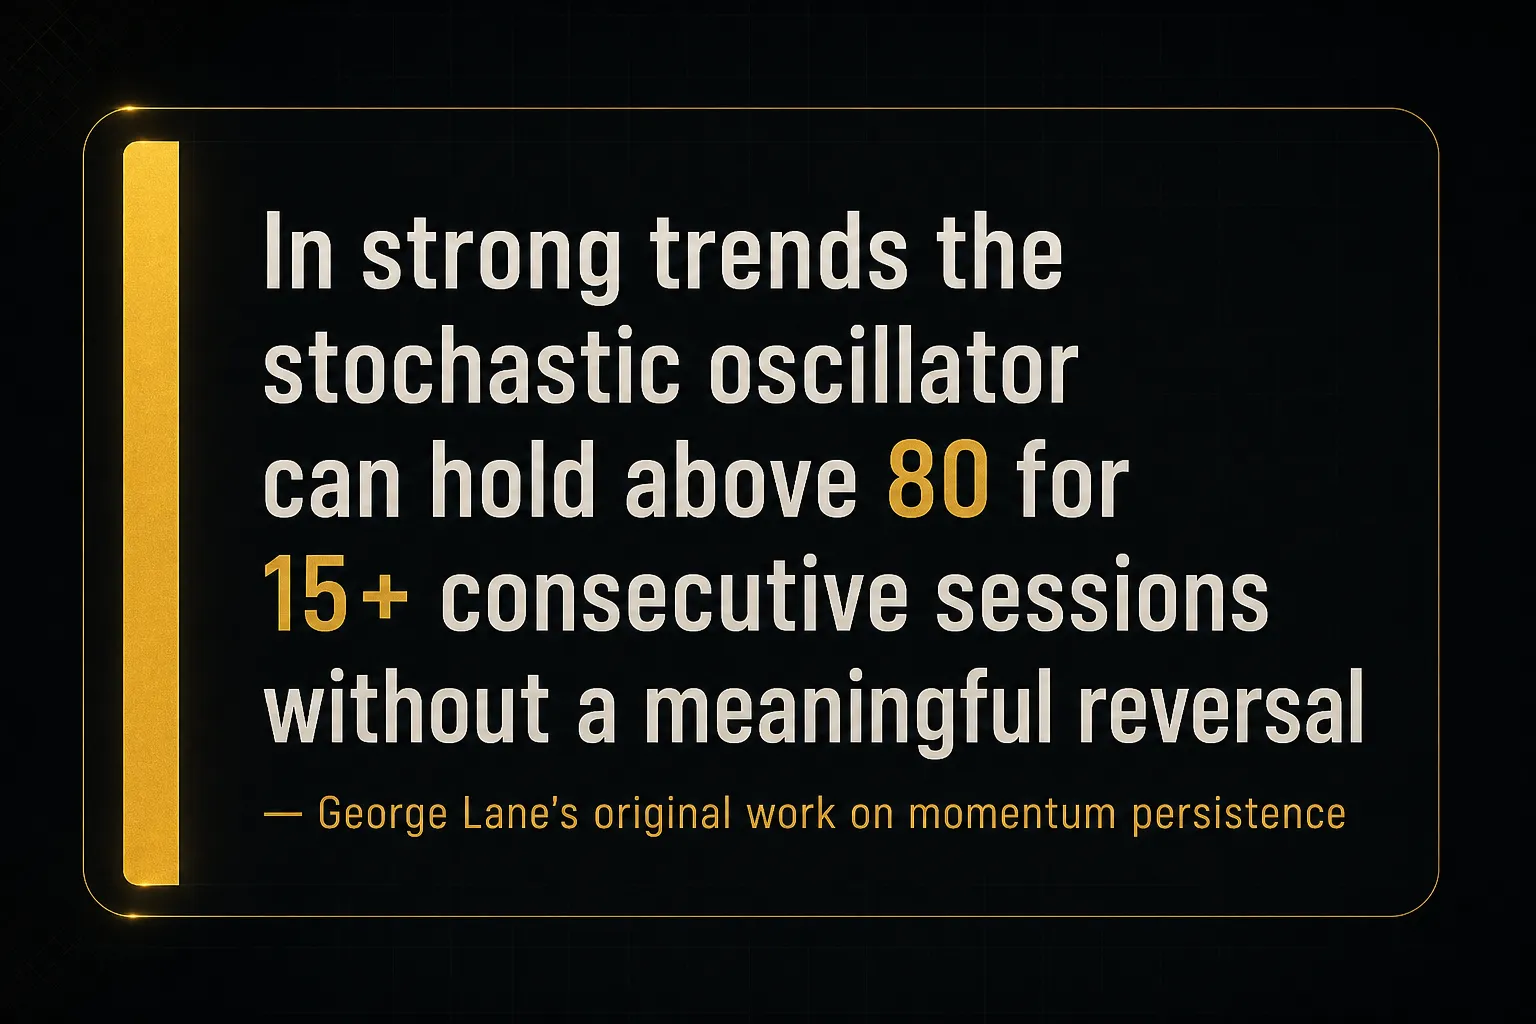
The 2024 gold rally held stochastic above 80 on the daily chart for stretches of fifteen-plus sessions.
Overbought is not a sell signal. It is a description of where the close finished relative to a moving window, and in a trend that window keeps moving up with price.
Two mechanical effects explain the persistence.
First, range compression: when a trend accelerates, each new bar sets a new high, so the numerator and denominator both climb and %K pins near the ceiling.
Second, the rolling window drops old bars, so the range recalculates in the trend’s favour.
The practical fix is a regime switch.
In a trending market, ignore extremes as reversal signals and instead wait for stochastic to dip toward 40 or 20 during a pullback, then turn back up in the direction of the trend.
In a genuine range with defined support and resistance, the 80/20 zones regain their reversal value.
Crossovers Between %K and %D
Crossovers are the most traded and most abused stochastic signal.
On a 5-minute chart, a 14,3,3 stochastic will produce dozens per day.
Almost none of them are worth taking.
A crossover deserves attention when it meets three conditions. The candle must have closed, not be mid-formation, because an intrabar cross can vanish before the bar completes.
Second, the cross should occur near a meaningful location: inside an extreme zone, at a tested support or resistance level, at a prior swing point, or at a moving average that price has respected.
A crossover in the middle of the range at %K 51 tells you nothing.
Third, read it against the prevailing trend.
A bullish cross below 20 in an uptrend is a continuation entry.
The same cross in a confirmed downtrend is a counter-trend bet that needs a much better reason to exist.
Spotting Real Divergence
Bearish divergence occurs when price prints a higher high but stochastic prints a lower high. Bullish divergence is the mirror: a lower low in price with a higher low in the oscillator.
Both signal one thing only.
Momentum behind the move is fading.
That is not the same as a reversal being imminent.
The distinction that separates profitable traders from frustrated ones is between a valid divergence and an early one. A valid divergence forms at a significant structural level, after an extended move, and resolves within a few bars of price action confirmation such as a broken trendline or a failed retest.
An early divergence forms mid-trend, at no particular level, and can persist for ten, twenty, thirty bars while price keeps grinding higher. Traders who short the first bearish divergence in a parabolic move learn this the expensive way.
Treat divergence as a warning to tighten stops, reduce size, or stop adding to a position.
Treat it as an entry only when price itself confirms.
A Rules-Based Trading Framework
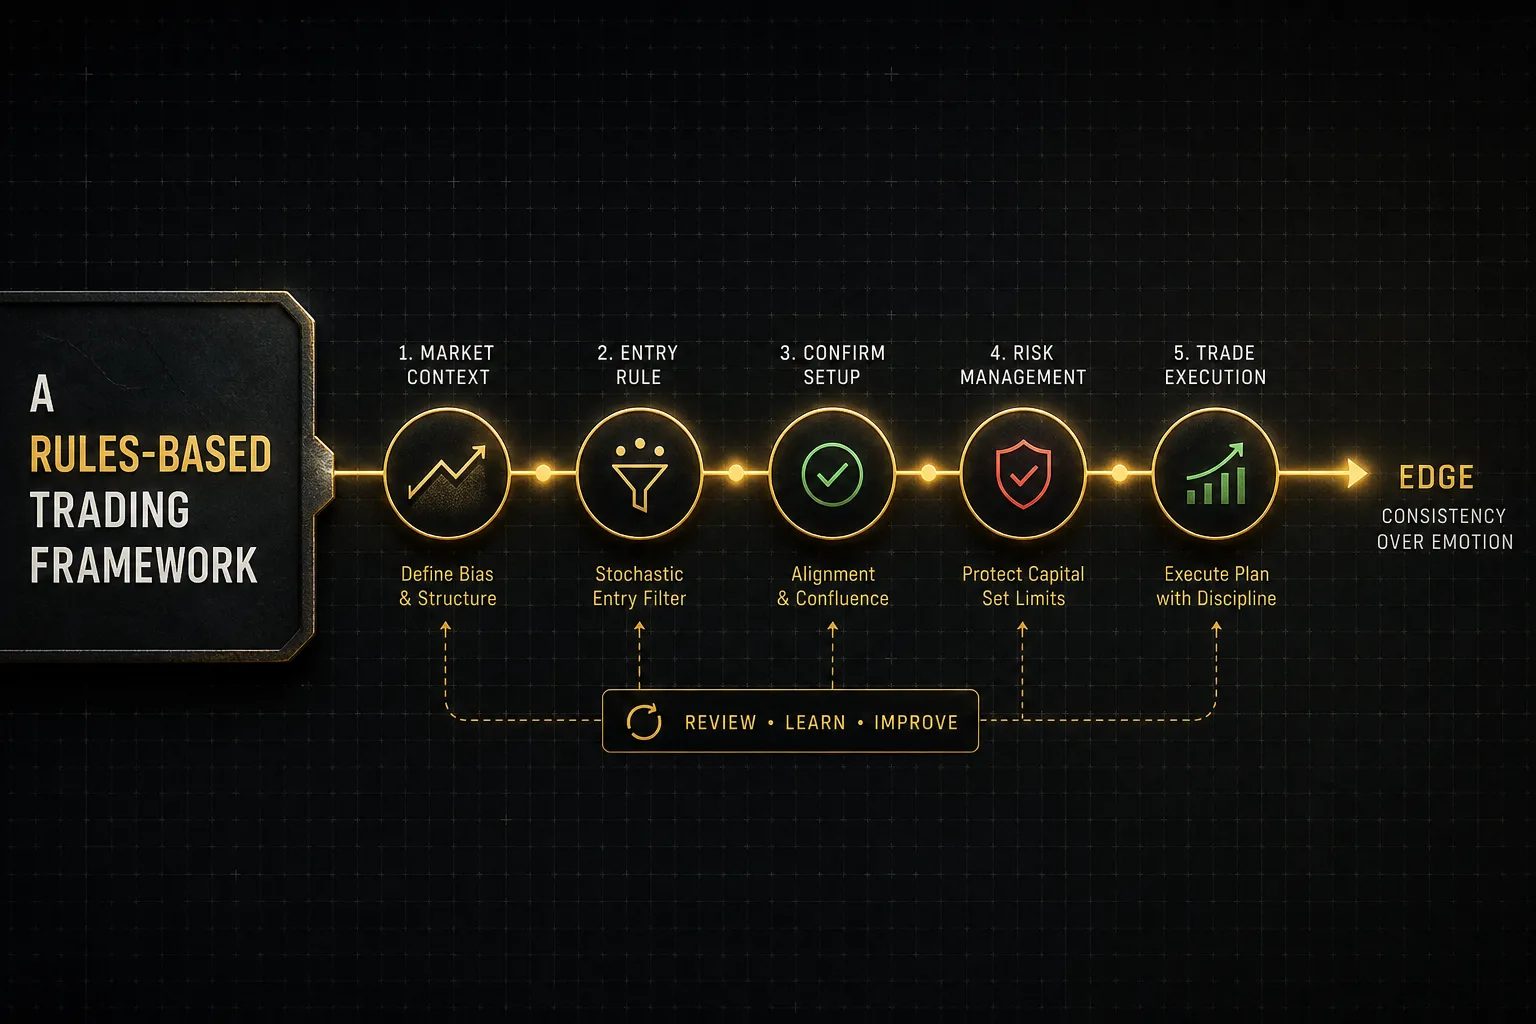
An indicator reading is not a trade.
A trade needs a direction rule, an entry rule, a stop rule, and a size rule.
Stochastic can supply two of those four at most.
Settings by Trading Style
Changing parameters changes one variable: how often the indicator speaks.
A shorter lookback means a narrower range window, so %K swings to extremes more frequently.
More %K smoothing means fewer whipsaws but later signals.
| Preset (%K, smoothing, %D) | Best suited to | Signal frequency | Trade-off |
|---|---|---|---|
| 5, 3, 3 | Scalping and day trading on M5–M15 | Very high (10–25 crossovers per session) | Fast entries, heavy noise, requires a strict trend filter |
| 9, 3, 3 | Intraday forex on M15–H1 | High (5–12 per session) | Balanced for volatile sessions, still needs structure confirmation |
| 14, 3, 3 | General purpose, H1 to Daily | Moderate (2–5 per week on H4) | The default for a reason; reliable but occasionally late |
| 21, 7, 7 | Swing trading on Daily and Weekly | Low (1–3 per month) | Very few false signals, entries lag the turn by several bars |
| 14, 3, 3 on H8 / 5, 3, 3 on M15 | Multi-timeframe workflow | Filtered (roughly 60–70% of raw signals discarded) | Highest quality setups, requires patience and two charts |
Trend, Range, and Timeframe Context
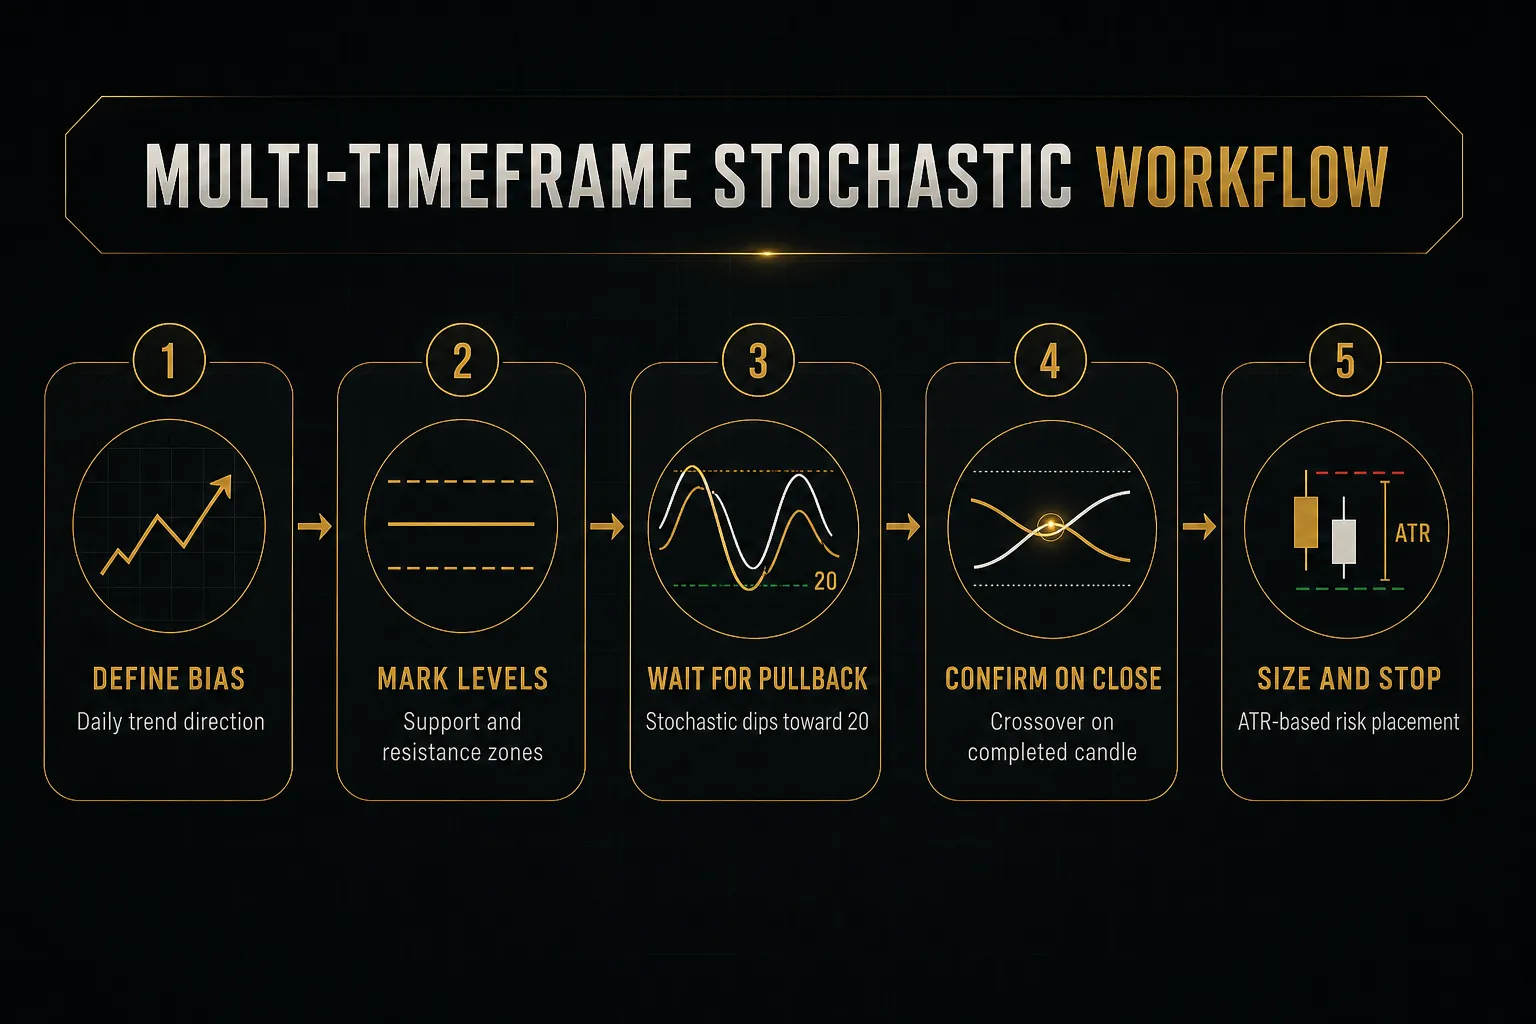
A single-timeframe stochastic system is a coin flip with extra steps. Multi-timeframe analysis is what turns it into something tradeable.
The workflow is straightforward.
Use a higher timeframe, Daily or H8, to establish directional bias: is the market making higher highs and higher lows, or is it oscillating between two horizontal levels?
That answer decides whether you are trading continuation or mean reversion.
Then drop to a lower timeframe, typically one-quarter to one-sixth of the bias timeframe, and use the stochastic to time an entry only in the direction the higher chart permits.
One more warning about indicator stacking.
Pairing RSI with stochastic feels like confirmation, but both are momentum oscillators reading similar information from the same price series.
Two correlated indicators agreeing is not independent evidence.
Better confirmation comes from a different data type entirely: horizontal support and resistance, swing structure, volume, or session behaviour.
Filtering Signals and Managing Risk
Risk rules are what make a mediocre signal profitable and a good signal survivable.
Place stops using average true range rather than a fixed pip count. A common approach is 1.5x to 2x the 14-period ATR beyond the swing point that defines your setup, which scales the stop to current volatility instead of your comfort level.
Set a minimum risk-to-reward ratio before entry.
If the nearest logical target sits closer than 1.5R, skip the trade regardless of how clean the crossover looks.
Position sizing follows from the stop distance: risk a fixed percentage of account equity, commonly 0.5% to 1%, and let the stop width determine lot size.
Define invalidation explicitly.
Example: you enter long on a bullish %K/%D cross below 20 at a daily support level, with the daily trend up.
The setup is invalidated the moment a candle closes below that support level, regardless of what stochastic does afterwards.
The oscillator got you in; price structure decides whether you stay.
This is the logic behind structured systems like PipTrend’s multi-timeframe confirmation table, which separates the trend signal from the entry level.
Direction comes from the higher timeframe, the entry price comes from a defined level, and risk parameters come from volatility.
The oscillator contributes timing, nothing more.
Backtesting Without Fooling Yourself
Most stochastic backtests are fiction.
Not because the data is wrong, but because the tester unconsciously builds hindsight into the rules.
Before you trust any historical result, work through the following:
- Confirm signals on candle close only. An intrabar crossover that appears at 10:14 and disappears by 10:15 is not a signal, but a visual backtest will count it as one. This matters most on intraday forex charts where volatility spikes around session opens and news prints.
- Resist parameter curve-fitting. If 14,3,3 loses money and 13,4,2 wins on the same dataset, you have found a coincidence, not an edge. Test any promising setting on a separate out-of-sample period covering at least 200 trades before believing it.
- Subtract real transaction costs. Spread, commission, and slippage typically consume 0.5 to 2 pips per round turn on major forex pairs, and considerably more on crypto or exotic crosses. A scalping system averaging 4 pips per trade can be net negative after costs while looking excellent on a clean chart.
- Log the losses honestly. Record every signal your rules generated, including the ones you would have talked yourself out of. Selective recording inflates win rates by 10 to 20 percentage points in most manual backtests.
- Define when to switch the indicator off. Skip stochastic entirely during disorderly price action, in the 30 minutes around high-impact news releases, on illiquid instruments with erratic wicks, and in shapeless ranges with no clear support and resistance to trade against.
Frequently Asked Questions
What is the best setting for the stochastic indicator?
There is no universally best setting, but 14,3,3 remains the most reliable default across timeframes and instruments.
Day traders working M5 to M15 charts often move to 5,3,3 or 9,3,3 for faster signals, while swing traders on daily charts favour 21,7,7 to cut noise.
Test any change over at least 200 trades before adopting it, and remember that faster settings buy earlier entries at the cost of more false signals.
What is the 80/20 rule in the stochastic indicator?
The 80/20 rule states that readings above 80 are considered overbought and readings below 20 oversold.
What those numbers actually describe is the close’s position within the recent high-low range, not whether the asset is expensive or cheap.
In a range-bound market these zones carry genuine reversal weight; in a strong trend they simply confirm the trend is healthy.
How do you use stochastic for buy and sell signals?
The standard approach is to buy when %K crosses above %D in oversold territory and sell when %K crosses below %D in overbought territory.
That rule only works with filters attached: the candle must close, the crossover should happen at a support or resistance level, and the direction must agree with the higher timeframe trend.
Without those filters the signal is close to random on intraday charts.
Which is better, RSI or stochastic?
Neither is better; they answer different questions and suit different conditions.
RSI measures the magnitude of recent gains against losses and performs well in trending markets, while stochastic measures closing position within a range and shines in sideways conditions.
Because both are momentum oscillators reading the same price series, using them together rarely provides independent confirmation.
Test them as alternatives, not as a pair.
Can stochastic stay overbought or oversold for a long time?
Yes, and it routinely does during strong trends, sometimes for 15 to 30 consecutive bars.
This happens because each new bar resets the rolling high-low window in the trend’s favour, pinning %K near the extreme.
Fading a persistently overbought reading in a healthy uptrend is one of the most common and expensive mistakes traders make with this oscillator.
What does it mean when %K crosses %D?
A %K crossing above %D means short-term momentum has turned upward relative to its own average; a cross below means the opposite.
It is a momentum shift within the recent range, not a trade instruction.
The signal only becomes actionable when it occurs on a closed candle, near a meaningful price level, and in agreement with your higher timeframe trend filter.
Trading Stochastic With Discipline
The decision logic reduces to one question asked before every signal: is this market trending or ranging?
In a trend, stop fading extremes.
Wait for the oscillator to pull back toward 20 or 40 in an uptrend, or toward 80 or 60 in a downtrend, and enter with the dominant direction.
In a genuine range with clean support and resistance, the 80/20 zones recover their reversal value and mean-reversion entries make sense.
One rule, applied every single time: before acting on any stochastic signal, check the higher timeframe trend and wait for the candle to close. That single discipline removes most of the losing trades that make people abandon this indicator.
An oscillator reading on its own is a guess with a number attached. Combined with a direction rule, a defined entry level, and volatility-based risk, it becomes something you can repeat, measure, and improve.
Risk Disclaimer: Trading involves risk. Past performance doesn't guarantee future results. Only trade with money you can afford to lose. PipTrend is a tool to assist your trading decisions, not financial advice.