RSI settings: a decision framework for every trader
On this page
Why your RSI settings actually matter
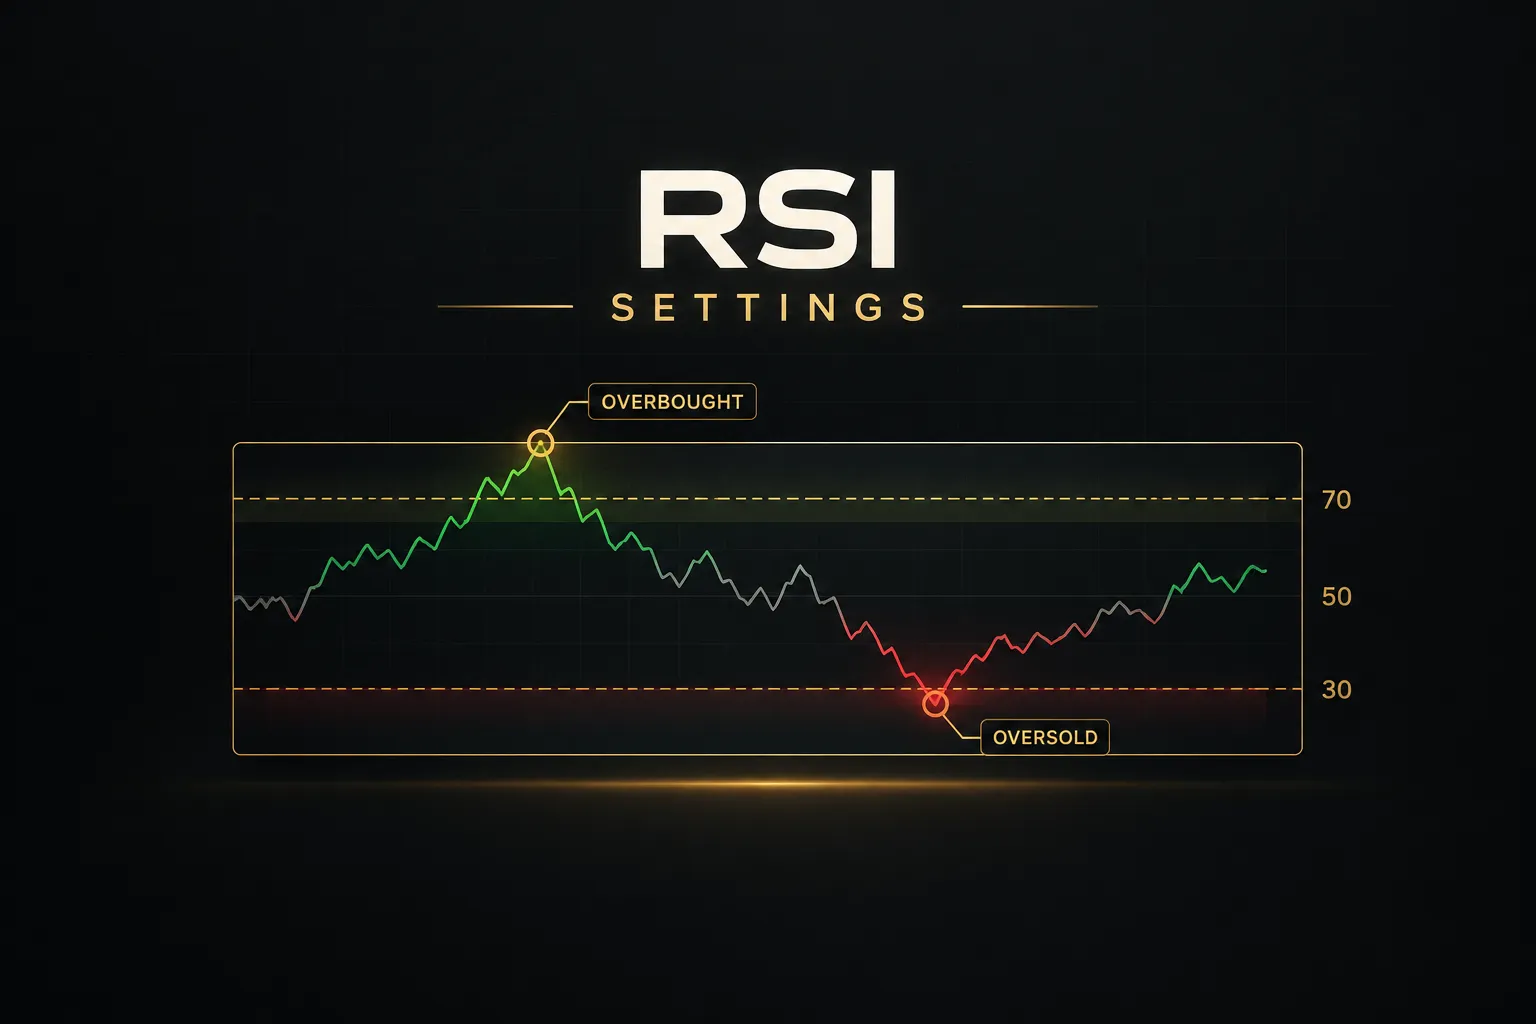
Most traders never change their RSI settings. They load the indicator, accept the 14-period default with 70/30 levels, and assume that number was proven optimal.
It wasn’t.
It was simply the first setting anyone published.
The relative strength index is a momentum oscillator. It measures the speed and size of recent price changes on a scale from 0 to 100.
That makes it a useful gauge of pressure, but it is not a standalone buy/sell system, and treating it like one is how most traders lose money with it.
The “right” RSI setting depends on three things: your strategy, your timeframe, and the current market regime. A setting that works well on a quiet, range-bound forex pair can produce constant false signals on a trending crypto asset.
The indicator didn’t break.
The setting just didn’t match the market.
This guide gives you a decision framework built on four interacting choices:
- Period length, which controls how fast RSI reacts.
- Overbought and oversold thresholds, which define when a reading is extreme enough to matter.
- Price source, which decides what data feeds the calculation.
- Confirmation rules, which determine whether a signal becomes a trade.
Change one and the others shift with it.
That’s why copying someone else’s “best RSI settings” rarely works.
You won’t leave with a magic number.
You’ll leave with a repeatable testing process you can apply to any symbol, on any timeframe, in 2026 or any year after.
RSI settings explained
Here’s a detail that trips up even experienced traders: RSI has no concept of time.
It only counts candles.
Once that clicks, most of the confusion around RSI settings disappears.
The calculation compares average gains to average losses over a set lookback period, then converts that ratio into a 0-100 reading.
Readings near 100 mean buyers have dominated recent candles.
Readings near 0 mean sellers have.
RSI period vs chart timeframe
RSI 14 means 14 candles, not 14 days or 14 hours. On a daily chart, that’s roughly three weeks of trading. On a 1-minute chart, it’s 14 minutes.
Same setting, completely different behavior.
This is why the RSI period (also called RSI length) and the chart timeframe have to be chosen together. A 14-period RSI on a 1-minute chart reacts to every small burst of order flow.
On a daily chart, it reflects weeks of accumulated buying and selling pressure.
The period also controls signal sensitivity, and the trade-off is simple:
- Shorter periods (5, 7, 9) react quickly to price changes. They hit overbought and oversold levels more often, which means earlier signals but far more noise and false crosses.
- Standard period (14) balances responsiveness and stability. It’s the reference point most traders and most published research use.
- Longer periods (21, 25) smooth the line considerably. Signals are rarer and more reliable, but they arrive later, sometimes after a large chunk of the move is gone.
Think of it like a car’s suspension.
A stiff setup (short period) feels every pebble. A soft setup (long period) glides over bumps but can be slow to respond to a real turn in the road.
Price source and smoothing options
Most platforms calculate RSI from the closing price by default. Close is the standard price source because it represents where the market agreed on value at the end of each candle.
Some traders test alternatives.
HL2 (the average of high and low) and HLC3 (the average of high, low, and close) include intrabar range, which can slightly dampen the effect of a candle that closes at an extreme. The difference is usually small, but on volatile intraday charts it can reduce a handful of borderline signals.
Smoothing matters more than most people realize.
Welles Wilder’s original formula uses Wilder smoothing, a type of exponential average where each new value carries a weight of 1/N. Some platforms offer a simple moving average (SMA) version instead, often called Cutler’s RSI.
The SMA version drops old data abruptly once it leaves the window, so it can jump more noticeably. Wilder smoothing fades old data gradually.
If your RSI readings don’t match a colleague’s on the same chart, check the smoothing method before anything else.
What is the default RSI setting
The default RSI setting is a 14-period lookback with overbought at 70 and oversold at 30. Wilder introduced it in his 1978 book New Concepts in Technical Trading Systems, where he worked primarily with daily commodity charts.
It became the industry baseline for practical reasons. It was the first published standard, charting software adopted it, and decades of educational material repeated it.
That consistency is genuinely useful: everyone is looking at the same levels, which can create self-reinforcing reactions around them.
But “default” and “optimal” aren’t the same thing.
Wilder designed the setting for daily charts in 1970s futures markets. Applying it unchanged to a 3-minute chart of a meme coin is… a stretch.
Choosing overbought and oversold levels
Here’s an uncomfortable truth about the classic 30 oversold line: in a strong uptrend, RSI may never touch it for months.
Traders waiting for that buy signal end up watching the entire rally from the sidelines.
Your overbought and oversold levels decide when RSI flags an extreme. Set them wrong for the market regime, and you’ll either drown in signals or never get one.
Why 70/30 is a baseline, not a rule
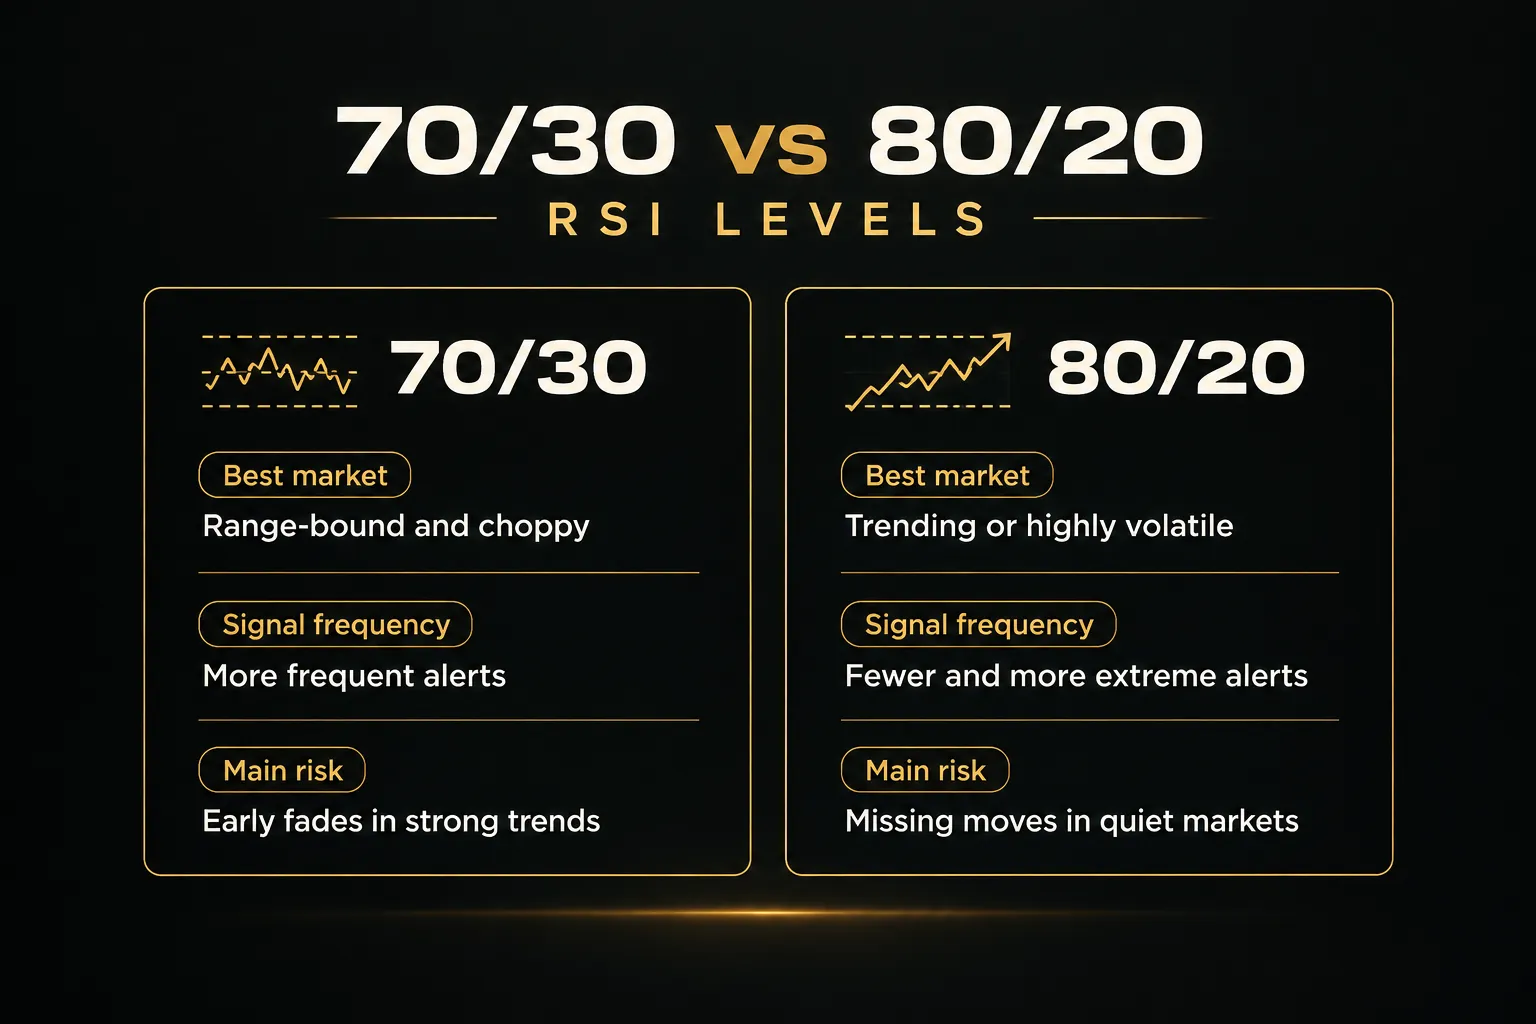
The 70/30 RSI levels work best in range-bound markets, where price oscillates between support and resistance and momentum regularly swings from one extreme to the other. In those conditions, a push above 70 often does precede a pullback.
In highly volatile or trending conditions, 70/30 breaks down fast.
RSI can sit above 70 for weeks during a strong rally. Shorting every overbought reading in that environment is a reliable way to drain an account.
That’s where 80/20 RSI levels come in.
Widening the thresholds means RSI has to reach a more extreme reading before it flags anything, which filters out many of the false signals that occur during normal trending momentum.
Adjusting levels for trends vs ranges
Technical analysts such as Andrew Cardwell and Constance Brown documented what’s known as the RSI range shift.
In strong uptrends, RSI tends to hold between roughly 40 and 90. In strong downtrends, it tends to stay between roughly 10 and 60.
This changes how you read the indicator. During an uptrend, a dip to 40-50 often marks a buying opportunity, not a neutral reading.
The RSI centerline at 50 becomes a useful reference: sustained readings above it suggest bullish control, below it bearish control.
A practical rule for adjusting levels:
- Widen to 80/20 when volatility is elevated or trend strength is high. An ADX trend filter reading above 25 is a common signal that a trend is strong enough to justify wider bands.
- Keep 70/30 in normal, two-sided conditions.
- Narrow to 65/35 in quiet, mean-reverting markets where RSI rarely reaches the classic extremes at all.
One warning applies regardless of the levels you choose.
A threshold cross is a condition to watch, not an entry trigger.
RSI crossing above 70 tells you momentum is stretched.
It doesn’t tell you the move is over.
Wilder himself suggested waiting for a RSI failure swing (RSI pushes past a threshold, pulls back, fails to make a new extreme, then breaks its own prior swing low or high) rather than trading the first cross.
That’s a more patient approach, and patience is exactly what most RSI traders lack.
Matching RSI settings to your trading style
A scalper and a swing trader can both use “RSI” and be looking at completely different tools.
The scalper’s indicator updates on every minute of order flow. The swing trader’s barely moves in a day.
The table below is a starting map, not a final answer. Use it to pick a sensible first setting for your style, then refine it through testing on your specific symbol.
| Trading style | RSI period | Overbought/oversold | Typical timeframe | Main trade-off |
|---|---|---|---|---|
| Scalping | 5-7 | 80/20 | 1-5 minute | Fastest signals, highest noise |
| Day trading | 9-14 | 70/30 (ranges), 80/20 (trends) | 5-15 minute | Balance of speed and reliability |
| Swing trading | 14-21 | 70/30 | H4 to Daily | Fewer signals, focus on sustained moves |
| Position trading | 21-25 | 70/30 or 65/35 | Daily to Weekly | Strong filtering, significant lag |
| Volatile or illiquid assets | 14+ | 80/20 or wider | Any | Wider bands needed to avoid whipsaws |
Day trading and scalping
Day traders commonly pair RSI 9-14 on 5-15 minute charts. RSI 9 catches intraday momentum shifts earlier, while RSI 14 gives fewer but cleaner readings.
Many day traders start at 14 and only drop to 9 if they consistently find signals arriving too late.
Scalpers sometimes test RSI 5-7 on 1-5 minute charts. These settings react almost instantly, which suits trades lasting a few minutes.
The cost is noise.
Expect RSI to whip across 70 and 30 repeatedly, so wider thresholds and strict confirmation rules aren’t optional at this speed.
Swing trading and longer timeframes
Swing traders typically favor RSI 14-21 on H4 or Daily charts. The longer lookback filters out intraday noise and keeps attention on moves that last days or weeks.
On these timeframes, RSI divergence becomes more meaningful. A bullish divergence (price makes a lower low while RSI makes a higher low) on a daily chart reflects weeks of shifting momentum, not a few minutes of random order flow.
Bearish divergence works the same way in reverse.
Many swing traders also use multi-timeframe analysis: a daily RSI above 50 to confirm trend direction, then an H4 RSI pullback toward 40 to time entries.
Forex, crypto, and stocks compared
Asset class changes how RSI behaves, even with identical settings. Each market has its own rhythm of volatility, liquidity, and gaps.
Forex benefits from session-aware settings.
Volatility tends to be lower during the Asian session and rises during the London open and the London/New York overlap. An RSI 14 with 70/30 might work well in Asian hours, while 80/20 handles the faster London and New York moves better.
Crypto trades 24/7, so there are no overnight gaps, but there’s also no natural pause to reset momentum. Sharp moves can keep RSI pinned at extremes for long stretches.
Wider thresholds (80/20) are a common starting point, especially on smaller-cap coins.
Stocks have a different problem: gaps at the open.
A stock that gaps up 6% overnight can jump RSI from 55 to 80 in a single candle, creating an “overbought” reading that reflects news rather than exhausted buying. Many intraday stock traders wait 15-30 minutes after the open before trusting RSI readings.
Across all asset classes, one rule holds.
Low-liquidity and highly volatile symbols need wider overbought and oversold bands, regardless of what the textbook default says.
Reducing false signals and building a real process
Why does RSI fail so often? Because it’s measuring one thing in a market driven by many.
RSI sees momentum and nothing else.
It doesn’t know where support and resistance sits. It doesn’t know the higher-timeframe trend direction. It ignores volume entirely.
So when RSI hits 30 right above a major support level in an uptrend, that’s a high-quality setup. When it hits 30 in the middle of a breakdown with heavy volume, it’s a trap.
RSI reads both the same way.
Most false signals aren’t the indicator’s fault. They come from asking RSI to make decisions it was never designed to make alone.
Confirming RSI with price structure and trend
The fix is to add confirmation layers. Before acting on any RSI signal, require it to align with at least one other piece of evidence.
The first layer is trend direction.
Moving average confirmation is the simplest version: only take oversold signals when price is above the 200-period moving average, and only take overbought signals when it’s below. That one filter alone eliminates many counter-trend losses.
The second layer is location. An oversold reading at a known support zone, a prior swing low, or a key level like VWAP carries far more weight than one floating in empty space.
The third layer is a price action trigger: a bullish engulfing candle, a break of a minor swing high, or a rejection wick that shows buyers actually stepping in.
Divergence deserves a special warning.
Divergence can persist for extended periods, sometimes through several more price swings. A bearish divergence tells you momentum is weakening, not that the trend is ending today.
Treat it as context, never as a standalone trigger.
RSI works best as a filter that confirms what price structure is already suggesting. When RSI is the only reason for a trade, the trade usually doesn’t have a reason.
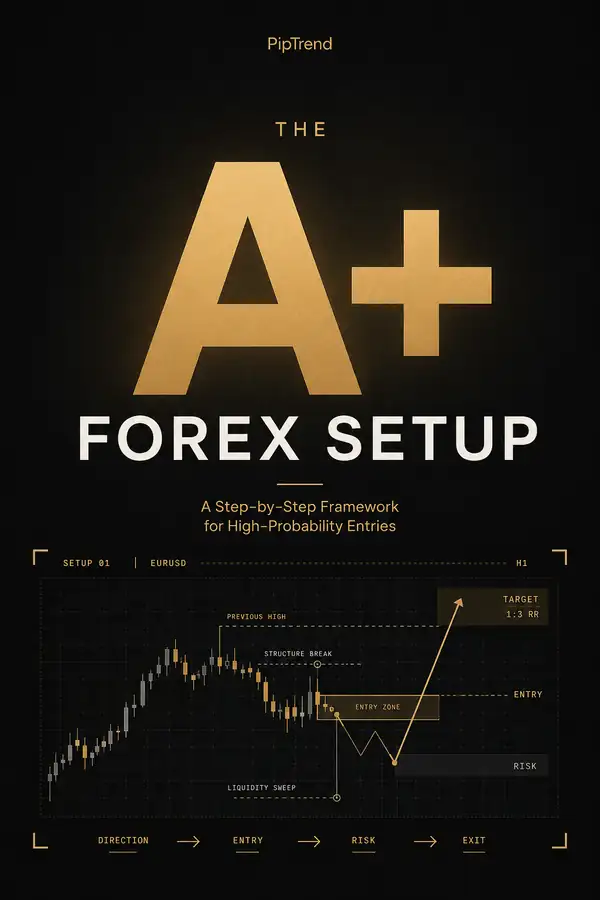
This is the logic behind systems that separate each decision. PipTrend, for example, splits direction (a trend signal), entry (marked price levels such as VWAP or supply and demand zones), and exit (a multi-timeframe table).
In that kind of structure, RSI becomes one filter within a full trade plan rather than the sole decision point.
Backtesting RSI settings the right way
Most traders “test” RSI by scrolling back on a chart until they find a setting that looks good.
That’s not backtesting.
That’s curve-fitting with extra steps.
A proper test controls every variable except the one you’re studying. Fix the symbol, the timeframe, and your entry and exit rules first.
Then run RSI 7, 9, 14, and 21 side by side across the same historical period, ideally at least 100 trades per setting.
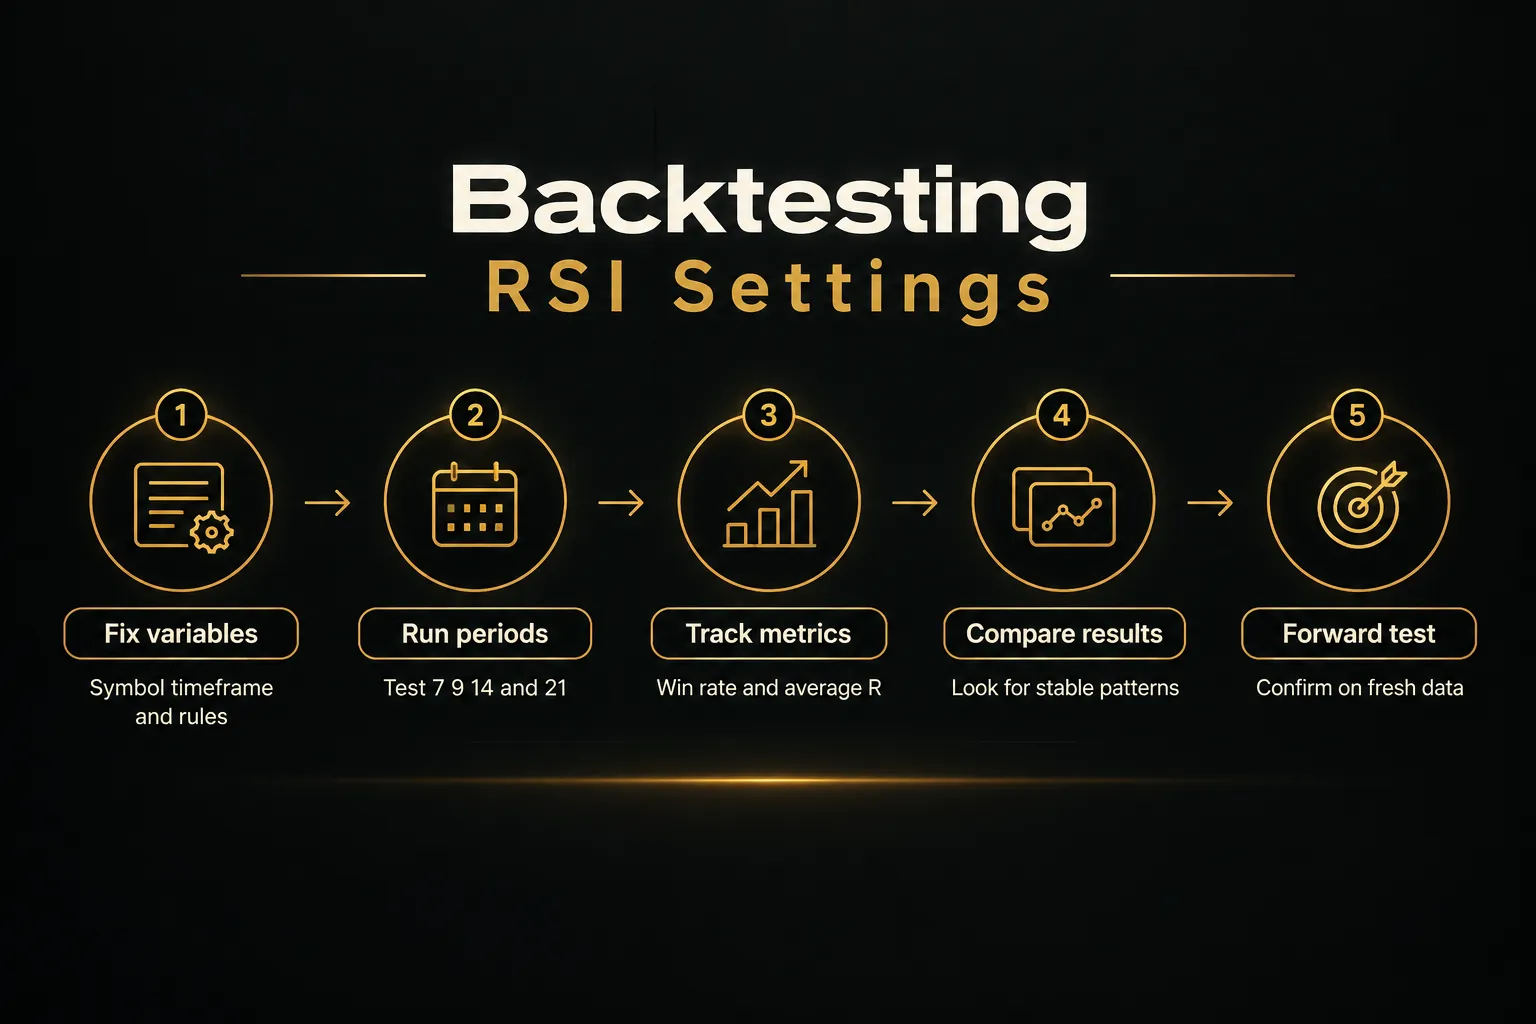
Track three numbers for each setting.
Win rate shows how often signals work. Average R (average profit or loss measured in units of initial risk) shows whether winners pay for losers. Signal frequency shows whether the setting produces enough trades to matter.
Look for stability, not the single best result. If RSI 9 and RSI 14 both perform reasonably and RSI 11 looks spectacular, be suspicious of 11.
One lucky setting surrounded by mediocre neighbors usually means you’ve fit the noise.
Confirm your choice on a separate out-of-sample period before risking real money.
RSI vs Stochastic RSI
Stochastic RSI is not just a faster RSI.
Mechanically, it’s an RSI of RSI: it applies the stochastic formula to RSI values, measuring where current RSI sits relative to its own high-low range over a lookback period.
The result is far more sensitive.
StochRSI regularly swings from 0 to 100 within a handful of candles, even when standard RSI barely moves.
That makes it noisy as a primary signal.
Where StochRSI shines is timing within an already-confirmed trend. Use standard RSI (or another trend tool) to establish direction, then use StochRSI to spot short pullbacks for entries.
Reversing that order, letting StochRSI dictate direction, tends to produce constant whipsaws.
RSI settings FAQ
What is the most accurate RSI setting?
No single RSI setting is universally most accurate. Accuracy depends on matching the period and thresholds to the instrument’s volatility and the current market regime.
RSI 14 with 70/30 is the most widely used baseline, but its reliability comes from confirmation with price structure and trend, not from the numbers themselves.
What is the best RSI setting for a 5-minute chart?
Most traders test RSI 9-14 with 70/30 levels on a 5-minute chart. RSI 9 responds faster to intraday momentum, while RSI 14 filters more noise.
During high-volatility news sessions, widening to 80/20 helps avoid getting faded by sharp, sustained moves.
Is RSI 7 better than RSI 14?
RSI 7 is better for short-term scalps, while RSI 14 is better for standard confirmation. RSI 7 reacts more quickly and catches turns earlier, but it produces noticeably more false crosses.
RSI 14 is steadier and more reliable for traders who hold positions beyond a few minutes.
Neither is objectively superior; they serve different jobs.
What are the best RSI levels for day trading?
Day traders typically use 70/30 in range-bound sessions and 80/20 during strong intraday trends. The right choice shifts throughout the day, so session-based volatility awareness matters.
Forex traders often widen levels at the London and New York opens, and stock traders often wait for opening gap volatility to settle before trusting any reading.
Should I use 80 and 20 or 70 and 30 for RSI?
Use 80/20 in trending or volatile conditions and 70/30 in range-bound markets. The decision should follow the current regime, not personal preference alone.
An ADX reading above 25 or obviously elevated volatility suggests 80/20; quiet, sideways price action suggests 70/30 or even 65/35.
Why does RSI give false signals?
RSI gives false signals mainly because traders ignore trend context and trade every threshold cross. Using a period mismatched to the instrument’s volatility makes it worse.
RSI measures momentum in isolation, so without confirmation from trend direction, support and resistance, or price action, many of its extreme readings simply reflect strong trends continuing.
Pick a setting, then test it on your chart
Start simple.
For most traders, the right first move is RSI 14 with 70/30 levels on your primary timeframe. Don’t touch it until you’ve watched it produce false signals on your specific symbol.
Then adjust with a reason.
The decision rule fits in one sentence.
Shorter periods and wider levels for volatile or trending conditions; the standard period and standard levels for range-bound ones.
Everything else is refinement through testing.
And that’s the real shift.
RSI settings are a tuning dial, not a strategy.
Changing from 14 to 9, or from 70/30 to 80/20, can sharpen your signals, but it can’t fix a trade plan with no structure behind it.
The traders who get lasting results pair sensible settings with three things: a clear read on trend direction, entries at meaningful price levels, and disciplined risk management on every trade.
Get those right, and RSI becomes what it was always meant to be.
A reliable second opinion.
Sources
Risk Disclaimer: Trading involves risk. Past performance doesn't guarantee future results. Only trade with money you can afford to lose. PipTrend is a tool to assist your trading decisions, not financial advice.