Supply and Demand Zones Trading: A Beginner's Framework
On this page
Why Most Zone-Drawing Advice Fails You
Give two traders the same EUR/USD chart and ask them to mark a demand zone. You will often get two boxes that barely overlap. One trader includes the wicks, the other uses candle bodies, and a third person would probably pick a different base entirely.
That inconsistency is the real problem with most supply and demand zones trading advice. Guides show beautiful hand-picked examples where price bounced perfectly, but they skip the boring part: precise, repeatable rules for where a zone starts and ends.
Without those rules, you can’t test anything.
And a method you can’t test is just a story.
This guide takes an evidence-aware approach. It separates what price action on your chart can actually show (a sharp move left a specific area, and price reacted when it returned) from what is inferred about banks and funds placing orders.
Both matter.
But only one is observable on a retail platform.
A zone is only useful if you and a stranger, following the same written rules, would draw the same box.
By the end, you’ll have a repeatable process for four jobs:
Identifying zones with objective boundary rules.
Validating them through freshness, departure strength, and approach quality.
Entering with concrete confirmation and defined risk.
And invalidating them quickly when the market proves you wrong.
No certainty promised.
Just a framework you can check, measure, and improve in 2026 and beyond.
What Supply and Demand Zones Really Are
Price doesn’t move evenly. It drifts, pauses, and then occasionally explodes in one direction as if someone flipped a switch.
Supply and demand zones are built entirely around those explosions.
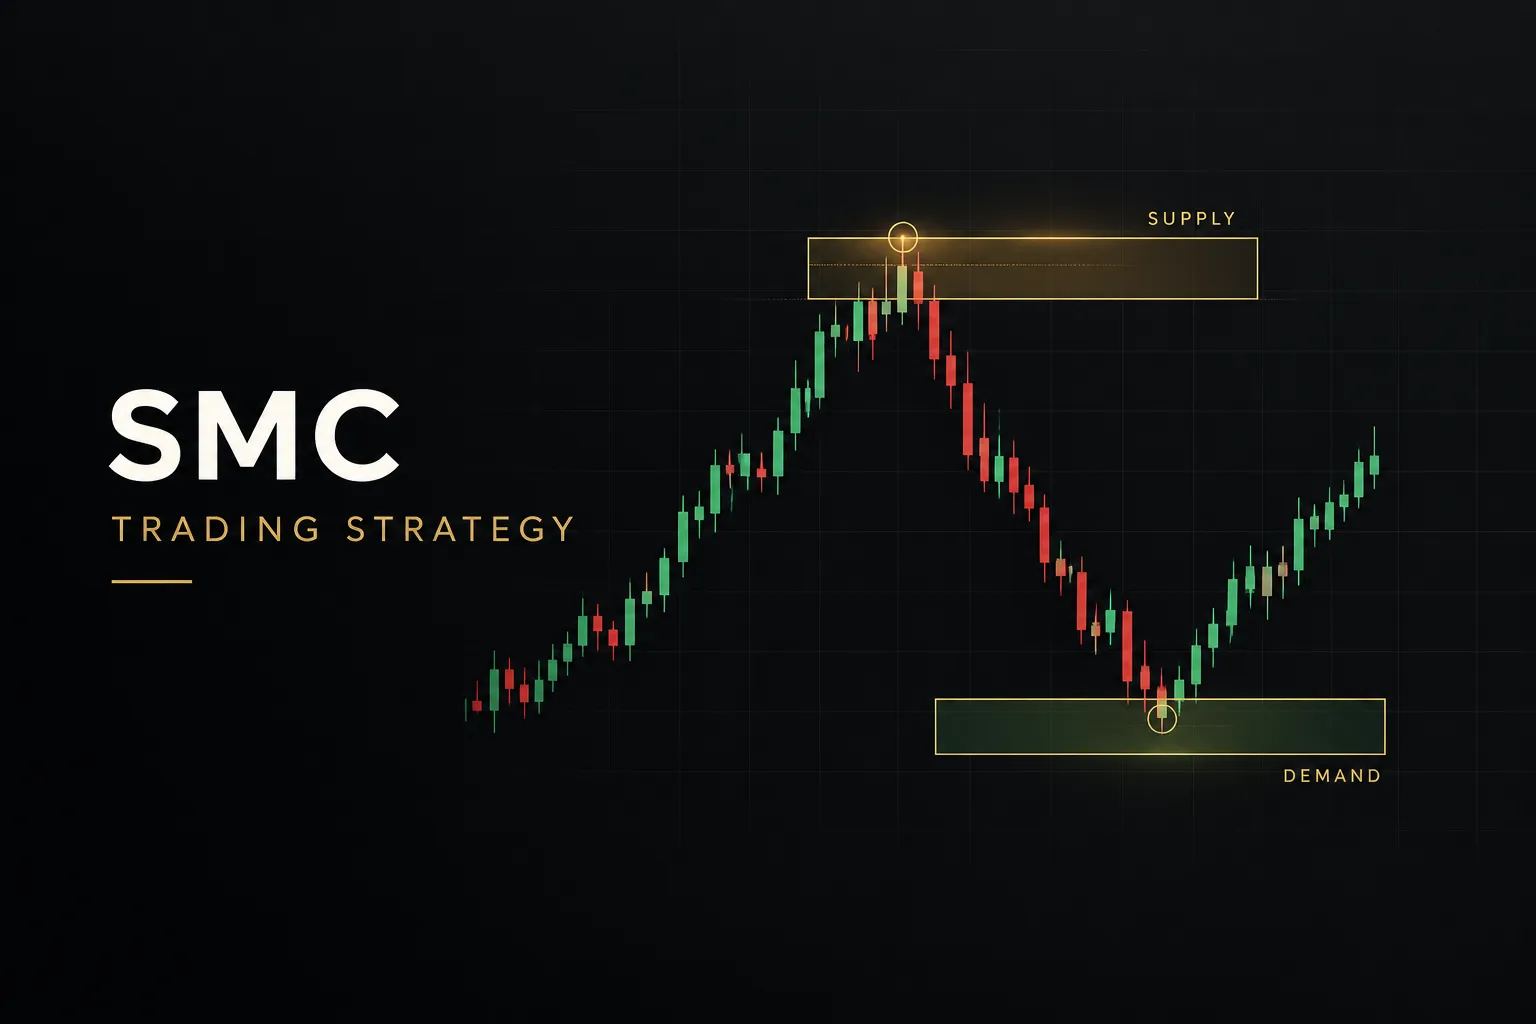
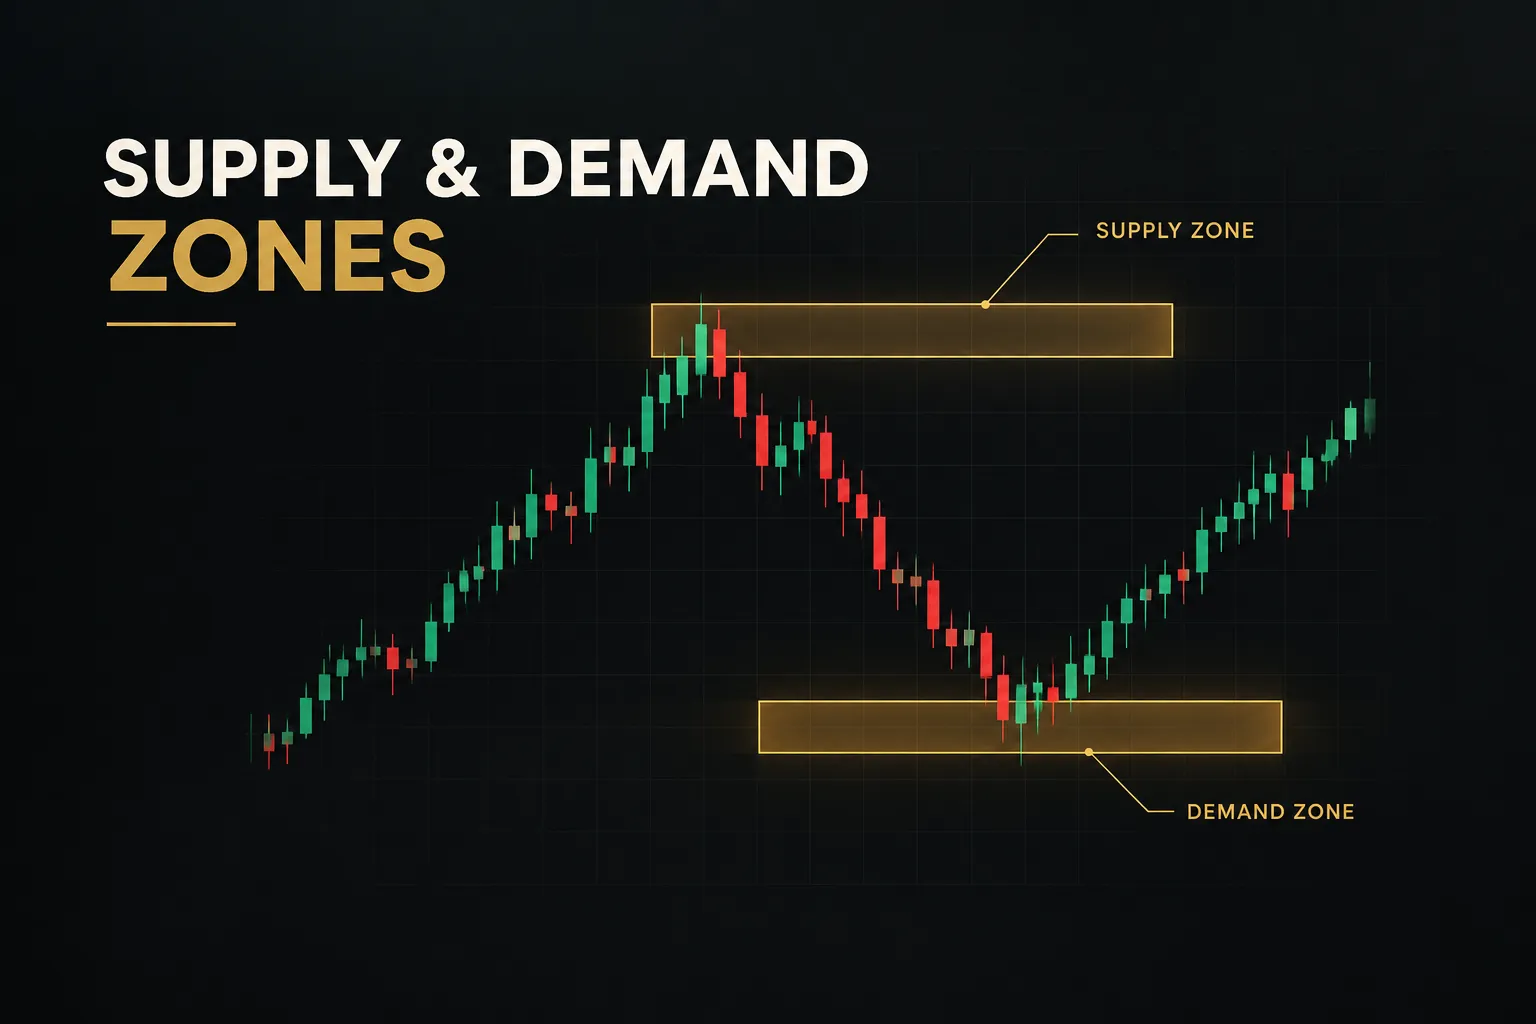
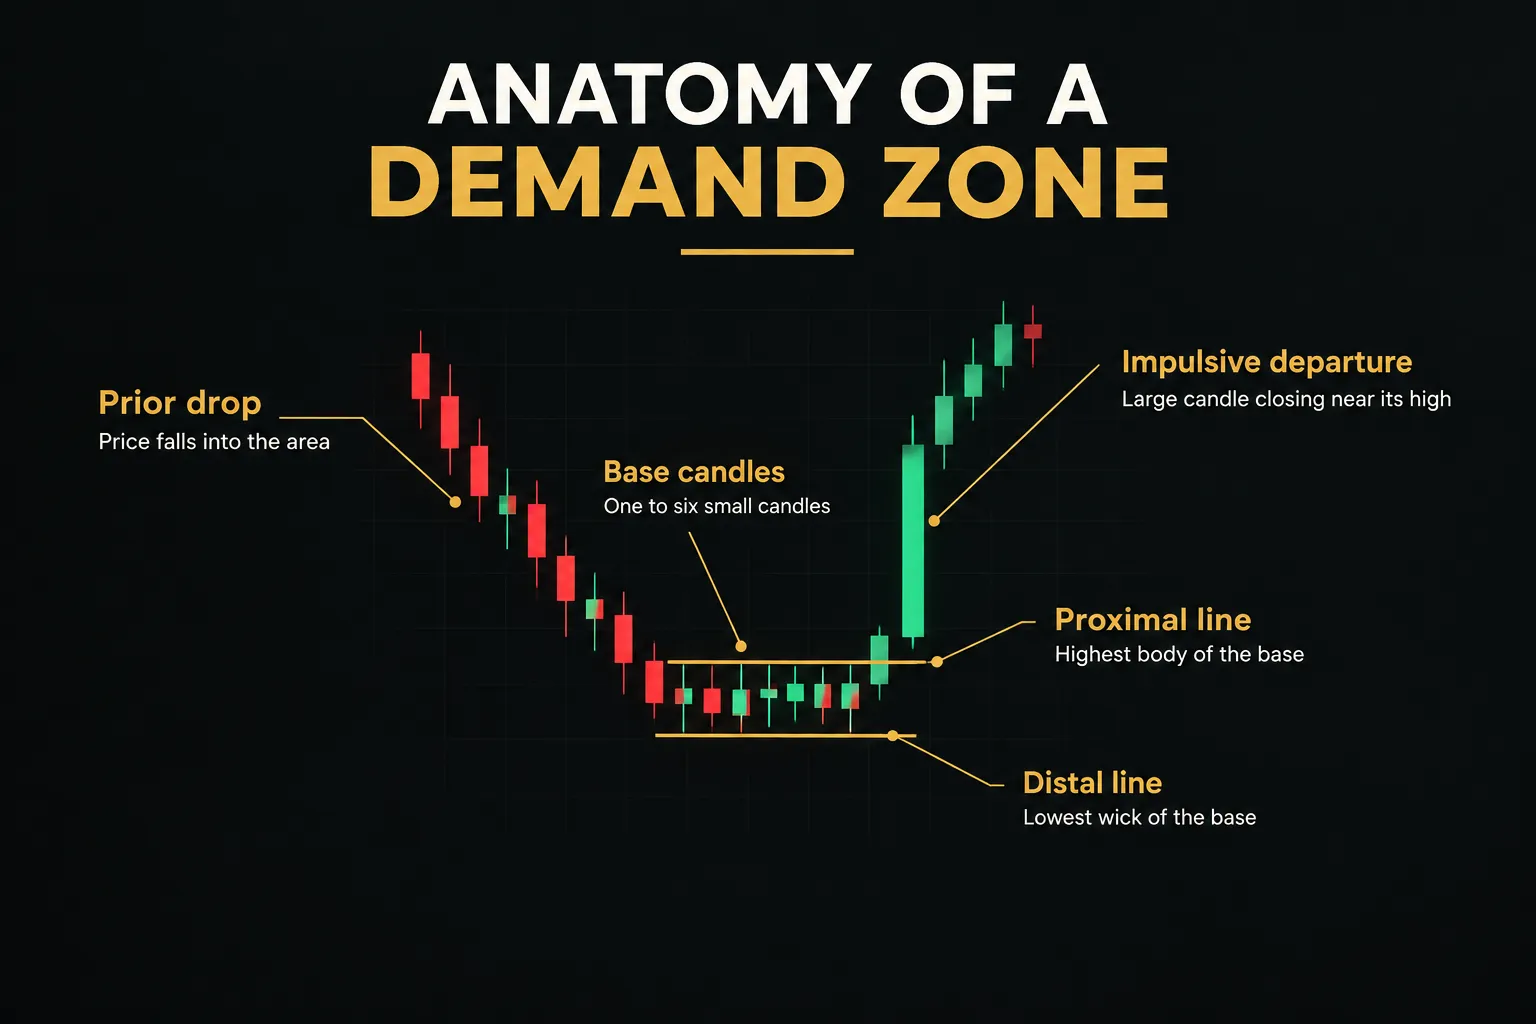
A supply or demand zone is a price area where a sharp, imbalanced move originated. It usually has two parts: a base (a short cluster of small, overlapping candles where price paused) and an impulsive departure (one or more large candles that leave the base aggressively). A demand zone sits below current price where buying overwhelmed selling. A supply zone sits above current price where selling overwhelmed buying.
Traders call the upward version bullish displacement and the downward version bearish displacement.
The core idea is simple.
If price left an area in a hurry, something about that area mattered, and it may matter again when price returns.
Zones vs Support and Resistance
Zones and classic support and resistance look similar at a glance.
They aren’t the same tool.
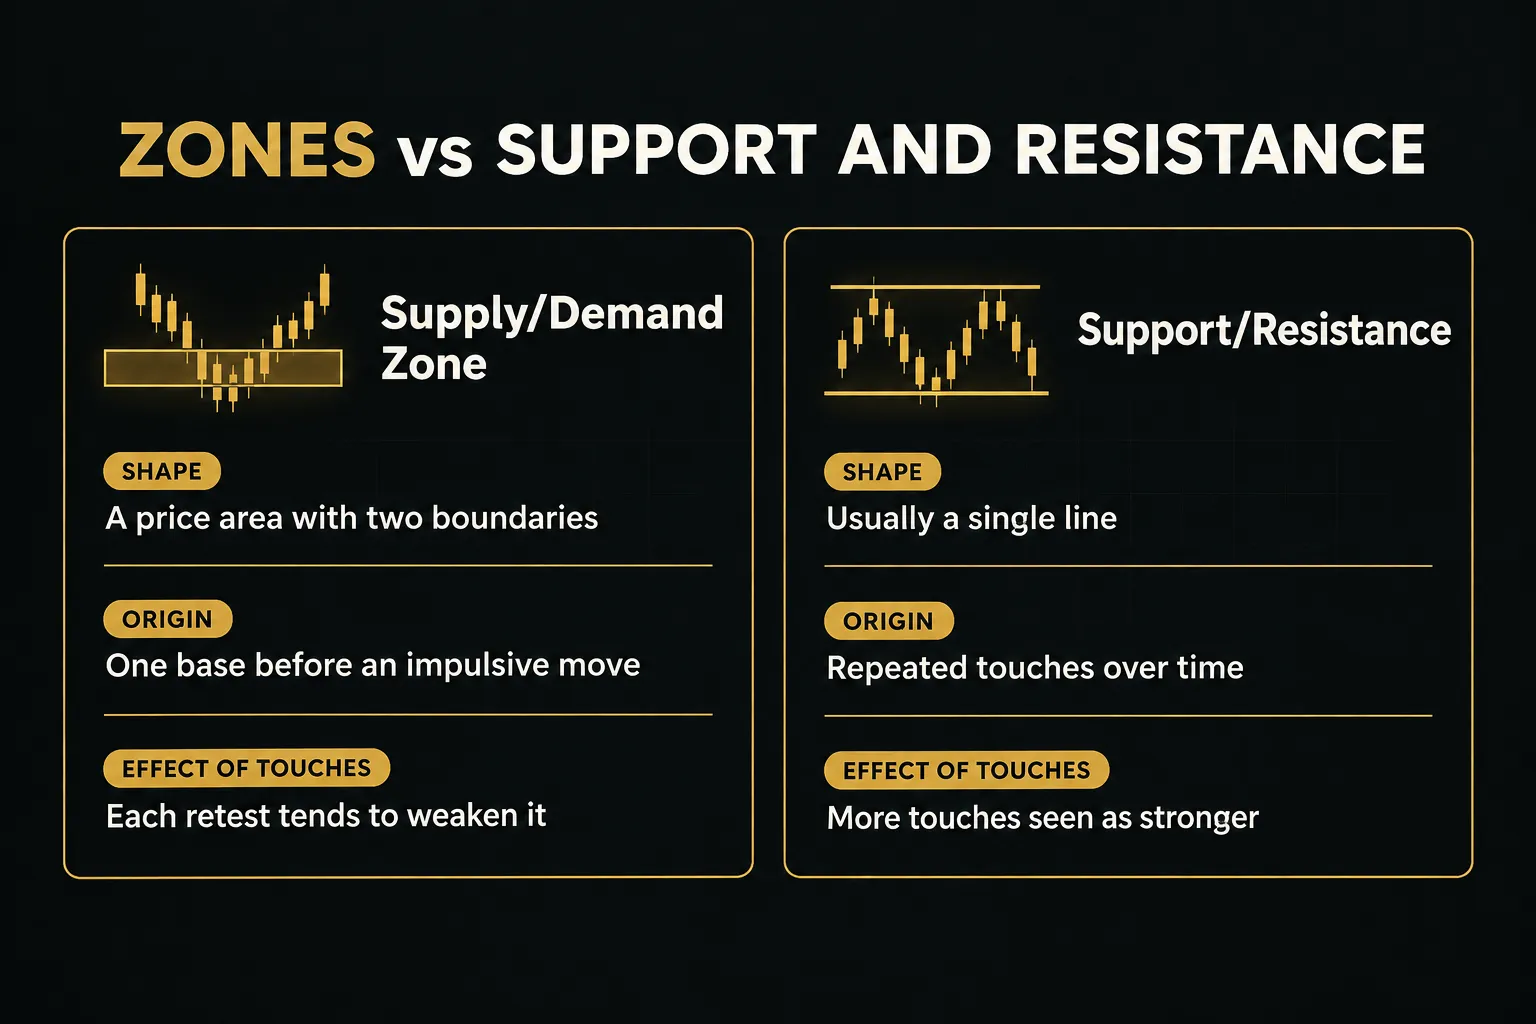
Support and resistance is usually drawn as a single line where price has bounced several times. The more touches, the stronger the level is considered.
It’s a record of repeated historical agreement on price.
A zone is an area tied to one specific originating candle sequence. It doesn’t need multiple touches to exist. In fact, as you’ll see later, repeated touches tend to weaken a zone rather than strengthen it.
That single difference flips how you judge quality.
The Institutional Order Hypothesis (and Its Limits)
Most zone-trading material explains the concept like this: large institutions couldn’t fill their entire order at once, so unfilled orders remain parked at the zone. When price returns, those orders get triggered, and price bounces.
This is the order flow imbalance explanation.
It’s a plausible story.
It’s also a hypothesis.
Retail traders can’t see the full order book, iceberg orders, or dark pool prints on a standard chart. In spot forex, there isn’t even a centralized exchange to look at.
So when someone says “banks left orders here,” they’re inferring intent from candle shapes, not observing it.
And price can respect a zone for reasons that have nothing to do with resting institutional orders:
Algorithmic liquidity provision. Market-making algorithms often quote tighter or pull back around areas of prior volatility, which can produce reactions on their own.
Psychological round numbers. Levels like 1.1000 on EUR/USD or $60,000 on Bitcoin attract clustered stops and limit orders from retail and professional traders alike.
Momentum continuation. Sometimes price simply pulls back and resumes a trend, and the zone happens to be where the pullback ended.
Treat the institutional story as a useful mental model, not a fact. Your rules should work whether or not the story is true.
That framing keeps you honest.
If a zone fails, you don’t argue with the market about what the banks “should” have done. You follow your invalidation rules and move on.
Finding and Drawing Zones That Hold Up
Here’s where most traders go wrong: they spot a zone after the bounce already happened.
Hindsight makes every zone look obvious.
The goal of this section is to give you rules that work before the outcome is known.
Four Zone Patterns to Know
Every zone forms from one of four sequences. Each describes what price did before the base, what it did in the base, and where it went after.
Rally-base-rally (RBR). Price rises, pauses in a base, then rallies again. This creates a demand zone and suggests trend continuation to the upside.
Drop-base-rally (DBR). Price falls, pauses, then reverses sharply higher. This is a demand zone signaling a potential reversal from bearish to bullish.
Rally-base-drop (RBD). Price rises, pauses, then collapses.
This produces a supply zone and hints at a bullish-to-bearish reversal.
Drop-base-drop (DBD). Price falls, pauses, then falls again. A supply zone, implying bearish continuation.
The base itself matters.
Most practitioners look for one to six base candles, with one to three considered cleanest. A longer base means price spent more time trading at that level, which suggests the imbalance was absorbed gradually rather than left behind.
Short base, violent exit: that’s the profile you want.
Impulse Move or Just Noise?
Not every big candle is displacement.
A 60-pip candle on GBP/JPY during a busy London open might be completely normal. So how do you tell the difference?
Use a three-part test.
First, compare range and close to the recent average. A genuine impulse candle typically has a range of at least 1.5 to 2 times the recent average (a 14- or 20-period ATR works well as the benchmark). It should also close near its extreme, roughly in the top 25% of its range for a bullish move or the bottom 25% for a bearish one.
A big candle that closes mid-range is indecision, not conviction.
Second, check the context. Was the move driven by a scheduled release like Non-Farm Payrolls, a CPI print, or a central bank decision?
News spikes can create huge candles that reflect a one-off repricing rather than a reusable zone. The same caution applies to thin liquidity periods like the late US session or holiday trading, where modest orders can move price disproportionately.
Third, look for a stop hunt or fakeout wick. If the base includes a long wick poking below a prior low before the rally, that’s a possible liquidity sweep.
It can actually strengthen a demand zone (stops were cleared first), but it also changes where your boundaries go, since that wick becomes part of the zone.
A departure that passes all three checks is worth marking.
One that fails any of them deserves a skeptical second look.
Setting Boundaries and Choosing a Timeframe
This is the part most guides skip.
Every zone needs two lines.
The proximal line is the boundary nearest to current price. The distal line is the boundary furthest away. For a demand zone, the proximal line sits at the top of the base and the distal line at the bottom.
For supply, it’s reversed.
Here’s a repeatable rule set:
Proximal line: the highest candle body in the base (for demand) or the lowest candle body (for supply). You can use wicks instead, but pick one convention and write it down.
Mixing them is how two traders end up with different boxes.
Distal line: the furthest wick of the base, including any wick from the first departure candle if it extends beyond the base. This captures the full extent of where price actually traded before leaving.
Timeframe choice shapes everything.
Higher timeframes like the H4 and Daily produce fewer zones, but each represents more traded volume and tends to be more reliable. Lower timeframes like the M15 or M5 give you many more zones, along with far more noise and false signals.
The practical answer is multi-timeframe analysis. Use the Daily or H4 to define the dominant zones and overall market structure. Then drop to a lower timeframe only for refining entries.
A pristine M15 demand zone sitting directly under a fresh Daily supply zone is not a high-priority trade.
The bigger picture wins ties.
Judging Zone Quality Before You Trust It
Drawing a zone correctly is step one. Deciding whether it deserves your money is step two, and it’s where discipline separates consistent traders from hopeful ones.
Freshness and Liquidity Consumption
Counterintuitive but important: the first return to a zone is usually the best one.
Zone freshness refers to whether price has come back to the zone since it formed. An untested zone is “fresh.”
If you accept the imbalance hypothesis, the logic is straightforward. Each time price revisits the zone, it likely absorbs some of the resting liquidity that caused the original reaction.
Traders call this zone mitigation.
Think of it like a trampoline with a limited number of springs.
The first bounce is strong. Every landing after that snaps a few more springs, until eventually you fall straight through.
As a rough guideline, most practitioners treat a zone as questionable after two full tests without a decisive move away.
But treat that as a starting hypothesis, not a law.
Some instruments, like major index futures during high-volume sessions, may behave differently from thinly traded exotic currency pairs. The only way to know is to backtest freshness on the specific market and timeframe you trade.
Approach Quality Before the Retest
How price arrives at a zone tells you almost as much as the zone itself. There are three common approach types.
Slow, grinding approach through consolidation. Price drifts toward the zone in small overlapping candles. This often means the opposing side is quietly absorbing orders on the way in, which can erode the zone before price even touches it.
These setups tend to have lower odds.
Aggressive, high-momentum approach. Price slams into the zone with large candles. The reaction can be sharp if the zone holds, but momentum this strong can also blow straight through.
Risk is higher, and waiting for confirmation matters more.
Liquidity sweep approach. Price pushes beyond a prior swing high or low, triggering stops, then snaps back into the zone. Many traders consider this the highest-quality approach, because the sweep clears out weak positioning and supplies fresh orders for the reversal.
It’s also where many of the cleanest confirmation entries form.
Zones, Order Blocks, FVGs, and Nested Timeframes
Zone trading overlaps with concepts popularized by Smart Money Concepts (SMC) and ICT-style education. The terminology gets tangled fast, so here are clean definitions.
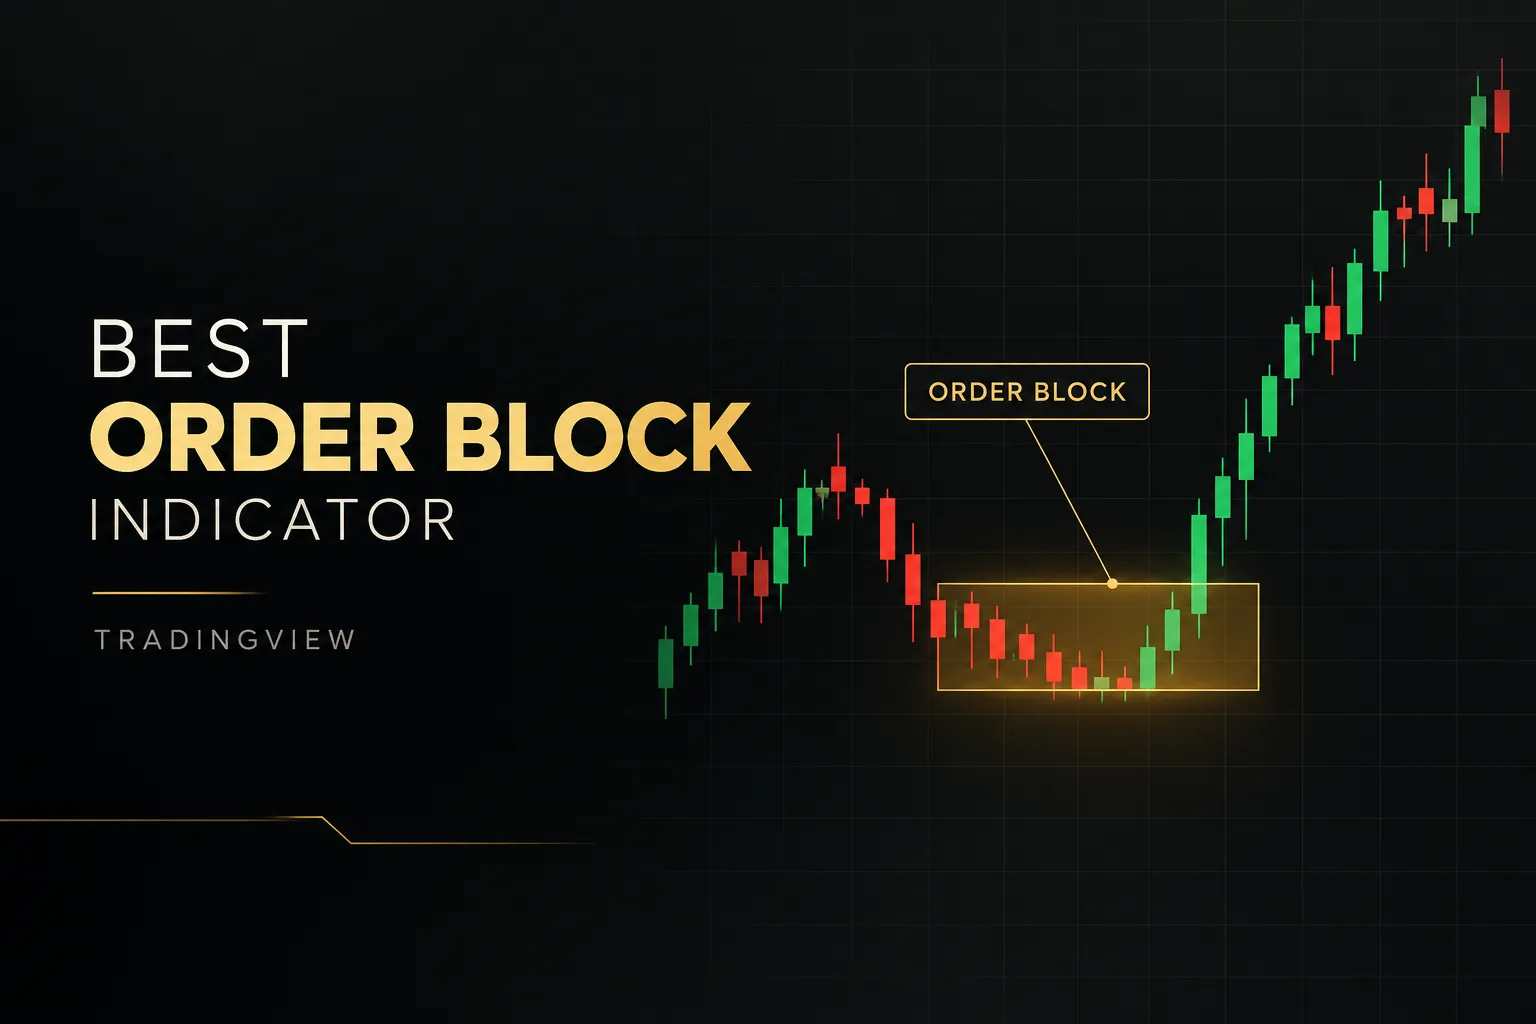
Order blocks are typically defined as the last opposing candle before an impulsive move, such as the final bearish candle before a strong rally. They’re narrower than a full zone and are usually tied to a break of structure, meaning the impulse broke a prior swing high or low.
A fair value gap (FVG) is a three-candle pattern where the wicks of the first and third candles don’t overlap, leaving a price range that traded only once and quickly. It marks an imbalance inside the departure leg rather than the base.
A liquidity sweep is the stop-hunting move beyond a level described above.
It’s an event, not an area.
These pieces often stack.
A demand zone might contain an order block, with an FVG sitting just above it in the departure leg. When they align, many traders treat it as extra confluence.
Nested timeframes are where conflicts appear. A lower-timeframe demand zone can sit entirely inside a higher-timeframe supply zone.
Which one wins? Usually the higher timeframe, but not always immediately.
The lower-timeframe zone might produce a short-lived bounce before the larger supply takes over. If you trade it, treat it as a quick, reduced-size scalp with close targets, or skip it and wait for the higher-timeframe picture to resolve.
From Zone to Trade: Entry, Risk, and Validation
A zone is a location, not a trigger.
Plenty of traders lose money on perfectly drawn zones because they buy the instant price touches the proximal line. The process below turns a marked area into a defined, testable trade.
What Real Confirmation Looks Like
“Wait for confirmation” is the most repeated and least defined advice in trading. Here’s what it should mean in concrete, checkable terms.
- Look for a rejection candle closing back inside the zone. For a demand zone, that’s a candle that wicks into or through the zone but closes back above the proximal line or well inside the box. A close matters far more than an intrabar wick.
- Wait for a lower-timeframe break of structure. Drop one or two timeframes and watch for price to break the most recent swing high (for demand) or swing low (for supply). This shift, often called a change of character, shows that short-term order flow has turned in your direction.
- Check for a momentum shift on an oscillator. A bullish divergence on RSI, or RSI crossing back above 30 while inside a demand zone, adds evidence that selling pressure is fading. It’s supporting evidence, not a signal on its own.
- Confirm with volume expansion where available. On futures, stocks, and centralized crypto venues, a spike in volume on the rejection candle supports the idea of real participation. Volume confirmation is weaker in spot forex, where platforms show tick volume rather than true traded volume.
- Verify multi-timeframe alignment. The trade should agree with the higher-timeframe structure, or at least not fight a fresh higher-timeframe zone. Tools like PipTrend’s multi-timeframe table can help here by showing trend direction across several timeframes in one view, and its separation of signals from suggested entry levels encourages you to check confluence objectively. Treat any such tool as one input in a checklist, never as a standalone buy or sell trigger.
You don’t need all five every time.
Many traders require at least two or three before entering. Write down your minimum, and stick to it.
Stops, Targets, and Position Sizing
Zone width drives everything downstream.
A wide zone means a wide stop, which means a smaller position, which may kill the reward side of the trade entirely.
- Place the stop beyond the distal line. The distal boundary is where the zone idea fails, so your stop-loss placement belongs just past it, not inside the zone.
- Add a volatility-based buffer. Use volatility and ATR to size the buffer, commonly 0.25 to 0.5 times the current 14-period ATR. This keeps normal noise and spread widening from tagging your stop on a meaningless wick.
- Measure stop distance and size the position from it. Position sizing should come from a fixed risk per trade, often 0.5% to 1% of account equity. If you risk $100 and your stop is 50 pips on a standard lot equivalent of $1 per pip, your size is 2 mini lots, not whatever feels right.
- Set a target at the next opposing zone or structure level. For a long from demand, the logical target is the nearest fresh supply zone or prior swing high.
- Check the risk-to-reward ratio before entering. If the distance to target isn’t at least twice the stop distance (a risk-to-reward ratio of 1:2 or better), skip the trade. A beautiful zone with a 1:0.8 payoff is a bad trade.
- Apply a clear invalidation checklist. Exit or stand aside if you see any of these: a decisive candle close beyond the distal line; sustained price acceptance outside the zone (multiple candles trading and closing there, not a brief wick); or a shift in market structure, such as a lower high forming after an uptrend or a higher low after a downtrend. Trade invalidation should be automatic, not a debate.
If the zone is so wide that a proper stop wrecks your risk-to-reward, the zone is telling you something. Refine it on a lower timeframe or pass.
Backtesting Without Hindsight Bias
Scrolling back through a chart and “finding” winning zones proves almost nothing.
Your brain already knows which zones held.
Backtesting only works if you remove that advantage.
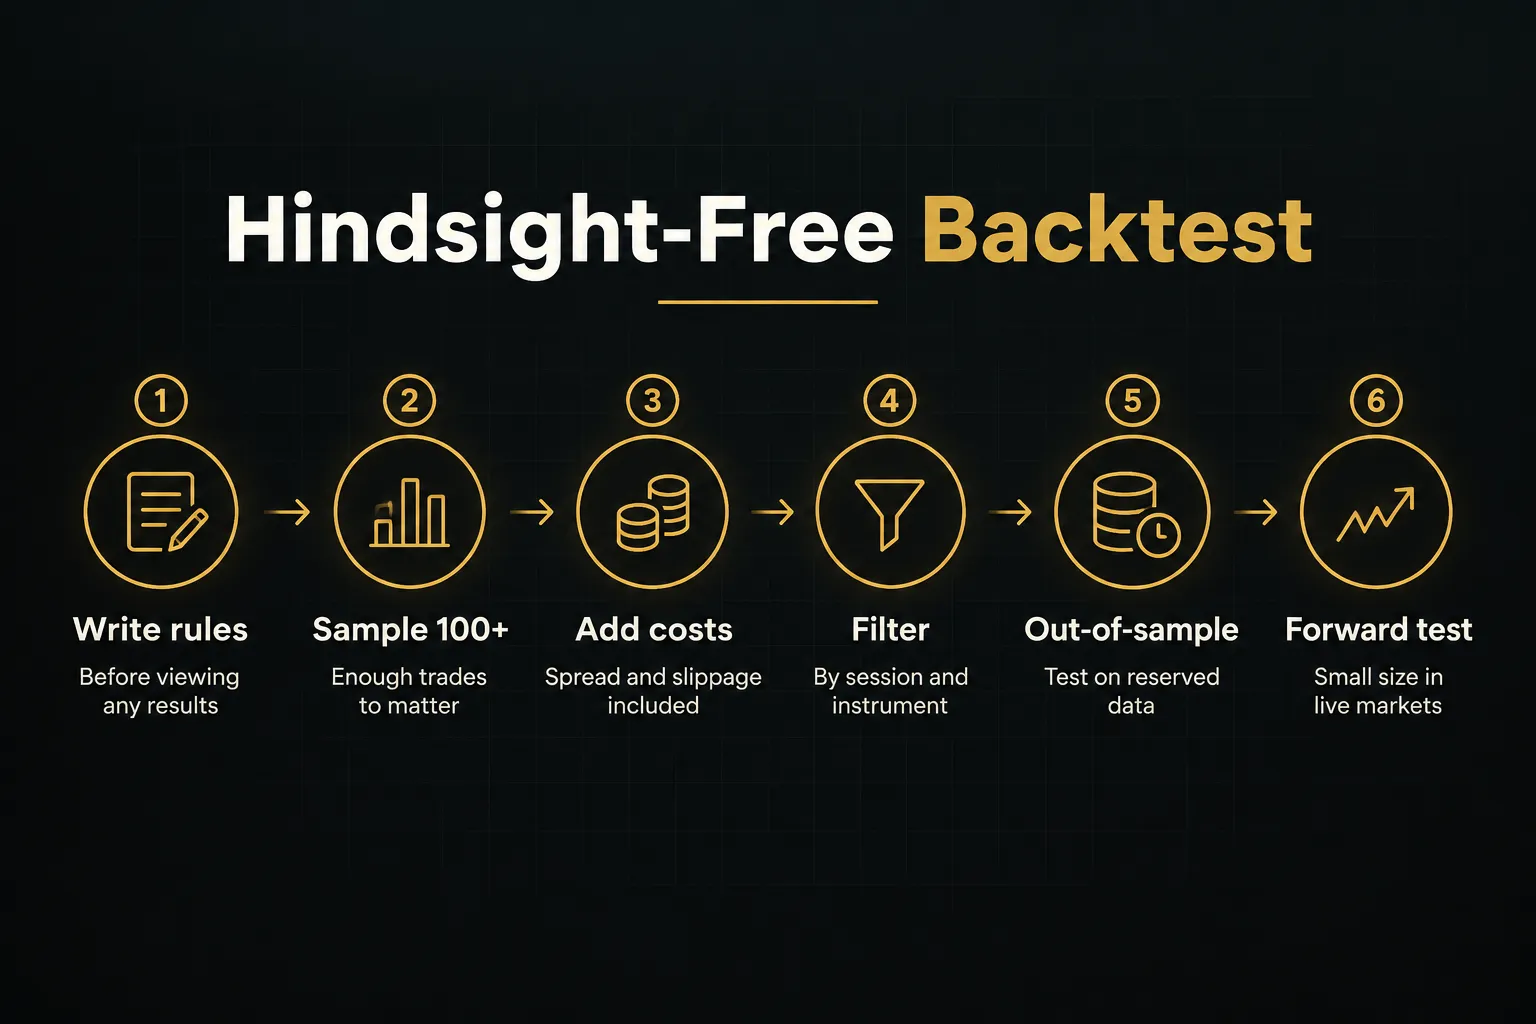
- Write your zone rules before you test. Document the pattern types, base candle limits, impulse criteria, boundary conventions, confirmation requirements, and invalidation rules. No edits mid-test.
- Collect a large enough sample. Aim for at least 100 trade instances per market and timeframe. Twenty trades can look brilliant or terrible purely by chance.
- Include realistic costs. Add typical spread, commission, and slippage to every entry and exit. A strategy that earns 0.3R per trade before costs can easily become negative after them, especially on lower timeframes.
- Filter by session and instrument. Record whether zones on GBP/USD during London perform differently from the same pair during the Asian session. Results often vary dramatically.
- Reserve out-of-sample data. Keep roughly 20% to 30% of your historical data untouched. Once the rules look promising on the first portion, run them unchanged on the reserved data. If performance collapses, the rules were likely overfit.
- Forward test before risking real size. Run the rules live on a demo or at minimal size for several weeks. Forward testing exposes execution problems (hesitation, missed fills, emotional overrides) that backtests hide.
Finally, know when not to trade zones at all.
Pause during extremely low-liquidity sessions, around major scheduled news releases, when spreads are unusually wide, and in tight choppy ranges where zones keep failing one after another. Those conditions break the assumptions the method relies on.
And a direct warning.
Forex, futures, crypto, and options are leveraged products, meaning losses can exceed what a small price move suggests and, in some cases, your initial deposit. Broker risk disclosures required in the EU and UK consistently show that a majority of retail CFD accounts lose money.
Zones don’t change that math.
Risk rules do.
Common Questions About Zone Trading
How do you trade supply and demand zones?
You trade supply and demand zones by marking a fresh zone with clear boundaries, waiting for price to return, and entering only after concrete confirmation. Place the stop beyond the distal line with an ATR buffer and target the next opposing zone.
The full process is covered in the entry, risk, and validation section above.
What is the most accurate supply and demand indicator?
No indicator is fully accurate on its own.
Zone indicators reduce discretionary marking and add consistency, and multi-timeframe tools can add confluence. They don’t replace confirmation rules, invalidation criteria, or position sizing.
What is the best timeframe for supply and demand trading?
The H4 and Daily timeframes are the best starting point for most beginners because their zones are fewer and more reliable. Use them to define key zones, then refine entries on the H1 or M15.
Lower timeframes alone produce too much noise.
How do you know if a supply or demand zone is strong?
A strong zone is fresh, has a short base of one to three candles, and shows an impulsive departure well above average range that closes near its extreme. A liquidity sweep on the approach and alignment with higher-timeframe structure add further strength.
What is the difference between an order block and a supply and demand zone?
An order block is typically the single last opposing candle before an impulsive move, while a supply or demand zone covers the full base area. Order blocks are narrower and usually tied to a break of structure.
A zone often contains an order block within it.
Do supply and demand zones really work?
Supply and demand zones can improve your odds when combined with confirmation and sound risk management, but they are not a standalone edge.
They tend to fail in choppy ranges and around major news. Backtest them on your own market before trusting them with real capital.
Trade the Zone, Not the Story
Here’s the decision rule, stripped down to three questions.
Is the zone fresh? Did it form from a clean impulsive departure that passes the range, close, and context tests? Has price given genuine confirmation with a risk-to-reward of at least 1:2?
Three yeses: the trade is on.
Any no: skip it.
Not “maybe with smaller size.”
Skip it.
The market will print another zone tomorrow, and the day after that.
The bigger shift is mental.
Zones describe where price behavior changed before. They don’t prove that a bank is sitting there waiting to defend your entry, and no chart on a retail platform can show you that.
Once you stop treating zones as secret maps of institutional intent, you stop taking failures personally… and you start managing them.
Every zone is a probability tool inside a full risk framework. Never a certainty.
Write your rules.
Test them honestly.
Size every trade so that being wrong is affordable.
That’s what turns supply and demand zones trading from a pattern you admire on a chart into a process you can actually run.
Sources
Risk Disclaimer: Trading involves risk. Past performance doesn't guarantee future results. Only trade with money you can afford to lose. PipTrend is a tool to assist your trading decisions, not financial advice.