
Success in trading often hinges on recognizing critical signals before the crowd. In 2026, mastering the candlestick pattern remains a proven way to gain clarity and improve your decision-making in any market. This article will reveal the top 10 candlestick pattern types every trader should know, breaking down essential bullish, bearish, and neutral formations. Whether you are new or experienced, you will discover practical applications, actionable strategies, and expert insights designed to sharpen your trading edge. Ready to boost your profitability and confidence? Let’s dive in and master these powerful patterns together.
Understanding Candlestick Patterns: The Foundation of Technical Analysis
Candlestick patterns are a cornerstone of modern technical analysis, offering traders a visual language to interpret price action. These patterns originated in 18th-century Japan, where rice traders developed methods to track market sentiment and predict price shifts. Today, learning to read a candlestick pattern is fundamental for anyone seeking an edge in financial markets.
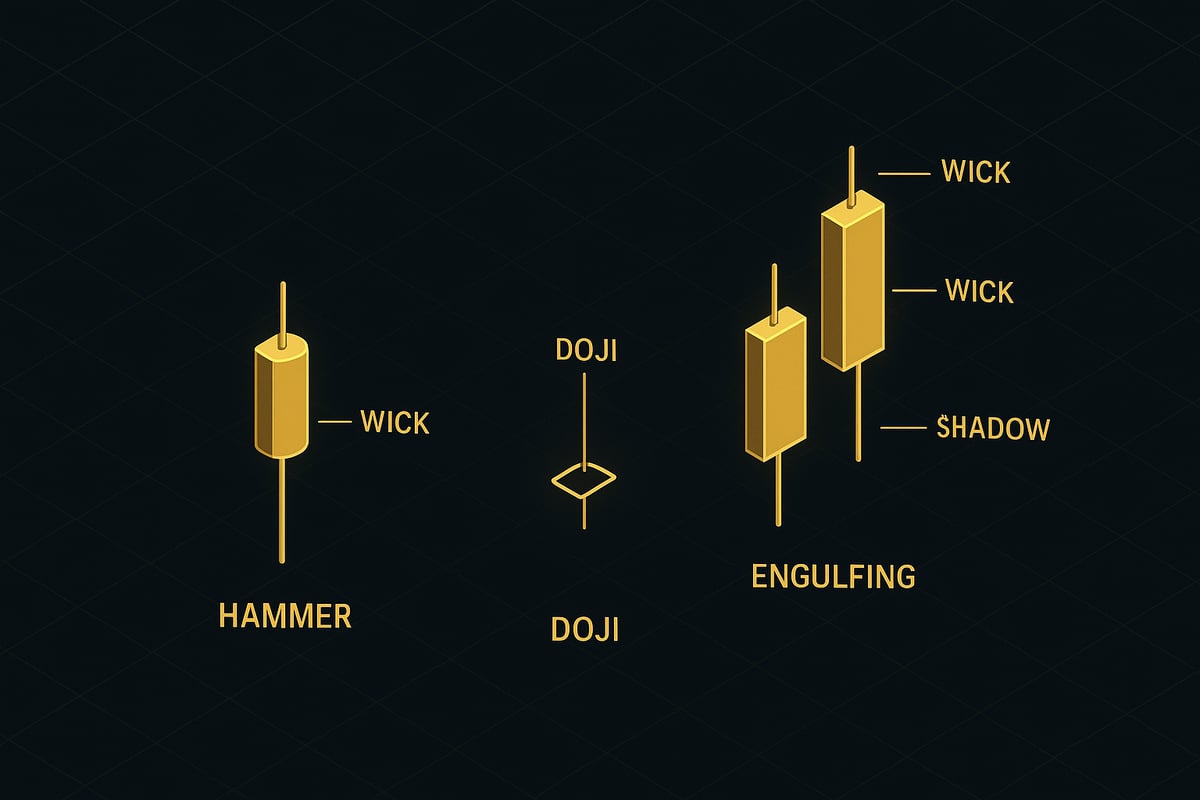
Anatomy of a Candlestick
A candlestick is made up of four main components:
- Body: Shows the difference between opening and closing prices.
- Wick (Shadow): Thin lines above and below the body, indicating the highest and lowest prices reached.
- Color: Typically green or white for bullish moves, red or black for bearish moves.
- Open/Close: The body’s top or bottom, depending on direction.
Each part of a candlestick pattern reveals critical information about buying and selling forces within a specific time frame. For instance, a long lower wick signals buyers stepping in to push prices up from intraday lows.
Why Traders Prefer Candlestick Patterns
Candlestick patterns are favored by forex, crypto, stock, and index traders for their clarity and visual immediacy. Unlike bar or line charts, a candlestick pattern quickly shows bullish or bearish momentum, helping traders make swift decisions.
According to data from IG and Wikipedia, over 70% of traders rely on candlestick charts for identifying entry and exit points. The ability to spot a candlestick pattern in real time can be the difference between catching a trend early and missing out.
The Psychology Behind Candlestick Formations
Every candlestick pattern reflects a psychological battle between buyers and sellers. When you see a long green candle, it shows sustained buying pressure and optimism. Conversely, a series of short-bodied candles with long wicks might indicate indecision or a tug-of-war in the market.
Recognizing these psychological cues through a candlestick pattern allows traders to anticipate potential reversals or continuations. Patterns like doji, hammer, and engulfing are especially valued for how they capture market sentiment shifts.
Comparing Chart Types
Let’s compare candlestick, bar, and line charts to highlight their unique strengths:
| Chart Type | Visual Clarity | Shows Open/Close | Reveals Momentum | Pattern Recognition |
|---|---|---|---|---|
| Candlestick | High | Yes | Yes | Excellent |
| Bar | Medium | Yes | Limited | Average |
| Line | Low | No | No | Poor |
A candlestick pattern stands out for its ability to visually encode more information than other chart types, making patterns easier to spot and interpret.
Single vs Multi-Candle Patterns
There are two main categories of candlestick pattern: single-candle and multi-candle. Single-candle patterns, such as the hammer or doji, provide quick signals and are ideal for spotting reversals in fast-moving markets.
Multi-candle patterns, like bullish engulfing or morning star, require more bars to form but often deliver stronger confirmation. Knowing when to use each type of candlestick pattern is vital for adapting to different trading environments.
Real-World Example: Predicting Reversals
Consider the hammer candlestick pattern. After a sharp downward move, a hammer forms with a small body and a long lower shadow. This signals that buyers have absorbed selling pressure and may reverse the trend. In the forex and stock markets, traders frequently use the Hammer candlestick pattern guide to identify such reversals and time their entries.
Mastering the candlestick pattern can help traders read the market’s narrative, react with confidence, and improve their decision-making over time.
How to Read and Interpret Candlestick Patterns Accurately
Mastering how to read a candlestick pattern is essential for any trader aiming for consistent results. Accurate interpretation provides valuable clues about market sentiment, potential reversals, and optimal entry or exit points. Let us break down the process and explore how to maximize the power of each candlestick pattern.
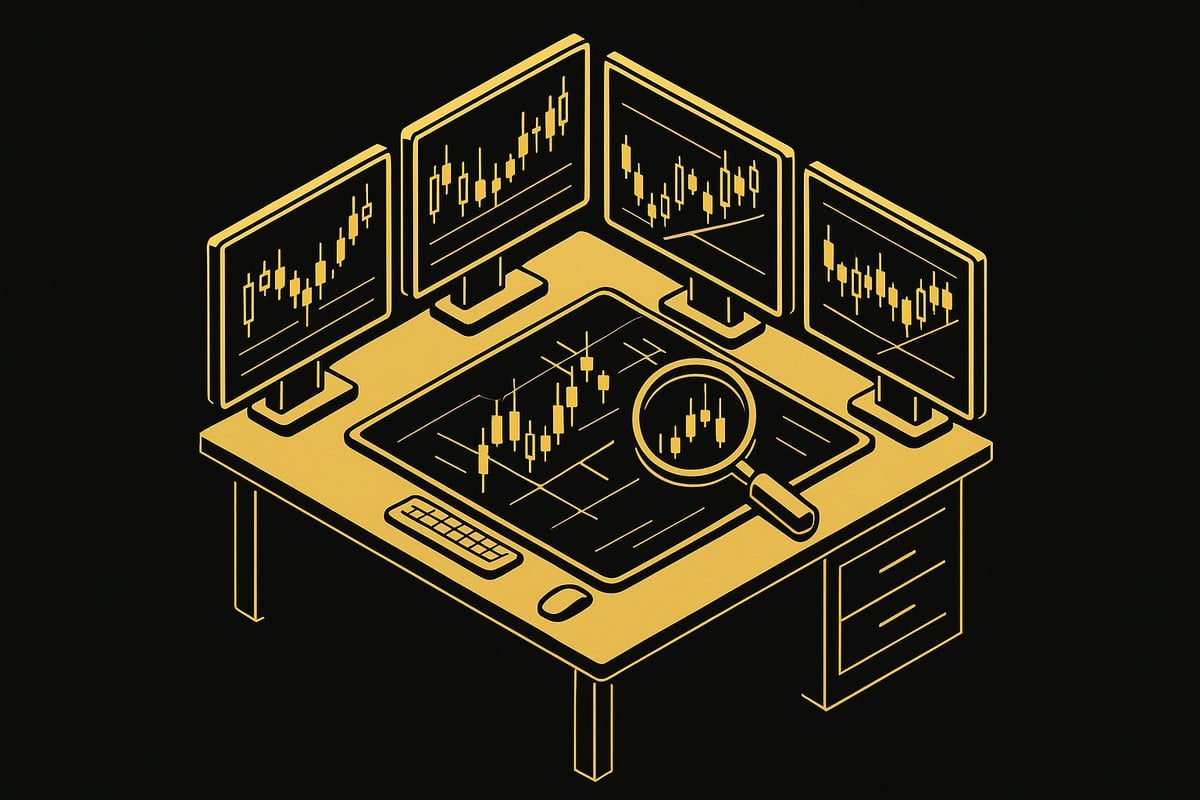
Step-by-Step Guide to Reading Candlestick Charts
Start by identifying the basic components of a candlestick pattern: the body, upper and lower shadows, and the color. The body shows the difference between open and close prices, while the shadows reveal the extremes reached during the period.
Next, scan the chart for recognizable candlestick pattern shapes. Look for single or multi-candle formations that repeat near price turning points. Pay attention to the size and proportion of each candle, as well as their position relative to recent price action.
Finally, note the sequence and relationship between candles. For example, a bullish engulfing pattern should follow a downtrend and feature a larger green candle engulfing a smaller red one. This step-by-step approach helps you recognize patterns with greater accuracy.
Why Context Matters: Trend, Support, and Volume
Reading a candlestick pattern in isolation often leads to mistakes. Always consider the broader trend: Is the market trending up, down, or moving sideways? Patterns are most reliable when they align with the prevailing trend.
Support and resistance levels are crucial. A reversal pattern at a major support zone carries more weight than one in the middle of a range. Volume adds another layer. High volume behind a candlestick pattern often signals stronger conviction and increases reliability.
Context also includes the timeframe you are analyzing. Patterns on daily or weekly charts tend to be more significant than those on lower timeframes. Always ask yourself: Does the pattern fit the market context?
Common Pitfalls and Pattern Reliability
One of the biggest pitfalls is overreliance on a single candlestick pattern without confirmation. Traders sometimes ignore market conditions or act on patterns that lack supporting evidence. Not every pattern signals a reversal or continuation; some may be false alarms.
Pattern reliability varies. Statistical studies show that some patterns, like the hammer or engulfing, are more dependable than others. However, even the most reliable patterns can fail without confirmation. For example, a doji may indicate indecision rather than a true reversal. For more details on interpreting this crucial signal, see the Doji candle pattern explained.
Backtesting and keeping a trading journal help you track which patterns work best in different scenarios. Over time, you will build confidence in your ability to interpret each candlestick pattern’s true meaning.
Combining Candlestick Pattern Analysis with Technical Indicators
To increase accuracy, combine candlestick pattern analysis with other technical tools. Trendlines help clarify direction, while moving averages confirm momentum shifts. Oscillators like RSI and MACD can signal overbought or oversold conditions that support pattern signals.
IG recommends always using candlestick patterns alongside trendlines and moving averages. This combination reduces false signals and improves decision-making. Many successful traders use demo accounts to practice spotting candlestick pattern setups and test different indicator combinations before risking real capital.
A recent case study showed a trader improving their win rate by integrating candlestick pattern recognition with technical indicators. This approach helped filter out weak signals and focus on high-probability trades, leading to more consistent results.
By following these steps, you can interpret each candlestick pattern with greater confidence and precision, paving the way for smarter trading decisions.
Top 10 Candlestick Pattern Types Every Trader Should Master in 2026
Mastering the right candlestick pattern can make the difference between consistent profits and missed opportunities. In 2026, traders face increasingly complex markets, making it crucial to recognize and interpret these patterns with precision. Below, we break down the top 10 candlestick pattern types every trader should know, offering practical insights, real-world scenarios, and actionable tips for all trading levels.
1. Hammer
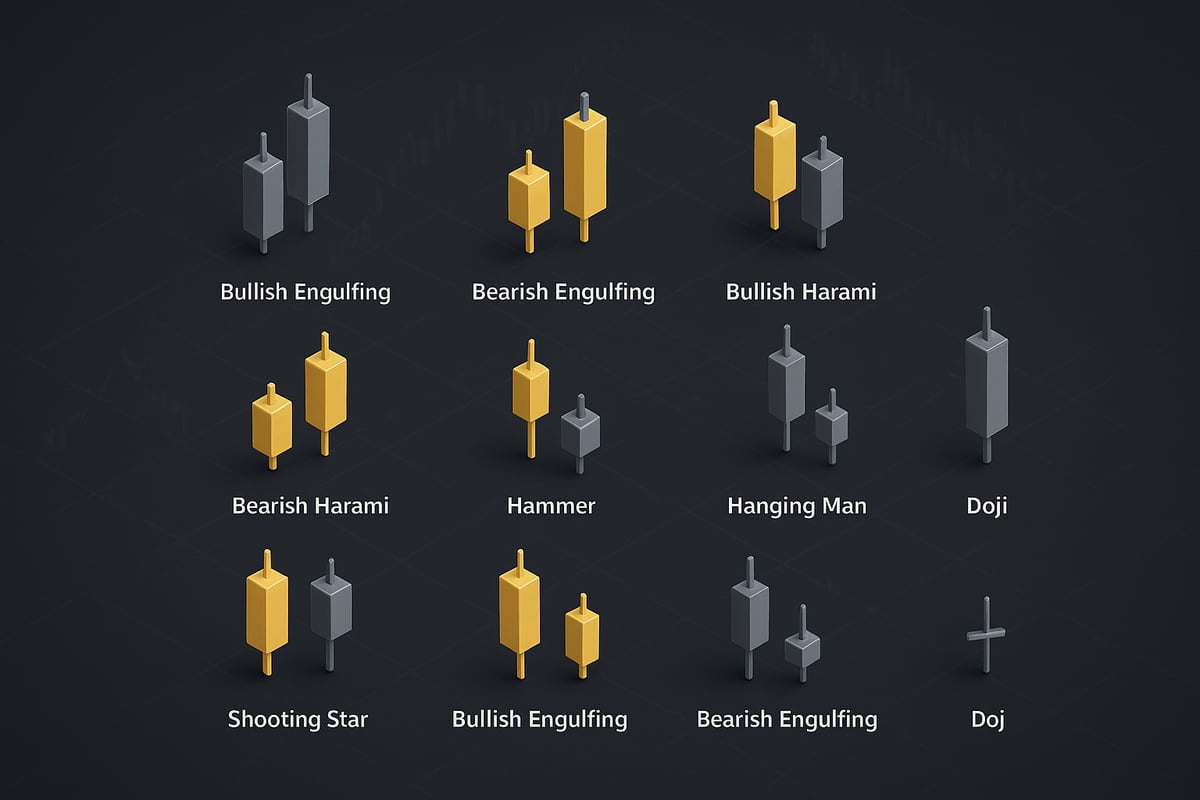
The hammer is a single-candle bullish reversal candlestick pattern that signals a potential market bottom. It forms after a sustained downtrend, often catching the attention of traders seeking early signs of reversal.
A hammer features a small real body near the candle’s top, with a lower shadow at least twice the length of the body. This structure reflects a session where sellers drove prices lower, only for buyers to step in and push the close near the open.
Key criteria for a valid hammer candlestick pattern include:
- Appears after a clear downtrend
- Lower shadow at least twice the body’s length
- Little or no upper shadow
A classic example is a stock rebounding after several red candles, suggesting buyers are regaining control. Historically, the hammer is highly reliable in both forex and stock markets, especially when confirmed by a bullish follow-through candle.
Usage tips:
- Wait for bullish confirmation on the next session
- Combine with volume spikes for added confidence
Common mistakes include confusing the hammer with the hanging man, which appears in uptrends. For a broader overview of reversal patterns, see the Reversal candlestick patterns list.
2. Shooting Star
The shooting star is a single-candle bearish reversal candlestick pattern. Its appearance marks a potential market top after an uptrend, alerting traders to possible price declines.
This candlestick pattern is characterized by a small body near the candle’s low and a long upper shadow, at least twice the body’s length. The formation shows buyers initially pushing prices higher, only for sellers to take over and drive the close back down.
Key criteria:
- Forms after an uptrend
- Upper shadow at least twice the body
- Little or no lower shadow
A common scenario is seen in the crypto market, where a shooting star signals the end of a sharp rally. The pattern's reliability increases with high trading volume.
Usage tips:
- Look for bearish confirmation on the next candle
- Combine with resistance levels for accuracy
Avoid misidentifying the shooting star in sideways markets, as context is critical for this candlestick pattern.
3. Bullish Engulfing
The bullish engulfing candlestick pattern is a two-candle bullish reversal setup. It occurs when a large green candle completely engulfs the prior red candle at the end of a downtrend.
This pattern reflects a shift in sentiment, as buyers overpower sellers and signal a trend reversal. The body of the second candle must fully cover the first, showing strong buying momentum.
Key criteria:
- Second green candle engulfs the first red candle
- Appears after a downtrend
- Significant increase in volume adds reliability
A typical example is a stock bouncing after a persistent decline, with the bullish engulfing pattern triggering renewed buying interest. It is most effective on higher timeframes, such as daily or weekly charts.
Usage tips:
- Combine with support levels for stronger signals
- Wait for pattern completion before entering trades
A common mistake is entering before the pattern fully forms, which can lead to false signals in this candlestick pattern.
4. Bearish Engulfing
The bearish engulfing candlestick pattern is a two-candle bearish reversal pattern. It forms at the top of an uptrend when a large red candle completely engulfs the prior green candle, signaling a shift in market sentiment.
This pattern highlights sellers taking control after a period of buying. The second candle’s body must fully cover the first, indicating strong selling pressure.
Key criteria:
- Second red candle engulfs the first green candle
- Forms after an uptrend
- Larger body signals increased reliability
An example is an index reversing after an extended rally, with bearish engulfing marking the onset of a downward move. The pattern is more reliable when confirmed by overbought RSI readings.
Usage tips:
- Use for short entries or profit-taking
- Confirm with other technical indicators
Ignoring the overall trend direction is a common pitfall when trading this candlestick pattern.
5. Morning Star
The morning star is a three-candle bullish reversal candlestick pattern. It appears after a downtrend and consists of a bearish candle, a small-bodied candle (often a doji or spinning top), and a bullish candle.
This formation signals that bears are losing momentum and bulls are regaining control. A gap down before the second candle and a gap up after are key features.
Key criteria:
- First candle is bearish
- Second candle is small-bodied, often a doji
- Third candle is bullish and closes well into the first candle’s body
A classic scenario is a forex pair reversing after a sharp fall. The morning star is stronger with high volume on the third candle.
Usage tips:
- Confirm with moving average crossovers
- Look for volume confirmation
Traders often overlook the significance of the middle candle, which is vital for this candlestick pattern’s reliability.
6. Evening Star
The evening star is a three-candle bearish reversal candlestick pattern. It forms after an uptrend and consists of a bullish candle, a small-bodied candle, and a bearish candle.
This setup indicates bulls are losing steam and bears are taking over. The pattern features a gap up before the second candle and a gap down after.
Key criteria:
- First candle is bullish
- Second candle is small-bodied
- Third candle is bearish, closing well into the first candle’s body
A common example is commodity prices peaking and starting to decline. The evening star is more pronounced on daily or weekly charts.
Usage tips:
- Look for confirmation from resistance zones
- Combine with other indicators for added confidence
Failing to confirm with additional indicators is a frequent mistake when trading this candlestick pattern.
7. Doji
The doji is a single-candle candlestick pattern where the open and close are nearly equal, signaling indecision in the market. It can indicate a possible trend reversal or a pause in price movement.
The doji’s small or nonexistent body, along with long shadows, reflects a balance between buyers and sellers. There are several types: standard, long-legged, gravestone, and dragonfly.
Key criteria:
- Open and close prices are nearly the same
- May have long upper and lower shadows
A typical scenario is the market pausing after a strong trend, giving traders a warning of a potential change.
Usage tips:
- Treat doji as a warning, not a standalone entry signal
- Look for confirmation before acting
Trading solely based on the doji without confirmation is a common error with this candlestick pattern.
8. Piercing Line
The piercing line is a two-candle bullish reversal candlestick pattern. It forms when the first candle is a long red, followed by a long green candle that opens below the prior close but closes above the midpoint of the first candle.
This pattern indicates aggressive buying after a period of selling. The second candle’s close above the midpoint is crucial for validity.
Key criteria:
- Second green candle closes above midpoint of the first red candle
- Forms after a downtrend
- Higher volume on the second candle increases reliability
An example is a stock rebounding after a gap down, with the piercing line signaling a shift in sentiment.
Usage tips:
- Confirm with support zones
- Look for volume confirmation
Misreading the piercing line as a bullish engulfing pattern is a frequent mistake when using this candlestick pattern.
9. Dark Cloud Cover
The dark cloud cover is a two-candle bearish reversal candlestick pattern. It occurs at the top of an uptrend, with the first candle being long and green, and the second being red, opening above the prior close but closing below the midpoint.
This formation shows sellers gaining control after bullish momentum. The second candle’s close below the midpoint is a key signal.
Key criteria:
- Second red candle closes below midpoint of the first green candle
- Forms after an uptrend
- Larger candles increase reliability
A common scenario is a market reversing after positive earnings news, with dark cloud cover marking the shift.
Usage tips:
- Combine with overbought indicators
- Confirm with resistance levels
Traders sometimes confuse this with the bearish engulfing candlestick pattern, which has different criteria.
10. Harami (Bullish & Bearish)
The harami candlestick pattern is a two-candle setup signaling potential reversal or pause. The second candle’s small body is contained within the prior candle’s larger body, reflecting a shift in momentum or market indecision.
A bullish harami appears after a downtrend, while a bearish harami forms after an uptrend. Both types highlight reduced momentum and possible trend change.
Key criteria:
- Second candle’s body is within the range of the first
- Occurs after a strong directional move
- Small second body compared to the first
A classic example is a forex market stalling after a strong move, with the harami marking a pause or reversal.
Usage tips:
- Confirm with trendline breaks or volume spikes
- Assess broader market context
Ignoring the overall market environment is a common pitfall with this candlestick pattern.
Integrating Candlestick Patterns Into a Modern Trading Strategy
Integrating candlestick pattern analysis into your trading strategy is essential for navigating today's fast-paced markets. By combining the strengths of candlestick pattern recognition with proven technical indicators, traders can significantly improve both accuracy and consistency.

Why Combine Candlestick Patterns with Technical Indicators?
Relying solely on a candlestick pattern can lead to false signals. Integrating indicators such as RSI, MACD, or moving averages adds a layer of confirmation, filtering out noise and highlighting high-probability setups. For example, a bullish engulfing candlestick pattern that appears alongside an oversold RSI is far more reliable than the pattern alone.
This multi-factor approach reduces risk and increases trade precision. A recent Bullish Reversal Candlestick Patterns Study shows that traders who use confirmation strategies with candlestick pattern signals can achieve higher profitability, especially in volatile sectors.
Building a Daily Trading Routine with Candlestick Patterns
Consistency is key to success. Start each session by scanning for prominent candlestick pattern formations on your watchlist. Log potential setups and note their location relative to support, resistance, and trendlines. Always wait for confirmation from your preferred technical indicators before entering a trade.
According to IG, traders who combine indicator confirmation with candlestick pattern analysis see their accuracy improve by 15 to 20 percent. This structured workflow not only boosts confidence but also helps you avoid impulsive decisions.
| Routine Step | Purpose | Tool/Pattern Used |
|---|---|---|
| Market scan | Identify potential setups | Candlestick pattern |
| Mark support/resistance | Contextual analysis | Trendlines, chart |
| Indicator confirmation | Increase reliability | RSI, MACD, moving avg |
| Entry/exit planning | Define risk and reward | Candlestick pattern |
| Record in trading journal | Track performance and patterns | Journaling software |
Backtesting, Journaling, and Adapting Strategies
Backtesting your candlestick pattern setups on historical data is crucial for building trust in your strategy. Journaling each trade, including the specific candlestick pattern used and the outcome, reveals patterns in your decision-making and helps fine-tune your approach.
Adaptation is also vital. The effectiveness of a candlestick pattern can vary across asset classes. For instance, rule-based analyses of candlestick patterns in cryptocurrency markets, as discussed in Candlestick Patterns in Cryptocurrency Markets, highlight the need to adjust strategies for different volatility profiles and trading hours.
Overcoming Psychological Traps with Candlestick Patterns
Even with a solid candlestick pattern strategy, psychological pitfalls can undermine results. Overtrading, confirmation bias, and ignoring risk management are common mistakes. To counter these, set clear entry and exit rules, use stop-losses, and review your journal regularly.
Consider this: A trader who combined multiple candlestick pattern signals with moving average confirmation and strict risk controls improved their win rate over three months. This disciplined approach, reinforced by data and self-reflection, can help you master the candlestick pattern and maintain an edge in any market environment.
Advanced Tips for Mastering Candlestick Patterns in 2026
Mastering the candlestick pattern in 2026 requires a blend of foundational expertise and adaptation to new market realities. As technology and trading environments evolve, so must your approach. Let us explore advanced strategies to keep your edge sharp.
Navigating Modern Market Dynamics
The reliability of any candlestick pattern is influenced by the rapid rise of algorithmic trading and high-frequency strategies. These automated systems can distort traditional signals, making it crucial for traders to recognize when a pattern is genuine or artificially triggered. Staying updated on market structure shifts will help you interpret patterns with greater nuance.
Multi-Timeframe Analysis for Confirmation
No single timeframe tells the entire story. Advanced traders analyze the candlestick pattern on several timeframes to confirm signals and filter out noise. For example, a bullish engulfing on the hourly chart gains strength if it aligns with a reversal on the daily chart. This layered approach increases accuracy and reduces false positives.
Harnessing AI and Pattern Recognition Tools
Modern software leverages machine learning to scan thousands of charts for each candlestick pattern, providing near-instant alerts. These tools can spot subtle variations that human eyes might miss. According to Deep Learning for Candlestick Pattern Recognition, AI-driven methods are improving pattern detection in complex markets, giving traders a technological advantage.
Learning from Pattern Failures
Not every candlestick pattern will work as expected, especially in volatile or manipulated conditions. Documenting failed setups is as important as celebrating wins. Analyze why the pattern failed: Was it due to news, low volume, or conflicting indicators? This process transforms losses into valuable insights for future trades.
Committing to Continuous Learning
The world of candlestick pattern analysis never stands still. Engage with reputable trading communities, enroll in updated courses, and follow industry research to refine your skills. Staying curious and open to new techniques ensures you adapt to shifts in market behavior and technology.
The Power of Demo Trading and Forward-Testing
Test every new candlestick pattern strategy in a risk-free environment before going live. Demo accounts allow you to forward-test under real market conditions, helping you build confidence and identify strengths or weaknesses. Consistent review and adjustment create a strong foundation for long-term success.
Avoiding Myths and Personalizing Your Approach
Beware of common myths, such as believing every candlestick pattern guarantees reversal. Tailor your strategies based on your trading style, risk tolerance, and asset class. Personal experience and data-driven adjustments are key to making candlestick pattern analysis work for you.
Now that you know the top candlestick patterns to watch for in 2026, it’s time to put this knowledge to work. Imagine pairing your new skills with real-time, AI-powered signals—no more second guessing or missed opportunities. With PipTrend, you get instant alerts and multi-timeframe analysis, making it easier to spot those critical setups across forex, stocks, crypto, and indices. If you’re ready to gain confidence and consistency in your trades, let’s take the next step together.
See Your Trading Improve With PipTrend