TradingView Free Plan in 2026: What You Really Get
On this page
Why the TradingView Free Plan Confuses So Many Traders
Ask ten traders whether TradingView is free and you’ll get ten slightly different answers.
All of them are partly right, which is exactly the problem.
The confusion got worse after TradingView restructured its tiers. The old Pro / Pro+ / Premium naming is gone, replaced by a five-tier ladder: Basic (free), Essential, Plus, Premium, and Ultimate.
Plenty of guides published before that change are still circulating, still quoting limits that no longer match reality.
So here’s what this guide does differently.
It covers the exact Basic plan limits as they stand in 2026: indicators per chart, active alerts, watchlist symbols, saved chart layouts, historical bars, and how delayed market data actually works.
But a feature list alone is close to useless.
Knowing you get two indicators tells you nothing about whether your strategy survives that constraint.
Most competing articles stop at the spec sheet.
This one walks through how each limit bites during a real trading week, and what a disciplined process looks like when you’re working inside those walls rather than pretending they don’t exist.
The free plan isn’t a crippled demo. It’s a constraint set. And constraints, handled properly, tend to produce better traders than unlimited options do.
By the end, you’ll know whether Basic covers your workflow, where it breaks, and what to fix first if it does.
What the Basic Plan Includes in 2026
TradingView’s free tier is genuinely free.
No trial clock, no credit card, no forced upgrade after 30 days.
You can use it indefinitely.
What you get on Basic is the full charting engine.
Not a stripped version, not a preview.
The same rendering, the same drawing tools, the same timeframe controls that paying users see.
That includes access to thousands of symbols across equities, futures, forex, crypto, indices, and bonds. It includes the community script library, which runs into the hundreds of thousands of published indicators and strategies.
It includes paper trading with a simulated account, and it syncs your charts across desktop, browser, and mobile.
Pine Script is also included on Basic. You can write, publish, and run custom indicators, which matters more than most beginners realise, because a single well-built script can do the work of several separate tools.
We’ll come back to that.
Basic vs Essential vs Higher Tiers
The five tiers scale along predictable axes: indicators per chart, charts per layout, saved layouts, active alerts, watchlist capacity, and historical data depth.
Basic sits at the floor of every one of those.
Essential roughly doubles or triples most of them and removes ads. Plus, Premium, and Ultimate keep climbing, with Premium adding second-based intervals and far deeper history, and Ultimate targeting professional multi-monitor setups.
TradingView pricing shifts with promotions and annual billing discounts, so treat any dollar figure you read elsewhere as approximate.
The tier structure is stable; the price tags are not.
One thing worth understanding early: upgrading does not automatically upgrade your data.
Charts, Devices, and Data Access
Accessing a chart and receiving real-time market data are two separate things.
This trips up more new users than any other aspect of the platform.
TradingView’s subscription buys you the software.
Exchange data is licensed separately by the exchanges themselves, and many stock, futures, and index feeds require their own data subscription even on paid plans.
On Basic, most U.S. equity feeds arrive with a delayed market data lag, commonly 15 minutes.
Some exchanges impose longer delays.
Others impose none.
Crypto is the notable exception.
Most major crypto exchange feeds stream in real time on the free plan, because those exchanges don’t charge for data the way traditional venues do.
Many forex feeds behave similarly.
So a crypto or forex trader on Basic may never notice a delay.
A U.S. equities day trader will notice within about four seconds.
Device sync works across everything.
Open a chart on your laptop, adjust a trendline, and it’s there on your phone. Your single saved layout follows you, which is convenient and also a reminder of how little storage you actually have.
The Real Limits You’ll Hit
Here’s the part nobody tells you clearly.
The limits aren’t spread evenly across the platform, and two of them do almost all the damage.
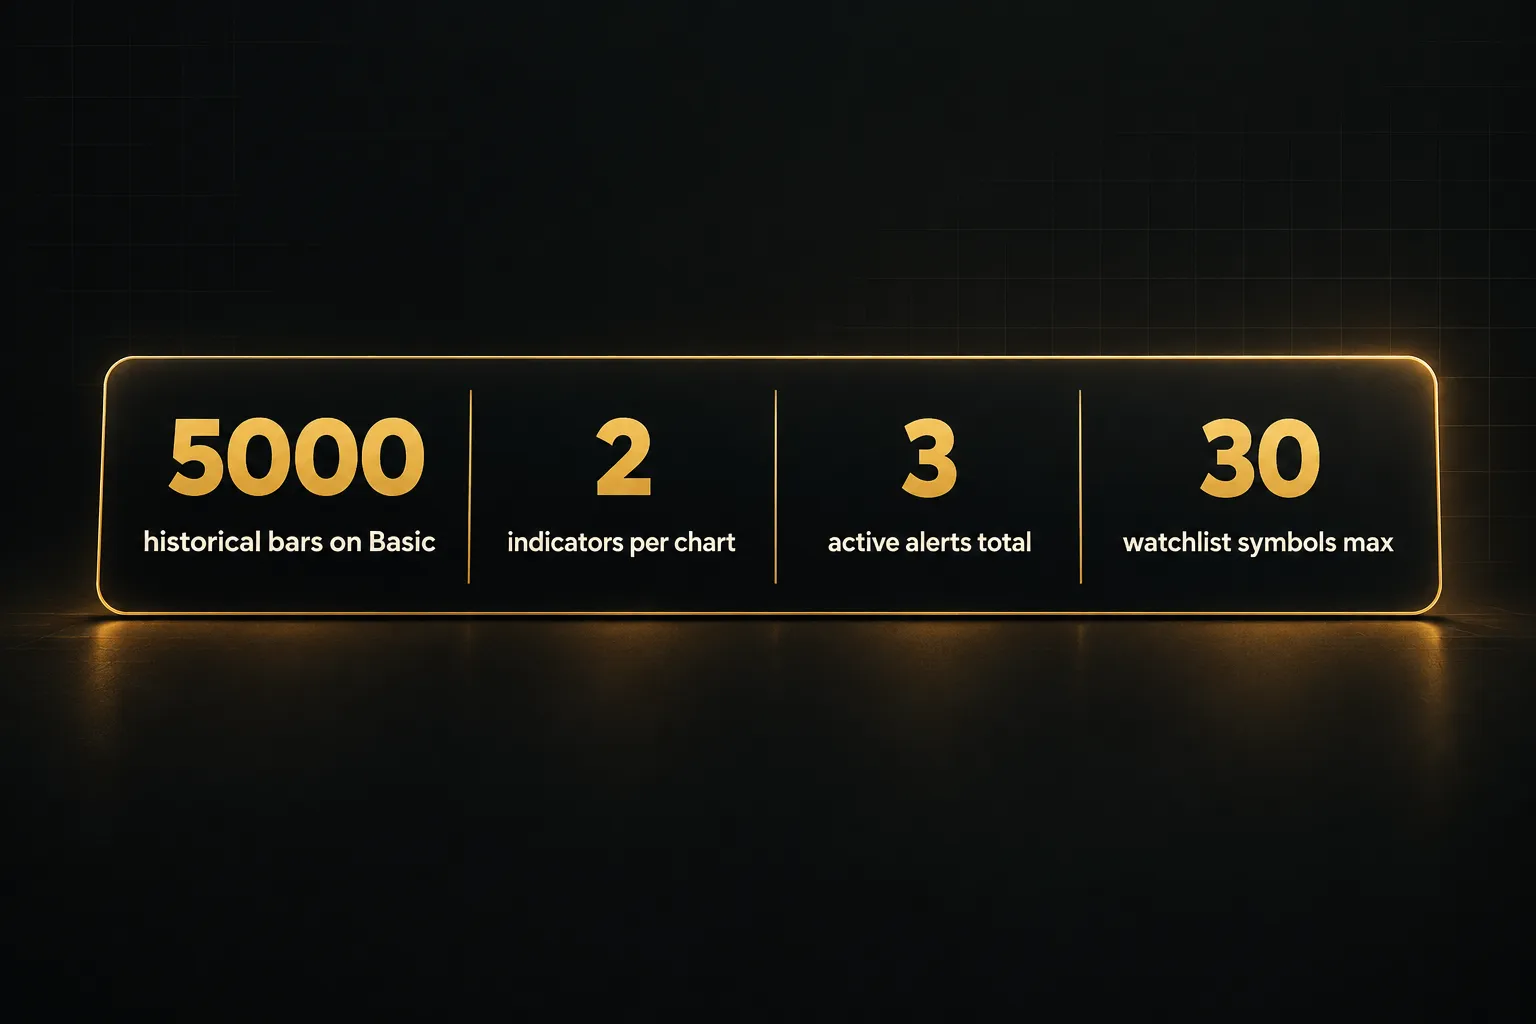
| Feature | Basic (Free) Limit in 2026 | What It Means in Practice | When You’ll Feel It |
|---|---|---|---|
| Charts per tab | 1 | No side-by-side comparison inside one window | Immediately, if you do multi-timeframe analysis |
| Saved chart layouts | 1 | One stored workspace; new setups overwrite the old one | As soon as you trade two different strategies |
| Indicators per chart | 2 | Two script slots total, including volume and moving averages | Within the first hour of setup |
| Watchlists | 1 list, up to 30 symbols | No separate lists by sector, strategy, or asset class | Forex and multi-sector equity traders, fast |
| Active alerts | 3 | Price and technical alerts share the same cap | Any alert-driven workflow, day one |
| Historical bars | ~5,000 | Limits how far back charts and backtests reach | Intraday strategy backtesting |
| Ads | Displayed | Banner and sidebar advertising on charts | Constantly, though it’s cosmetic |
| Pine Script | Included | Full scripting access, bound by the 2-slot limit | Not a bottleneck, the slot count is |
The historical bars number deserves a second look. Roughly 5,000 bars sounds generous until you divide it by timeframe.
On a Daily chart, 5,000 bars is about 19 years of trading history.
Plenty.
On a 1-minute chart, it’s roughly 13 trading days. On a 5-minute chart, around two months.
That asymmetry means free-plan swing traders get near-professional depth, while intraday traders get a sliver. If your edge depends on testing an intraday setup across a few hundred occurrences, Basic won’t reach far enough back to find them.
Price Alerts vs Technical Alerts
TradingView distinguishes between two alert types, and both draw from the same three-slot budget.
Price alerts fire when a symbol crosses a specified level. Simple, reliable, and the cheapest kind of monitoring in terms of mental overhead.
Technical alerts are tied to something dynamic: an indicator value, a strategy condition, or a drawing tool such as a trendline or channel. An alert on an RSI crossing 70, or on price touching an ascending trendline, falls here.
Technical alerts are far more useful and far more expensive in slot terms, because they’re the ones you actually want running.
With three total, the realistic split for most traders is two technical and one price, or the reverse.
Why Alerts Aren’t Permanent
Free-plan alerts expire.
This is the single most commonly missed detail on the Basic tier.
Alert expiration on Basic typically kicks in after roughly two months, after which the alert stops running and needs manual renewal.
It does not warn you loudly.
It simply goes quiet.
The practical consequence is straightforward: treat free-plan alerts as a review mechanism, not a permanent monitoring system. If your risk process assumes an alert will still be armed six months from now, that assumption will eventually cost you.
Build a renewal check into your calendar.
Monthly is enough.
Trading Within the Two-Indicator Limit
Two indicators.
That’s the constraint that reshapes everything else.
Most beginners react by feeling limited. Experienced traders tend to shrug, because the majority of profitable systems use fewer indicators than the average novice chart, not more.
Here’s what fits comfortably in two slots: a moving-average crossover plus a volume filter.
Or a trend indicator plus a momentum oscillator. Or a volatility band plus a single confirmation tool.
Here’s what doesn’t fit: the four-indicator confirmation stack. EMA ribbon, RSI, MACD, and a volume profile together need four slots and you have two.
No workaround exists that doesn’t involve upgrading.
There is, however, a structural answer. A single script can contain multiple analytical components, because the platform counts slots, not logic.
Consolidated systems exploit this directly.
An all-in-one suite such as PipTrend’s indicator bundles trend direction, multi-timeframe analysis confirmation, and entry levels into one Pine Script slot, which means it coexists with a second tool inside the free plan’s limit rather than consuming the entire budget.
That’s the design principle worth internalising whether or not you use any specific product: one integrated tool beats three disconnected ones when your slot count is fixed.
Evaluating Any Indicator System Responsibly
The consolidated-tool approach only helps if the tool itself is sound. Free and paid indicator markets are both full of things that look brilliant on a historical chart and fall apart in live conditions.
Run any system, including PipTrend’s, through this checklist before you trust it with money:
- Does it confirm only on candle close? Signals that appear mid-bar and vanish before the bar finishes are repainting. Bar-close confirmation is non-negotiable for any system you plan to trade.
- Is performance shown with real statements? Verified track records, broker statements, or exportable strategy reports carry weight. Screenshots of winning trades carry none, because nobody screenshots the losers.
- Does it separate direction from entry? Knowing the trend is bullish and knowing where to enter are different problems. Systems that blur the two tend to produce entries at terrible prices in the right direction.
- Can you test it on a live chart first? Forward testing on unseen bars, even for two weeks, reveals more than a year of backtest curves. If a vendor won’t let you watch signals form in real time before paying, that’s your answer.
- Are the rules explicit? You should be able to state the entry condition, exit condition, and invalidation point in one sentence each. If you can’t, you don’t have a system.
Repainting, Bar Close, and Hindsight Bias
Repainting is when an indicator changes its historical output after the fact. A buy arrow that appeared three bars ago quietly disappears once price moves against it, leaving a chart that shows only the signals that worked.
The result is a backtest that looks flawless and a live account that doesn’t.
You cannot trade a signal that only exists in hindsight.
Bar-close confirmation is the defence.
If a signal is only valid once the candle has closed, it’s locked. It can’t be revised, and what you see on the historical chart is what you would have seen live.
The subtler problem is hindsight bias in your own testing. Scrolling back through visible history, you already know what happened next, and your brain quietly optimises the rules to fit.
That’s overfitting, and it’s why bar replay exists. Replay hides future bars and forces you to make decisions with the same information you’d have in real time.
Use it.
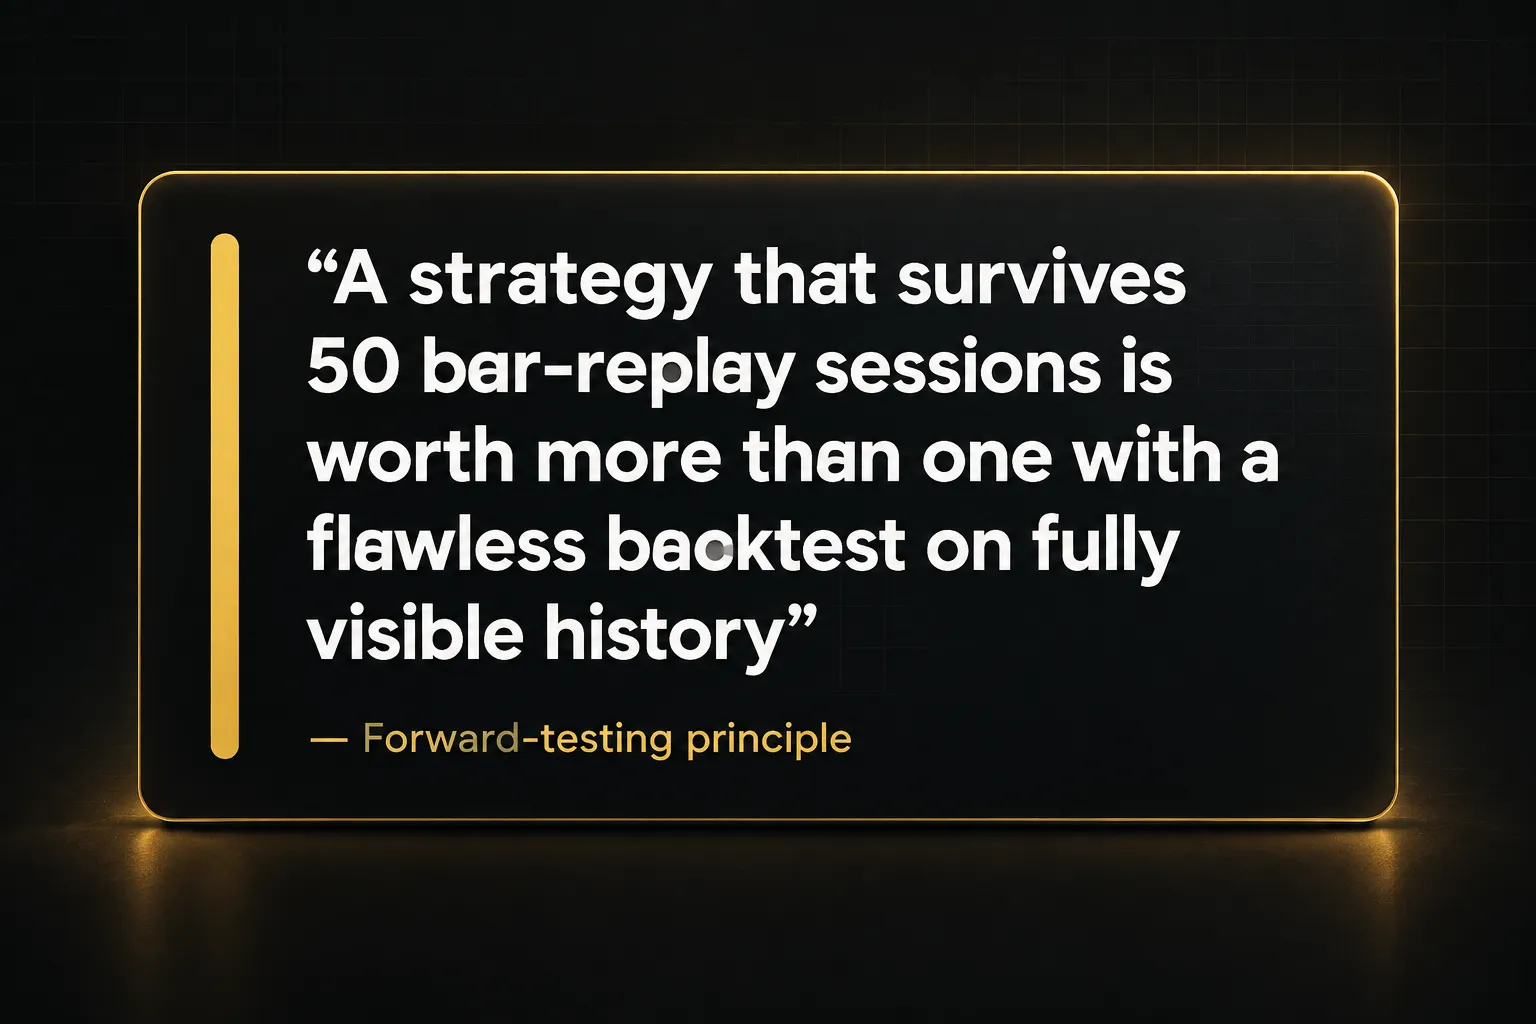
A strategy that survives 50 replay sessions is worth more than one that produces a beautiful equity curve on fully visible history.
And none of this removes the fundamentals.
No indicator, PipTrend included, substitutes for position sizing, stop-loss placement, and your own judgement about whether a setup is worth taking.
Tools narrow the decision.
They don’t make it.
Setting Up a Disciplined Free-Plan Workflow
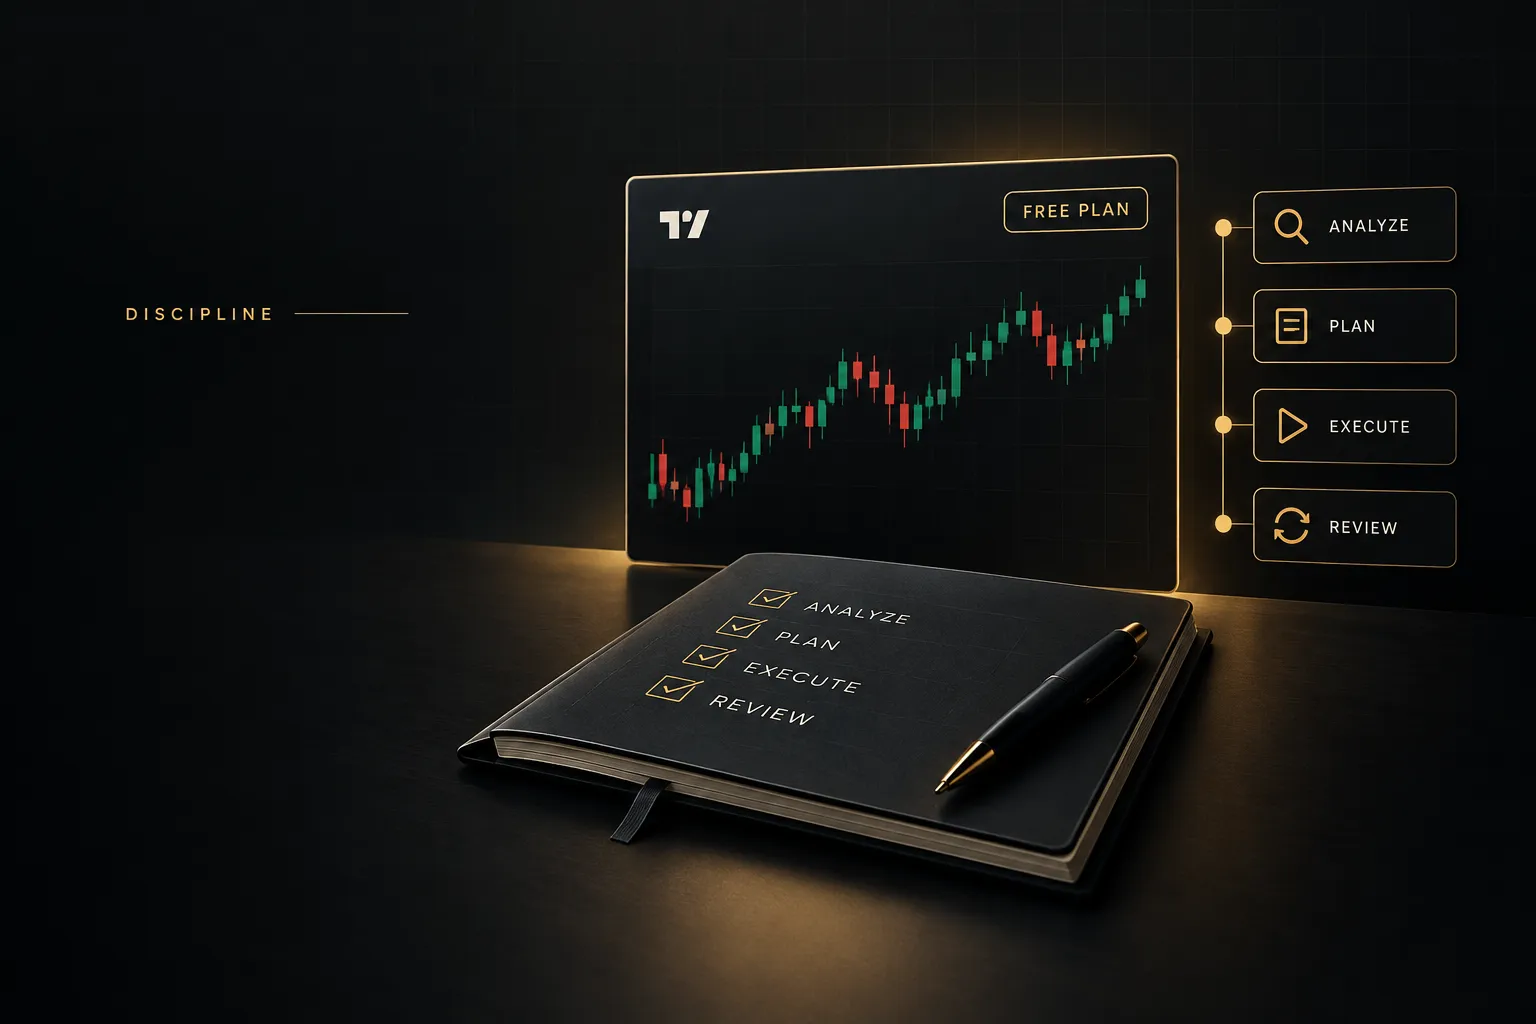
Constraints only hurt when you fight them. Build the workflow around the limits and the free plan stops feeling like a compromise.
- Pick one primary timeframe and one confirmation timeframe. With a single chart per tab, you cannot display both at once, so decide which one drives decisions (say, the 4-hour) and which one filters them (the Daily). Check the confirmation frame once per session, then work exclusively on the primary. Browser tabs handle the switching if you need both visible.
- Build one focused watchlist of 30 symbols or fewer. You get one list, so organise it around a single coherent idea rather than scattering markets you barely follow. Twenty liquid instruments you understand will outperform thirty you’ve never traded. Prune monthly and treat a symbol that hasn’t produced a setup in eight weeks as a candidate for removal.
- Configure your two indicators deliberately. Choose one directional tool and one filter, never two tools that measure the same thing. An EMA pair plus volume works; RSI plus Stochastic is redundant, since both read momentum and will agree with each other most of the time. If you’re using a consolidated multi-function script, that’s one slot spent, leaving a second free for a volume or volatility filter.
- Set your three alerts on the highest-conviction levels only. Three slots forces triage, which is healthy. Assign them to the setups you’d genuinely take today, not the ones you’re idly curious about. Then calendar a monthly review, because alert expiration on Basic will silently disarm them after roughly two months.
- Separate paper trading from analysis. Use paper trading to practise execution mechanics: order types, stop placement, position sizing, and the emotional rhythm of managing an open position. Keep backtesting and chart study as a distinct activity with a distinct purpose. Move to live broker integration only after your entries, stops, and sizing have been consistent across at least 30 paper trades.
- Journal every idea by hand. Basic includes no built-in trading journal, so a spreadsheet does the job: date, symbol, setup name, entry, stop, target, outcome, and one line on what you were thinking. Log rejected setups too, because the trades you didn’t take reveal as much as the ones you did. Review the sheet weekly and look for the pattern that keeps costing you money.
That sequence takes maybe 90 minutes to set up properly. It then runs for months with only the monthly alert renewal and watchlist prune.
Is the Free Plan Enough for Your Trading Style?
The honest answer depends on one variable: how many things you need to watch simultaneously.
If you trade one or two instruments on a single timeframe, check charts a few times a day, and rely on two or three alerts, Basic covers you completely. Nothing about the free plan will hold back that workflow.
If you run multi-timeframe setups across several asset classes with a dozen alerts armed at once, you’ll hit the ceiling in week one. Upgrading isn’t optional at that point; it’s the cost of the strategy you’ve chosen.
Day Trading, Swing Trading, and Forex Compared
Swing trading fits Basic remarkably well.
Fewer alerts, lower-frequency chart checks, and Daily or 4-hour timeframes where 5,000 historical bars stretches back almost two decades. Delayed equity data also matters far less when your holding period is six days.
Day trading is the opposite.
Multiple symbols, one chart per tab, three alerts, and a 15-minute delay on U.S. equity feeds unless you buy the data package. The single-chart limit alone makes serious intraday scanning impractical.
Forex sits awkwardly in between.
Real-time data is usually fine, but currency analysis spans majors, minors, and crosses, and 30 watchlist symbols disappears fast once you add correlated pairs and dollar-index context. The two-indicator cap also strains, since forex traders lean heavily on session filters and volatility measures alongside their directional tool.
Crypto traders generally fare best.
Real-time feeds, a manageable universe of liquid pairs, and 24/7 markets that reward patience over rapid-fire alerting.
One thing to avoid entirely: account sharing, credential swapping, or third-party tools that claim to bypass plan limits. These violate TradingView’s terms of service and risk permanent account suspension, taking your saved layouts and scripts with them.
The compliant paths are simple.
Simplify the workflow to fit Basic, or pay for the tier your strategy actually requires.
Frequently Asked Questions
Is TradingView completely free?
Yes, the Basic plan is permanently free with no trial period or credit card requirement. You get the full charting engine, Pine Script, paper trading, and thousands of symbols at no cost.
The caveats are data and capacity.
Many exchange feeds, particularly U.S. equities, arrive with roughly a 15-minute delay unless you purchase a separate data package, and the plan is capped at 2 indicators, 3 alerts, 1 layout, and 30 watchlist symbols.
What are the limitations of TradingView free?
The Basic plan limits you to 1 chart per tab, 1 saved layout, 2 indicators per chart, 1 watchlist of up to 30 symbols, 3 active alerts, and approximately 5,000 historical bars.
Ads are displayed on charts.
The two constraints that hurt most are the indicator cap and the alert cap, since both directly shape what strategies you can run. Alerts also expire after roughly two months and need manual renewal.
How many indicators can you have on TradingView for free?
Two indicators per chart on the Basic plan. That count includes everything: moving averages, volume, oscillators, and any Pine Script you add.
The practical workaround is consolidation rather than elimination. A single multi-function script that combines trend, confirmation, and entry logic occupies one slot instead of three, which is why all-in-one systems suit the free tier better than stacking separate tools.
Can you set alerts on TradingView without paying?
Yes, Basic users get 3 active alerts, covering both price alerts and technical alerts tied to indicators, strategies, or drawing tools. Both types draw from the same three-slot budget.
The important detail is expiration.
Free-plan alerts typically stop running after about two months, so schedule a monthly review and renew anything still relevant rather than assuming your alerts are permanently armed.
Is TradingView free good for beginners?
Yes, Basic is one of the strongest free starting points available for learning technical analysis. You get professional-grade charting, bar replay for forward testing, paper trading for execution practice, and the full community script library.
Two caveats matter for new traders.
Confirm whether your market shows real-time or delayed data before making time-sensitive decisions, and remember that alerts need periodic renewal.
What is the difference between TradingView Basic and Essential?
Essential increases every core capacity limit and removes advertising. You get more indicators per chart, more active alerts, more watchlist symbols, more saved chart layouts, and multiple charts within a single layout.
The upgrade makes sense at a specific trigger point: when your process genuinely needs more than 2 indicators or 3 alerts, not when you simply want more options available. Plus, Premium, and Ultimate scale those same dimensions further, with Premium adding second-based intervals and substantially deeper history.
The Bottom Line on Trading for Free
The TradingView free plan is enough to learn disciplined analysis properly. Full charting, bar replay, paper trading, and Pine Script cost nothing, and those four tools cover most of what a developing trader actually needs.
The upgrade signal is specific, not vague.
When your process genuinely depends on more than 2 indicators, 3 alerts, or 1 saved layout, you have exactly two honest choices: simplify the workflow or pay for the tier that fits it.
Given a fixed slot count, one consolidated approach beats three disconnected tools every time. That’s true whether you’re running a manual price-action method or a unified indicator system that handles trend, confirmation, and entries in a single script.
And before you pay for anything, test it.
Load any signal system, PipTrend’s free trial included, onto a live free-plan chart and watch it form signals in real time on bars nobody has seen yet.
Two weeks of forward testing will tell you more than any sales page.
It always does.
Sources
Risk Disclaimer: Trading involves risk. Past performance doesn't guarantee future results. Only trade with money you can afford to lose. PipTrend is a tool to assist your trading decisions, not financial advice.