Is TradingView Worth It in 2026? A Trader's Decision Guide
On this page
What This Guide Actually Answers
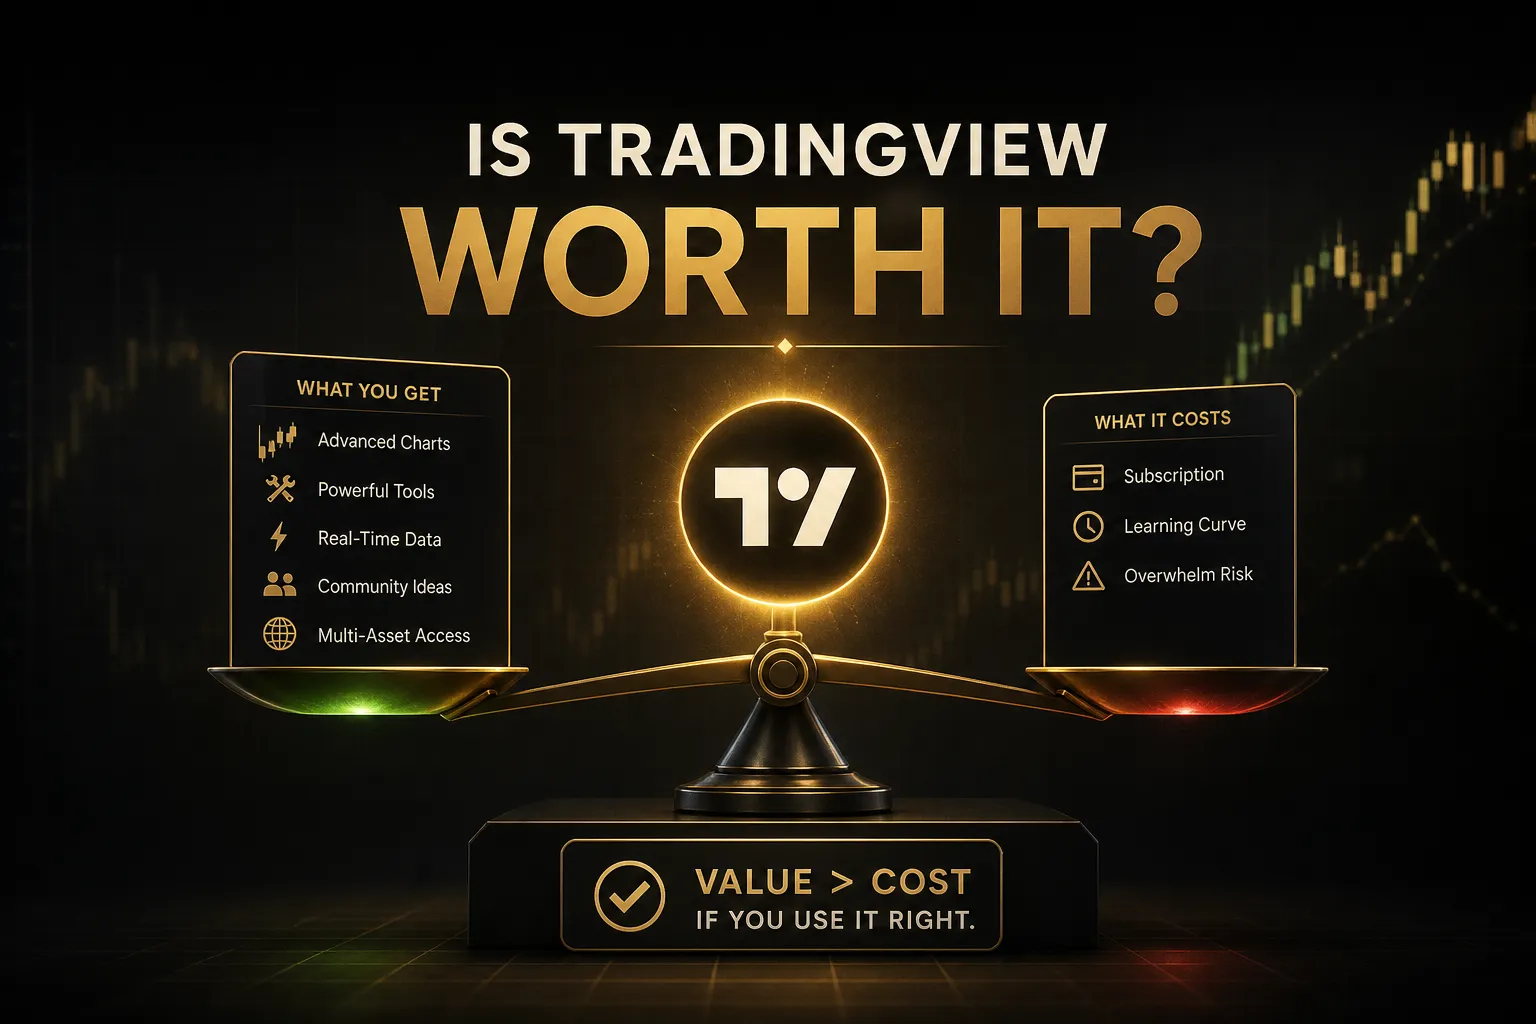
The honest answer to “is TradingView worth it” is that it depends entirely on how many charts you look at in a week.
Not on the feature list.
Not on the marketing.
A swing trader who reviews eight tickers every Sunday and a scalper juggling six futures contracts before the open are asking completely different questions, and they deserve completely different answers.
This guide splits them apart.
Most reviews stop at listing what each subscription tier includes.
That’s the easy part.
The harder question, and the one that actually costs traders money, is whether the charting platform you’re paying for is solving a problem you genuinely have.
So this guide separates four things that usually get lumped together: the value of the charts themselves, the cost of market data (which is billed separately by exchanges, not by TradingView), how order execution actually works through broker integration, and whether the indicators and signals you’ll run on the platform can be trusted at all.
That last point deserves its own warning up front.
Access to a professional charting platform is not the same thing as having a validated trading edge. The subscription buys you better tools for looking at price. It does not buy you a strategy, and it will never buy you discipline.
Plenty of traders upgrade to a premium tier, load fifteen technical indicators onto one chart, and lose money faster than they did on the free plan.
More tools, more noise, same missing risk plan.
Who this is for: beginners deciding whether to spend anything at all, day traders and scalpers who need speed, swing and position traders who mostly need clean higher-timeframe charts, forex and crypto traders whose data situation is very different from stock traders’, and indicator-focused traders who want to know how to test a signal before risking capital on it.
Each of those five gets a different verdict.
Let’s get to the numbers.
Free vs Paid: What Actually Changes
Here’s the thing most people get wrong: your TradingView subscription and your real-time quotes are two separate purchases.
Paying for the highest tier does not automatically give you live CME futures data or Nasdaq depth.
That surprises a lot of new subscribers. They upgrade, open an ES futures chart, and still see a “delayed” badge in the corner.
Nothing is broken.
The exchange feed simply wasn’t bought.
Real Data, Delayed Data, and Extra Fees
Exchanges license their price feeds.
TradingView passes those licensing fees through to you as add-ons, typically a few dollars a month for non-professional access to a single exchange, and considerably more if you’re classified as a professional user.
Delayed data in stocks and futures usually runs 15 to 20 minutes behind.
For a position trader reviewing weekly charts, that’s irrelevant.
For anyone placing an intraday entry, it’s unusable.
Crypto is the exception, and it’s a big one.
Because exchanges like Binance, Coinbase, and Kraken publish live prices through open APIs, crypto charts are real-time on every plan, including the free one.
Forex spot data is also generally live via aggregated liquidity providers.
So the practical rule: crypto and forex traders rarely pay data fees. US stock and futures traders almost always do.
Alerts, Indicators, and Chart Limits
The free plan’s restrictions are specific and easy to hit.
One indicator per chart.
A small handful of active price alerts.
No second condition on an alert.
Ads in the interface.
One chart per tab.
That one-indicator cap is the wall most people run into first. If your setup needs a moving average plus RSI plus volume, you’re already over budget.
| Capability | Free Plan | Mid Paid Tier | Top Paid Tier |
|---|---|---|---|
| Indicators per chart | 1 (2 with a Pine Script exception) | 5 | 25 |
| Charts per layout | 1 | 4 | 8 |
| Active technical alerts | 1-5 | ~100 | 400+ |
| Second condition on alerts | No | Yes | Yes |
| Webhook alerts (automation) | No | Yes | Yes |
| Bar Replay on intraday | Daily and above only | Full intraday | Full intraday + tick |
| Ads | Yes | No | No |
| Exchange real-time data | Sold separately | Sold separately | Sold separately |
Notice the bottom row.
It doesn’t change across tiers.
That’s the single most misunderstood line in TradingView’s pricing.
The behaviors that genuinely justify an upgrade are narrow and testable.
You need five or more indicators visible simultaneously because your system requires confluence.
You need more than a handful of live technical alerts running across different instruments.
You need multi-chart layouts to watch correlated markets, say DXY against gold against EURUSD, without tab-switching.
If none of those describe your week, the free plan is doing its job.
Which Plan Fits Your Trading Style
Forget the pricing page for a second.
The right question is how many setups you’re tracking at once, because that number maps almost perfectly onto which tier you need.
Day Traders and Scalpers
Intraday traders are the group that genuinely gets their money’s worth, and here’s why:
- Alert refresh speed matters at the minute level. Higher tiers poll conditions faster and reduce the lag between a level being touched and your phone buzzing. On a 1-minute chart, a delayed notification is a missed entry.
- Multi-chart layouts replace tab-switching. Watching four correlated instruments (ES, NQ, VIX, and the dollar index) in one screen is the difference between reading context and guessing at it.
- Bar Replay on intraday timeframes is locked behind paid tiers. Free users can only replay daily bars and above, which makes pre-market rehearsal of intraday setups impossible.
- Multiple watchlists organized by setup type. Gap-and-go names in one list, mean-reversion candidates in another, earnings plays in a third.
- Real-time exchange data is non-negotiable and comes as a separate charge on top of whatever tier you pick. Budget for it.
Swing Traders and Long-Term Investors
This group overpays more than any other.
Higher timeframes are forgiving in exactly the ways that make premium features unnecessary.
- A 15-minute data delay is meaningless on a daily chart. If your average hold is three weeks, delayed data costs you nothing measurable.
- One indicator is often enough. A well-configured moving average ribbon or a single custom Pine Script that bundles multiple conditions into one plot can carry an entire swing system.
- Alerts fire rarely. Five active alerts covering five watchlist names is a normal week, not a constraint.
- Screeners on the free plan already work. The stock and crypto screeners let you filter by fundamentals and technicals without a subscription, which covers most idea generation.
- Where upgrading does help: if you run a portfolio of 30+ positions and want alerts on every stop level, alert count becomes the binding constraint, not indicators.
Forex, Crypto, and Stock Data Differences
Your asset class changes the total cost more than your plan choice does.
- Crypto: real-time on the free plan across major exchanges. A crypto-only trader can run a serious operation without paying a data fee ever.
- Forex: generally real-time via aggregated feeds. Spread and quote quality vary by source, so cross-check against your broker’s pricing before trusting a tight level.
- US equities: real-time Level 1 from Nasdaq, NYSE, and AMEX requires a paid add-on per exchange, plus professional-user classification if you trade under a business entity.
- Futures: CME Group data (ES, NQ, CL, GC) is the most commonly needed paid feed and typically the one intraday traders forget to budget for.
The decision rule, stripped down: upgrade based on the number of simultaneous setups you actively monitor, not on the subscription price.
Under three, stay free.
Three to eight, mid tier.
Above eight across multiple markets, top tier plus data.
Charting Tools vs Real Execution
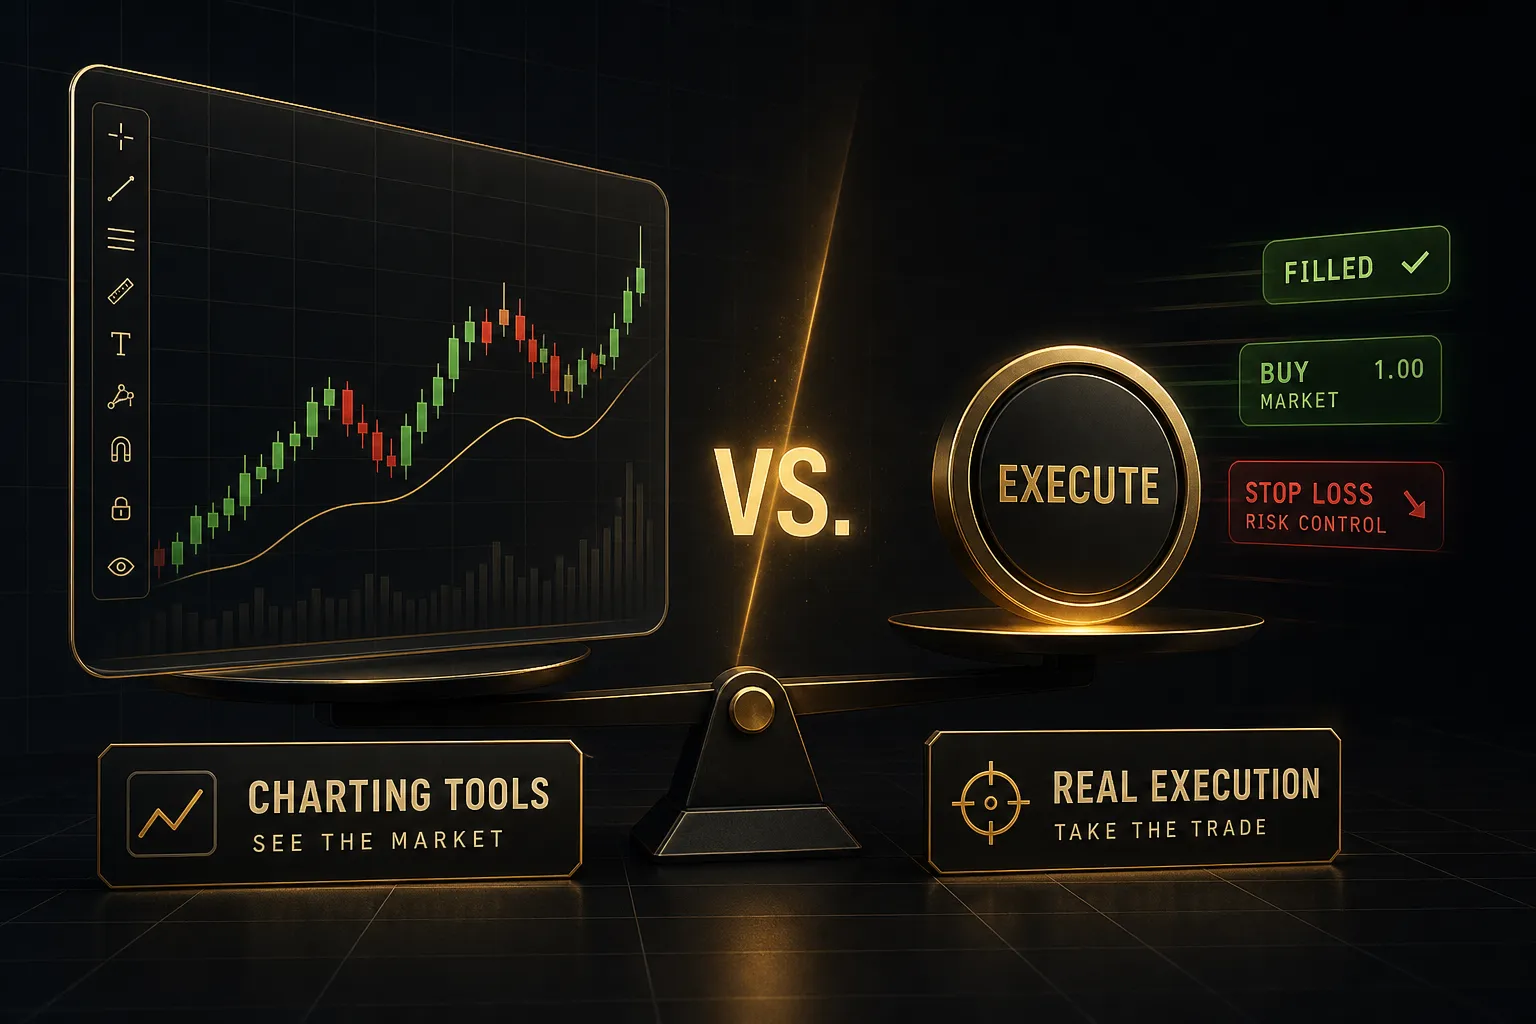
TradingView doesn’t hold your money.
That single fact reframes the entire value question.
It’s a charting and decision-support layer that sits on top of your broker, not a replacement for one. Orders you place from a TradingView chart are routed to whichever broker you’ve connected, and that broker’s rules, spreads, margin requirements, and fill quality govern everything that happens next.
Broker-Connected Order Panels
Connecting a broker gives you a trading panel inside the chart interface.
Drag a stop, adjust a limit, click a buy button.
Clean workflow.
But here’s a trap that catches even experienced users: the data feeding your order panel comes from your broker, not from the exchange feed you purchased through TradingView.
Those can be two different price streams.
You can be paying for real-time CME data on the chart while the connected broker panel shows a lagging or lower-quality quote.
In fast markets, that gap becomes real money.
Verify both streams against each other before you trade size.
The other comparison worth making is one most reviews skip entirely.
Your real alternative to TradingView isn’t a competing standalone platform.
It’s the charting software your broker already gives you for free.
Modern broker platforms have closed a lot of ground.
If your broker’s charts already support the indicators you use, multiple timeframes, and drawing tools that save properly, the honest question becomes: what specifically does the paid subscription add on top of something you already have?
Sometimes the answer is “a lot.”
Sometimes it’s “nicer aesthetics.”
Paper Trading vs Live Risk
Paper trading and backtesting get used interchangeably, and they shouldn’t be.
They test different things.
Paper trading simulates execution in real time: order placement, position management, and your own behavior under a live-moving chart. What it can’t simulate is the emotional weight of real capital, and it typically fills you at prices a live account wouldn’t get.
Backtesting tests signal logic against historical data.
It tells you whether a rule set would have produced positive expectancy over past conditions.
It tells you nothing about whether you’ll actually follow the rules.
Use paper trading to debug your workflow: hotkeys, order types, alert response.
Use backtesting to debug your strategy.
Then use small live size to debug yourself, because that’s the only test that includes the variable neither simulation captures.
Can You Trust the Signals? Validating Before You Trade
An indicator that looks perfect on a chart has a 100% hit rate on bars that have already closed.
That’s not a strategy.
That’s a drawing.
The gap between “this looks like it works” and “this has been tested” is where most trading capital goes to die. TradingView provides four distinct validation tools, and each proves something narrower than traders assume.
Backtesting Methods Compared
Visual backtesting means scrolling back through a chart and eyeballing where your signal fired.
It’s fast and it’s almost worthless on its own, because you can see what happened next while you evaluate the entry.
That’s hindsight bias in its purest form.
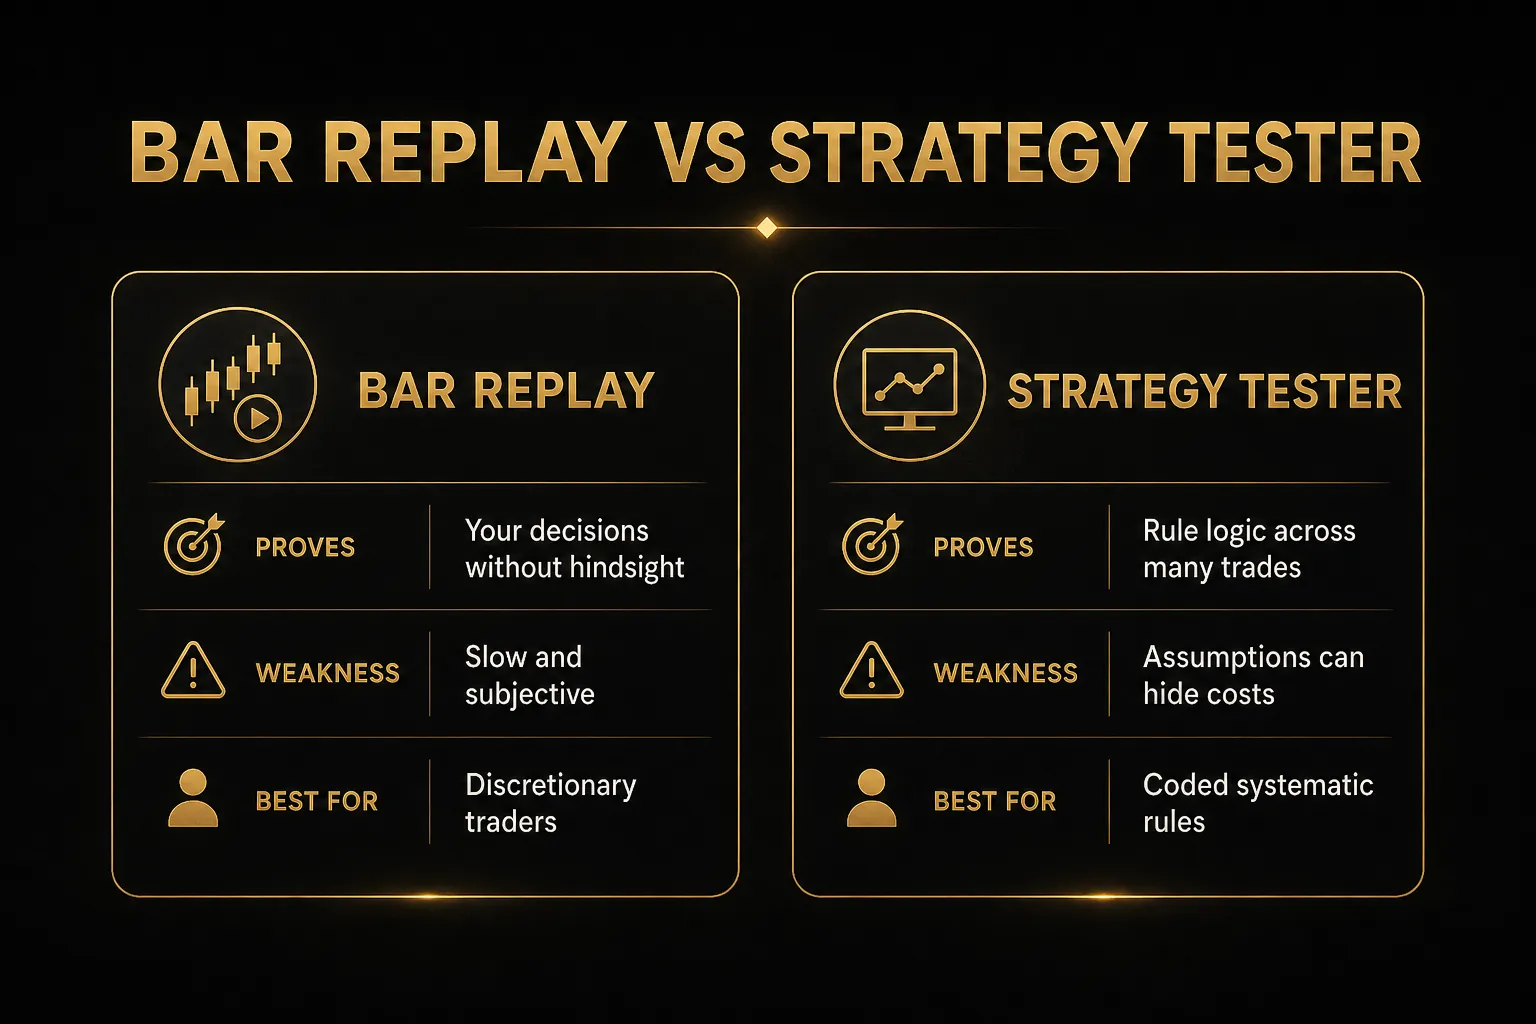
Bar Replay fixes exactly that problem.
It hides future price and steps the chart forward bar by bar, forcing you to make decisions with the same information you’d have live.
Slower, far more honest.
On the free plan it’s limited to daily and higher timeframes.
Strategy Tester runs a coded Pine Script strategy across historical data and outputs net profit, win rate, profit factor, and max drawdown. Objective numbers, which is a real advantage, but the numbers are only as good as the assumptions fed into them.
Forward testing runs the system on live, unseen data in a paper account.
It’s the only method that can’t be contaminated by curve-fitting to history.
It’s also the slowest, which is why most traders skip it.
Don’t.
One workflow bug worth knowing: if you edit an indicator’s settings after creating an alert from it, the alert may keep running the original logic.
Changing a moving average from 20 to 50 doesn’t always propagate.
Delete the alert and recreate it from the updated indicator.
Common Traps: Repainting and Overfitting
Repainting indicators are the most common source of false confidence on the platform. A repainting script changes its historical signals after the fact, so the chart shows a flawless record of entries that were never actually available in real time.
Test for it directly: run the indicator in Bar Replay, note where signals appear on the forming bar, then check whether those same signals remain in the same place after the bar closes.
If they move, the historical performance is fiction.
The other traps, briefly:
- Look-ahead bias: the script references data that wasn’t available at signal time, often through higher-timeframe requests that pull unclosed candle values.
- Overfitting: tuning parameters until historical results look excellent. A system optimized to 47-period settings on 2023 data usually collapses on 2026 data.
- Survivorship bias: backtesting on today’s index constituents ignores every company that got delisted, which inflates results.
- Unrealistic cost assumptions: Strategy Tester defaults often assume zero commission and zero slippage. Add realistic slippage and commissions and a marginal system frequently turns negative.
Community scripts deserve extra scrutiny.
Many are published with closed source, no explanation of the calculation logic, and no verifiable record of live outcomes.
A high like-count measures popularity, not profitability.
Contrast that with systems that publish actual trade results.
When a provider like PipTrend separates the directional signal from the entry-level tool and maintains a public results page, you can audit outcomes against real market history instead of trusting a screenshot.
That transparency is the standard worth demanding, whatever tools you end up using.
A Minimum Viable Setup for Indicator Traders
Fifteen indicators on one chart is not a system.
It’s an anxiety display.
A functional minimum setup has four components and fits comfortably inside a mid-tier plan:
- One directional signal. A single tool that answers “long, short, or flat” without ambiguity. Trend filter, momentum cross, structure break, pick one and commit.
- One entry-level tool. Direction tells you which way. This tells you where. Keeping them separate, the way PipTrend’s signal-plus-entry-level structure does, prevents the common error of entering at the worst possible price in the right direction.
- One multi-timeframe confirmation check. Before executing, verify the higher timeframe isn’t pointing the other way. This one habit filters out a large share of low-quality trades.
- Three to five alerts tied to predefined rules. Not “notify me when something happens.” Specific: entry level touched, stop level breached, target reached. Each alert maps to an action you’ve already decided on.
That’s it.
Four indicator slots, five alerts, well within a mid-tier subscription.
One final caution about automation.
Webhook alerts can fire orders to a broker or bot automatically, and that convenience cuts both ways.
Real-time notifications create a constant pull toward action, and traders who add automation without first fixing position sizing and risk management rules typically overtrade their way through an account faster than they would have manually.
Tie every alert to a fixed risk-per-trade figure before you turn anything on.
And keep a trading journal, because the journal is what tells you whether the system or your execution is the problem.
Frequently Asked Questions
Is TradingView really worth the money?
It’s worth it if you trade or analyze markets at least three to four times a week and track more than three instruments simultaneously. Below that frequency, the free plan’s single-indicator and limited-alert caps rarely bind, and you’re paying for capacity you don’t use.
The calculation shifts once you need five or more indicators on one chart, multi-chart layouts for correlated markets, or dozens of live alerts. Remember to add exchange data fees to the subscription cost when you compare it against your broker’s free charting.
Is TradingView free version enough?
For swing traders, position traders, and crypto-only traders, the free version is genuinely sufficient. Crypto and forex data is real-time by default, the screeners work without a subscription, and higher timeframes tolerate the one-indicator limit easily.
It becomes insufficient the moment you trade intraday.
Intraday Bar Replay, second alert conditions, and multi-chart layouts are all paid features, and each one is close to mandatory for scalping or day trading.
What is better than TradingView?
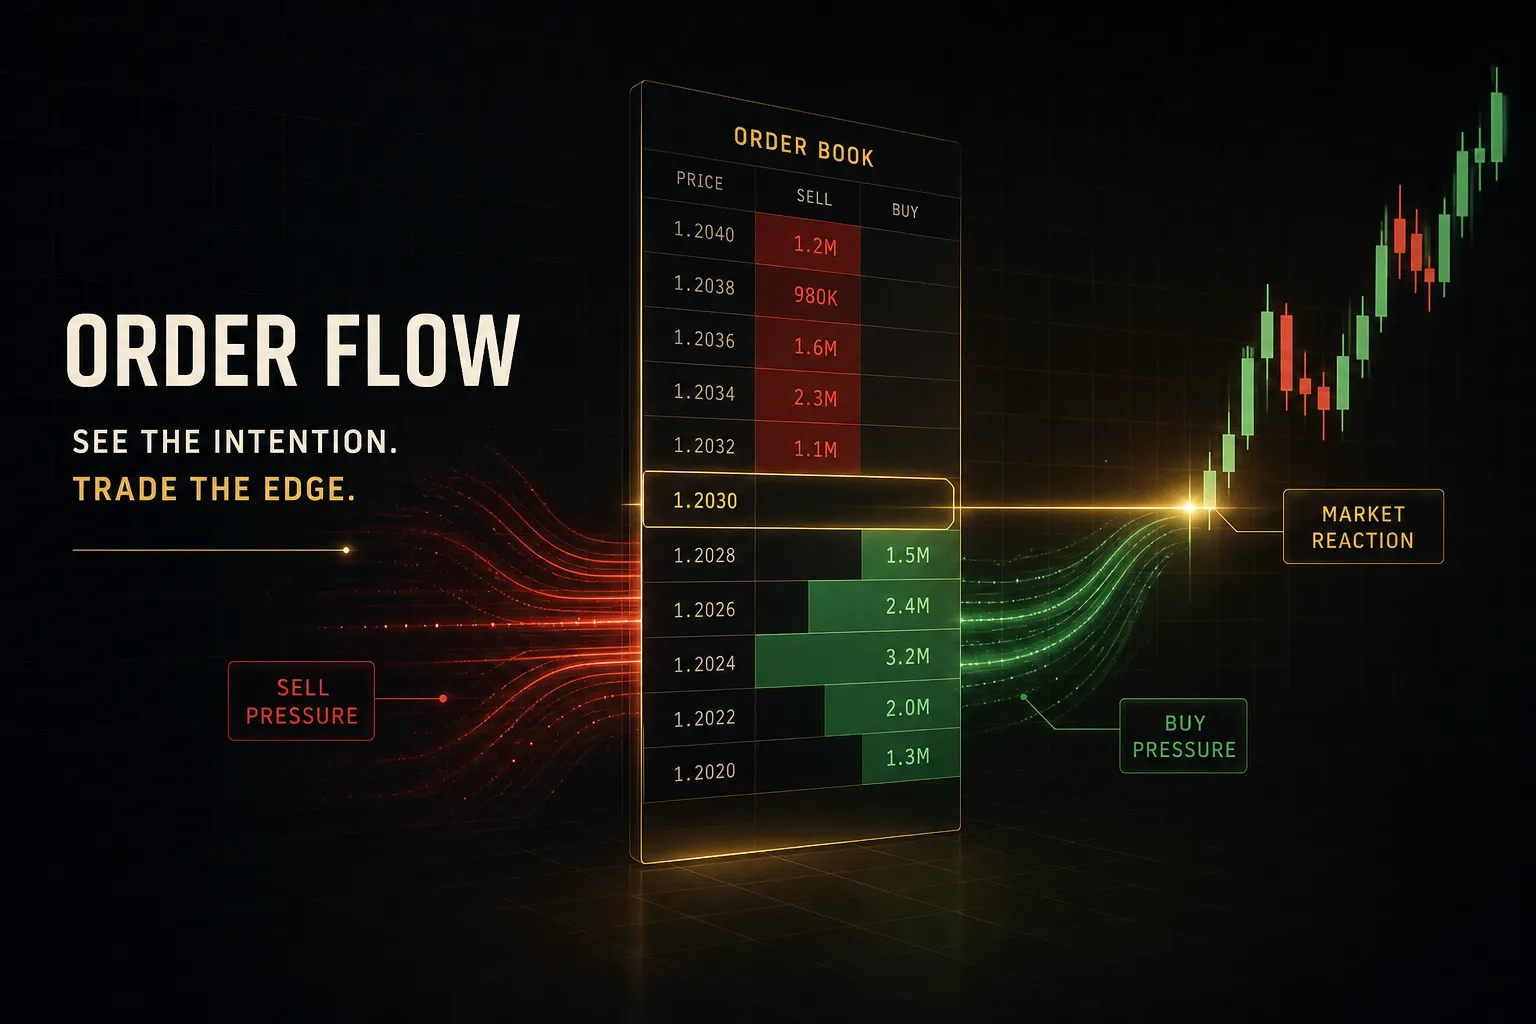
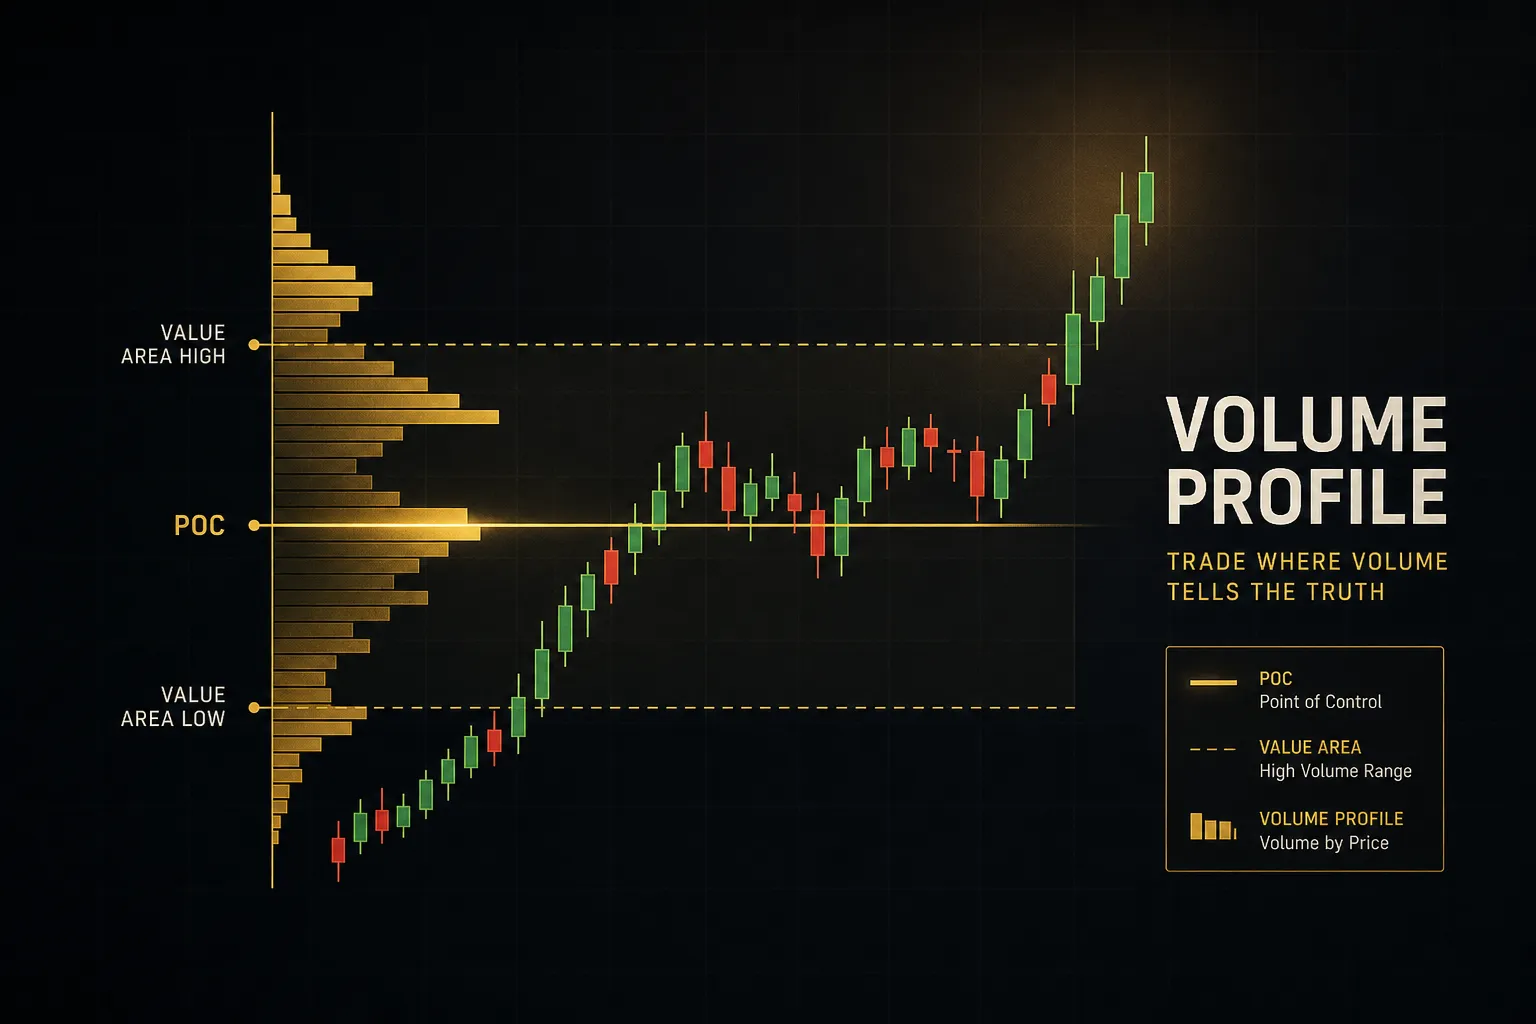
Nothing is universally better, but specific platforms beat it in specific areas. Order-flow and market-depth specialists offer footprint charts and volume profile depth that TradingView doesn’t match, and institutional terminals provide fundamental data at a scale no retail platform touches.
The comparison that actually matters is against your own broker’s built-in charts, which cost nothing and have improved substantially. If your broker already supports your indicators and timeframes, the honest upgrade case gets much weaker.
Is TradingView good for beginners?
Yes, and the free tier is the right starting point.
The interface is more approachable than most professional platforms, the paper trading account lets you practice order placement without risk, and crypto and forex charts are real-time at no cost.
The risk for beginners is feature overload.
Loading dozens of community indicators before understanding basic price structure produces confusion, not edge.
Start with one directional tool and add only what you can explain.
Do professional traders use TradingView?
Many independent and prop traders use it daily, primarily for technical analysis, charting, and alerts rather than as their execution venue. It’s common to see a professional charting on TradingView while executing through a dedicated broker platform with better order routing and depth-of-market tools.
Note that professional-user classification triggers substantially higher exchange data fees. Traders operating under a registered entity should budget for that difference before subscribing.
Can I use TradingView without a broker?
Yes.
Charting, alerts, screeners, watchlists, paper trading, and Pine Script all function completely standalone with no broker account attached.
What you can’t do is execute a live trade.
Order execution requires either a linked broker through the integration panel or manually placing the order in your broker’s own platform after your chart gives the signal.
Plenty of traders run exactly that split setup deliberately.
The Real Test: Track Results, Not Features
Feature comparisons are seductive because they’re easy.
Measuring whether a tool actually improved your trading is harder, and it’s the only test that counts.
Start with the frequency rule.
If you open charts daily and need multiple indicators and running alerts, upgrade.
If you check markets weekly and hold positions for weeks, stay free and put the difference into your account.
That rule resolves most cases without further analysis.
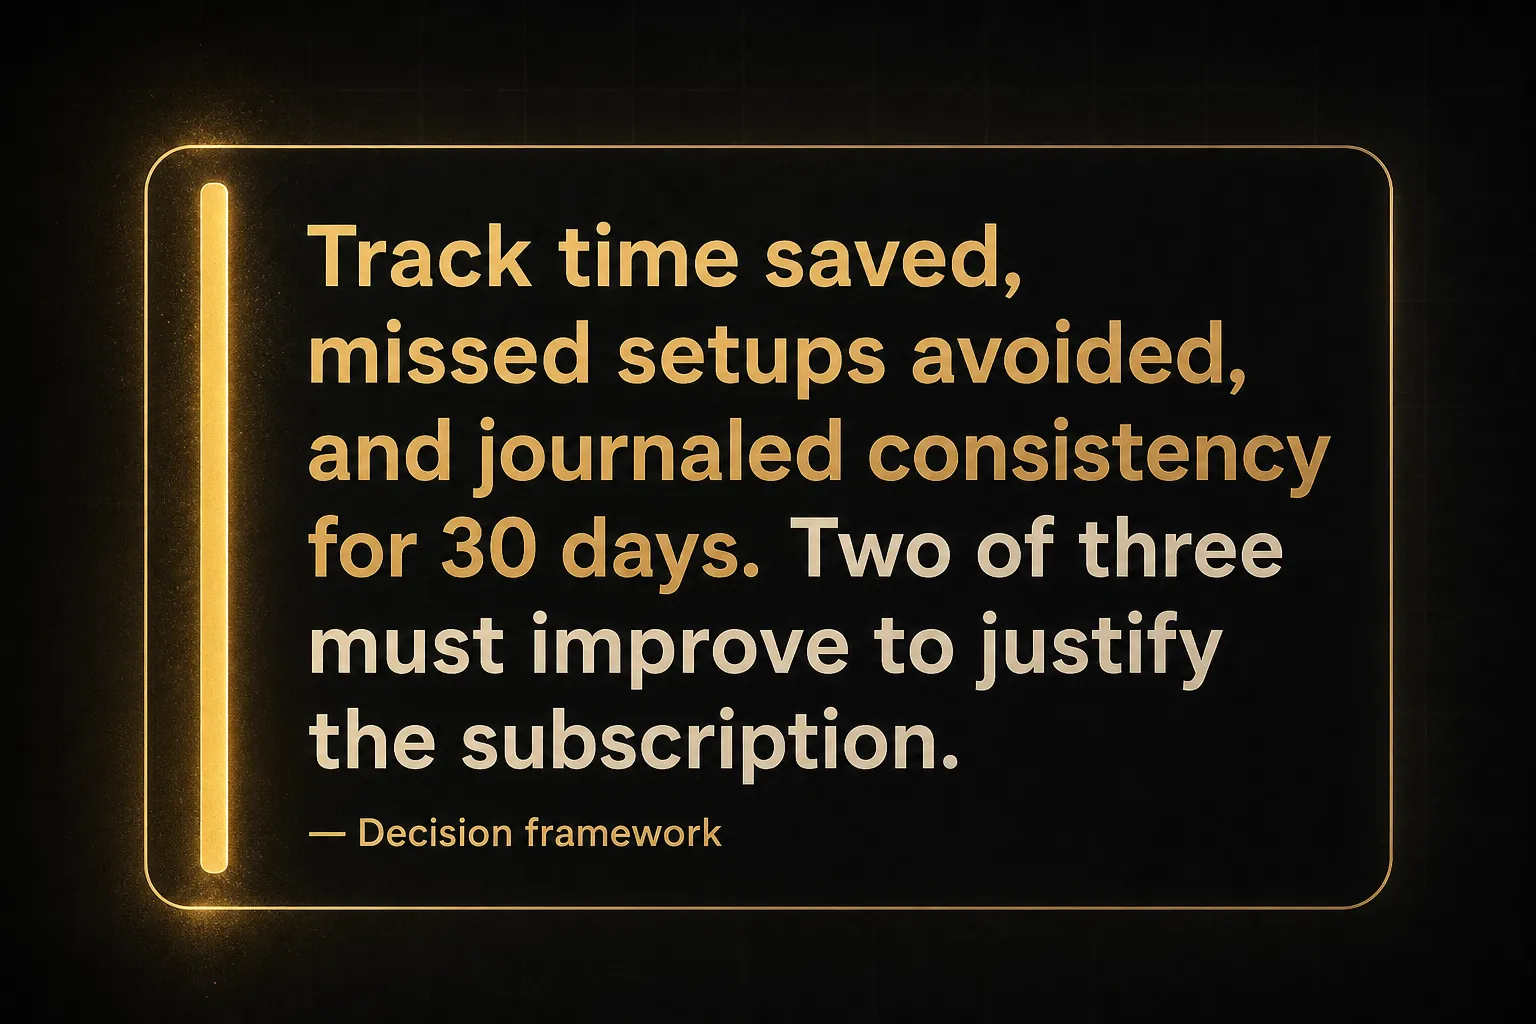
For the ambiguous middle, run a 30-day measurable test. Track three things: time saved (minutes per day spent switching tabs or manually checking levels), missed setups avoided (trades you’d have skipped without an alert), and journaled consistency (whether your entries and exits followed your written rules more reliably than before).
If after 30 days you can’t point to a concrete improvement in at least two of those three, downgrade.
No feature list survives that kind of scrutiny, and it shouldn’t have to.
The deeper point cuts across every platform decision you’ll make.
A charting subscription, an indicator suite, a signal service, a webhook bot: all of them support a decision process.
None of them contain one.
The trader with a tested strategy, defined position sizing, and a maintained journal will do fine on the free plan.
The trader without those things will lose money faster with better tools, because faster tools mean faster mistakes.
Build the process first.
Then buy the software that makes running it easier.
Sources
Risk Disclaimer: Trading involves risk. Past performance doesn't guarantee future results. Only trade with money you can afford to lose. PipTrend is a tool to assist your trading decisions, not financial advice.